
Categorical Model Estimation with Feature Selection Using an Ant
Colony Optimization
Tetiana Reznychenko
1 a
, Ev
ˇ
zenie Uglickich
2 b
and Ivan Nagy
1,2 c
1
Faculty of Transportation Sciences, Czech Technical University, Na Florenci 25, 11000 Prague, Czech Republic
2
Department of Signal Processing, Institute of Information Theory and Automation, Czech Academy of Sciences,
Pod vod
´
arenskou v
ˇ
e
ˇ
z
´
ı 4, 18208 Prague, Czech Republic
Keywords:
Categorical Model Estimation, Feature Selection, Ant Colony Optimization, Dimension Reduction.
Abstract:
This paper deals with the analysis of high-dimensional discrete data values from questionnaires, with the
aim of identifying explanatory variables that influence a target variable. We propose a hybrid algorithm that
combines categorical model estimation with an ant colony optimization scheme for feature selection. The
main contributions are: (i) the efficient selection of the most significant explanatory variables, and (ii) the
estimation of a categorical model with reduced dimensionality. Experimental results and comparisons with
well-known algorithms (e.g., random forest, categorical boosting, k-nearest neighbors) and feature selection
techniques are presented.
1 INTRODUCTION
This paper focuses on the analysis of discrete data ob-
tained from questionnaires. Such data sets typically
involve a large number of discrete variables, while
the sample size remains relatively small. This com-
bination presents substantial challenges in applying
standard mathematical techniques for data modeling
and prediction (Alwosheel et al., 2018; F
¨
oldes et al.,
2018), thereby reducing the accuracy of the analysis.
The questionnaires provide an effective way to
understand people’s preferences and are also used
in areas such as social science, transportation sci-
ence, medicine, marketing, and many others. Exam-
ples of specific applications of questionnaires include:
identifying accident causation factors (Wang et al.,
2023), improving transportation quality (Dell’Olio
et al., 2017), evaluating road quality and safety (Hu
et al., 2022), identifying injury causes (D. Zwahlen
and Pf
¨
affli, 2016), travel behavior analysis, examin-
ing the use of carsharing for various trips (Matowicki
et al., 2021), symptom evaluation, patient evaluation
(Phuong et al., 2023), etc.
The analysis of discrete data involves many statis-
tical approaches, including descriptive statistics, hy-
a
https://orcid.org/0009-0000-6725-8864
b
https://orcid.org/0000-0003-1764-5924
c
https://orcid.org/0000-0002-7847-1932
pothesis testing, and modeling associations between
categorical variables.
In univariate analysis, both nominal and ordinal
variables are explored using proportion estimation,
the chi-square goodness of fit test, and graphical tools
such as bar charts, pie charts, and histograms (Tang
et al., 2012; Agresti, 2018; Falissard, 2012). Bivari-
ate analysis examines the relationships between two
discrete variables. It includes estimating and compar-
ing proportions, using statistical tests such as the chi-
square test of independence (Agresti, 2018; Falissard,
2012), Fisher’s exact test for small samples with nom-
inal data (Agresti, 2018), rank-based measures such
as Goodman and Kruskal coefficients for nominal and
ordinal data (Goodman and Kruskal, 1963; Bergsma
and Lupparelli, 2025). For high-dimensional contin-
gency tables, multivariate methods are applied. The
Cochran-Mantel-Haenszel test enables stratified anal-
ysis of odds ratios and relative risks (Falissard, 2012),
while simple log-linear models offer a flexible frame-
work to capture complex interactions between cate-
gorical variables (Agresti, 2012; Stokes et al., 2012).
The analysis of discrete data is closely related
to the task of classification. Numerous algorithms
have been developed for classification. These algo-
rithms encompass decision trees (Azad et al., 2025),
random forest (Biau and Scornet, 2016), logistic re-
gression (Hosmer and Lemeshow, 2000), Bayesian
networks (Congdon, 2005), neural networks (Ag-
Reznychenko, T., Uglickich, E. and Nagy, I.
Categorical Model Estimation with Feature Selection Using an Ant Colony Optimization.
DOI: 10.5220/0013705300003982
Paper published under CC license (CC BY-NC-ND 4.0)
In Proceedings of the 22nd International Conference on Informatics in Control, Automation and Robotics (ICINCO 2025) - Volume 1, pages 219-226
ISBN: 978-989-758-770-2; ISSN: 2184-2809
Proceedings Copyright © 2025 by SCITEPRESS – Science and Technology Publications, Lda.
219

garwal, 2018), k-nearest neighbors (Zhang and Li,
2021), naive Bayes classifiers (Forsyth, 2019), gra-
dient boosting (Wade and Glynn, 2020), light gradi-
ent boosting machine (Wade and Glynn, 2020), cate-
gorical boosting (Hancock and Khoshgoftaar, 2020),
extreme gradient boosting (Wade and Glynn, 2020),
fuzzy rules (Berthold et al., 2013), genetic algo-
rithms (Reeves, 2010) and model-based methods in-
cluding the use of discrete mixture models such as la-
tent class and Rasch mixture models (Agresti, 2012),
Poisson and negative binomial mixtures (Congdon,
2005), mixtures of Poisson regressions, mixtures of
logistic regressions for binary data (Congdon, 2005),
Poisson-gamma and beta-binomial models (Agresti,
2012; Congdon, 2005) as well as Dirichlet mixtures
(Bouguila and Elguebaly, 2009; Li et al., 2019).
There are also recursive estimation algorithms for cat-
egorical mixtures with prior conjugate Dirichlet dis-
tributions (K
´
arn
´
y, 2016).
Discrete data analysis faces challenges such as un-
certainty and large dimensionality in a data set, lead-
ing to an exponential increase in the number of pos-
sible combinations. Two main approaches are used
to handle the high-dimensionality problem: (i) fea-
ture extraction methods such as principal component
analysis (Lovatti et al., 2019) for dimensionality re-
duction, multiple correspondence analysis (Roux and
Rouanet, 2010; Hjellbrekke, 2018) for categorical
data, neural network-based methods; (ii) feature se-
lection methods (Pereira et al., 2018), including L1
regularization (Suykens et al., 2014), random forest
importance (Genuer et al., 2010), categorical boost-
ing importance (Prokhorenkova et al., 2018), etc.
The key challenge is the high-dimensional na-
ture of the explanatory variables (Ray et al., 2021;
Ayesha et al., 2020), which complicates the analysis
and interpretation of the data. Thus, there is a criti-
cal need for effective dimensionality reduction tech-
niques that preserve or enhance classification accu-
racy while identifying the subset of variables that are
most informative about the target variable. The spe-
cific problem addressed in this work is the identifica-
tion of explanatory variables that are statistically as-
sociated with the target variable, enabling a reduction
in the complexity of the model.
This suggests that current methods for discrete
data analysis still require improvement (Jozova et al.,
2021). Inspired by feature selection heuristics used
in ensemble methods such as random forests, we pro-
pose a hybrid approach to reduce the dimensionality
of categorical models while preserving predictive per-
formance. This study introduces a novel method tai-
lored for discrete data sets with the aim of identifying
the most relevant subset of variables. The proposed
solution is based on two key points: (i) a categorical
model estimation, and (ii) a feature selection using ant
colony optimization.
The paper is organized as follows: Section 2
presents the preliminary part, introduces the neces-
sary notation, and reviews the basic facts about both
discrete data coding and the estimation of categori-
cal models. Section 3 is the main part of the paper.
Subsection 3.1 formulates the prediction problem in
general. Subsection 3.2 presents the proposed solu-
tion. The results of illustrative experiments are given
in Section 4, and Section 5 provides conclusions and
future plans.
2 PRELIMINARIES
This section provides a basic concept about the cate-
gorical models and techniques utilized in this paper.
The categorical model has the following form:
f (y|x,α) = α, (1)
where f (·|·) denotes a conditional probability func-
tion; y is a discrete target variable; x = [x
1
,x
2
,...,x
N
]
is the discrete multivariate explanatory variable, and
N is the number of variables; α is a model parameter
which contains the probabilities of individual combi-
nations of the target and explanatory variables.
Model estimation in the standard case is straight-
forward. For multivariate models, vector coding must
first be introduced. This process is illustrated using an
example with two variables x
1
∈ 1,2,3 and x
2
∈ 1,2,
with all possible combinations and their correspond-
ing codes z summarized in Table 1.
Table 1: The coding of the data set.
x
1
1 1 2 2 3 3
x
2
1 2 1 2 1 2
z 1 2 3 4 5 6
For the estimation of the categorical model, the
values of y and x are measured, the code z is deter-
mined, and the frequencies of the vector y|z are calcu-
lated. This is illustrated in Table 2, where the values
of y ∈ {1,2} are vertically positioned in the table, and
the encoded values z are horizontally positioned. The
table is normalized so that the sums of entries in the
columns are equal to one. By normalizing, we obtain
probability values for every combination of y
t
and the
corresponding code z
t
, which define the estimated pa-
rameters of the coded model.
Ant Colony Optimization is a metaheuristic al-
gorithm inspired by the behavior of real ants to find
the shortest path from a colony to a food source.
ICINCO 2025 - 22nd International Conference on Informatics in Control, Automation and Robotics
220

Table 2: Estimation of the categorical model.
y/z 1 2 3 4 5 6
y = 1 α
1|1
α
1|2
α
1|3
α
1|4
α
1|5
α
1|6
y = 2 α
2|1
α
2|2
α
2|3
α
2|4
α
2|5
α
2|6
The main concept of this approach is based on
modeling the environment as a graph G = (V,E),
where V consists of two nodes, namely v
s
represents
the nest of the ants and v
d
is the food source. E con-
sists of two links, namely e
1
, which represents the
short path l
1
between v
s
and v
d
, and e
2
represents the
long path l
2
(l
2
> l
1
). The real ants lay pheromone on
the paths. Accordingly, we introduce a value p
i
to de-
note the pheromone intensity on each of the two paths
e
i
, i = 1,2.
Each ant starts at v
s
and selects a path with proba-
bility θ
i
between the edges e
1
and e
2
to reach the food
source v
d
. If θ
1
> θ
2
, the probability of choosing e
1
is higher. Moreover, as more ants select a particular
path, the corresponding θ
i
increases. Links that are
not used eventually lose the pheromone and are reset
(Blum, 2005; Fidanova, 2021).
3 CATEGORICAL MODEL
ESTIMATION WITH FEATURE
SELECTION USING AN ANT
COLONY OPTIMIZATION
3.1 Problem Formulation
Consider a categorical model with a discrete target
variable y
t
and a set of discrete explanatory variables
x
1;t
,x
2;t
,...,x
N;t
in a discrete time instant t, where
t = 1,2,..,T and T denote the number of records.
The target variable y
t
and the explanatory variables
x
t
= [x
1
,x
2
,...,x
N
]
t
are measured in time t ≤ T . The
model estimation is performed using training data.
For t > T , we only measure x
t
and predict the target
using test data.
The aim is to predict a discrete target based on N
explanatory variables x
t
= [x
1
,x
2
,...,x
N
]
t
. However,
we assume that not all variables from the vector x
t
are important for this prediction. The task is to find
an optimal selection of variables x
t
= [x
1
,x
2
,..,x
N
∗
],
where N
∗
is a pre-selected and fixed, for which the
quality of prediction is best, and there is a function
ϕ : x → Accuracy(x). (2)
We look for optimal selection for which
Accuracy(x) is maximal. This is the optimiza-
tion task. Unfortunately, the criterion function is
discrete with an extremely huge definition domain.
The optimization method for ant colonies looks like
a possible tool for the solution.
We define a graph with G nodes, each represent-
ing an individual explanatory variable. The process
begins by randomly selecting a starting node and then
repeatedly choosing the edge with the highest weight
in the S steps. Initially, all edge weights are set to
zero.
Once a path is selected, the variables correspond-
ing to the nodes along this path are used to estimate
the categorical model. The resulting model is evalu-
ated on the basis of its prediction error. Depending
on the evaluation, the edges along the selected path
are updated with new weights. Additionally, all edge
weights are subject to exponential forgetting.
The next step involves randomly selecting a start-
ing point, which is repeated many times until the path
is fixed.
The idea of the proposed solution is to estimate the
categorical model for various subsets of explanatory
variables and to employ ant colony optimization to
identify an optimal subset.
3.2 Overview of the Proposed Solution
The core principle of the hybrid algorithm is to ran-
domly generate P
K
subsets of unique explanatory
variables. Then, we estimate the parameter α, per-
form the estimation of the K models, and predict the
target variable. Predictive accuracy is used to deter-
mine the quality of the constructed K models and the
efficiency of the x
t
. Based on the accuracy of the
model, using the ant colony optimization scheme, the
influence weights of the variables are determined. If
the accuracy of the model P
K
< P
K+1
, we increase
the influence weight of the variables included in this
subset. Otherwise, we ignore the model. Explaining
variables that are not updated, their influence weights
are forgotten. The proposed solution includes the fol-
lowing steps:
Algorithm setup:
1. Set a number of features f .
2. Set a coefficient of forgetting β.
Initialization of solution vectors:
1. Randomly create P
k
subsets that consist of f
number of variables. Exp: f = 3, where P
1
=
[5,15,19].
2. Evaluate each entry in P
K
and calculate the accu-
racy, which is an indicator of the quality of the
categorical model.
3. Calculate the weight of each variable for each so-
lution.
Categorical Model Estimation with Feature Selection Using an Ant Colony Optimization
221

Time loop:
For i = 1,2,..,S:
1. Creating new solutions: randomly select a vec-
tor P
k
from the set of K solutions. Each vector
represents a subset of selected features. Then a
feature is randomly chosen; for example, consider
P
1
= [5,15,19], and suppose that the second ele-
ment, 15, is selected for modification. The chosen
feature is then decomposed into a set of alterna-
tive features, which include neighboring variables
such as {11,12,13,15,16,17,18}. From this set,
select the variable that has the highest weight. The
new solution is P
11
= [5,11,19].
2. Evaluate the solution and update the weights of
the variables.
3. Sort the solutions by accuracy. Variables that are
not used, then their weight is multiplied by the
forgetting coefficient.
Stopping criterion:
Stop the algorithm if the computation does not
modify during m iterations.
end
4 EXPERIMENTS
The experiments were conducted to evaluate the ef-
fectiveness of the proposed method in feature se-
lection and classification, comparing its performance
with that of widely used algorithms.
For this purpose, a publicly available data set from
the Kaggle platform (Kaggle, 2019) was used. This
data set is based on a survey of people’s use of on-
line food delivery services. It aims to identify the
factors that are driving the growing demand for these
services, particularly in metropolitan areas. The re-
search focuses on the following aspects: 1) demo-
graphic characteristics of consumers, 2) general be-
havioral patterns in purchasing decisions, and 3) the
influence of delivery time on consumer preferences.
To ensure a comprehensive understanding of the
characteristics of the sample, the data values were col-
lected using a structured closed-ended questionnaire.
The responses were recorded on a five-point Likert
scale and the survey included questions that covered a
variety of sociodemographic variables. The distribu-
tion of the participants by these variables is presented
in Table 3.
Before applying machine learning methods, the
data set was thoroughly cleaned. This involved
eliminating special characters, null entries, duplicate
records, and irrelevant content that could negatively
impact the quality of the analysis. The cleaned data
Table 3: Sociodemographic characteristics of the partici-
pants.
Variable Categories
Age range 18–33 years
Gender Male, Female
Marital status Single, Married, Prefer not to say
Occupation Student, Employee, Housewife, Self-employed
Monthly income No income, <Rs.10k, Rs.10k–25k,
Rs.25k–50k, >Rs.50k
Education level Uneducated, School, Graduate,
Postgraduate, Ph.D.
Family size 1–6 members
set used for the final analysis consisted of 286 obser-
vations in 45 variables (which are specified in Table
4). The binary target variable includes class label 1,
which corresponds to ”Yes – I will order online deliv-
ery,” while class label 0 represents ”No – I will not or-
der online delivery.” The data set is imbalanced, with
77.3% of the responses indicating ”Yes” and only
22.7% indicating ”No.” This imbalance poses a chal-
lenge for classification models, particularly in main-
taining high performance across both classes. The
data values were recoded for analysis, and the recoded
values are presented in Table 4. Five data sets were
randomly shuffled based on the main data set. Each
data set was divided into two subsets: 80% for train-
ing and 20% for testing.
The experiments were performed using Jupyter
Notebook with Python 3.10.12, leveraging well-
established machine learning libraries such as
scikit-learn (www.scikit-learn.org), pandas (pan-
das.pydata.org), and AutoGluon (auto.gluon.ai).
These tools facilitated data preprocessing, model de-
velopment, and performance evaluation. In addition,
Scilab (www.scilab.org) was employed to test and
validate the proposed method, using its capabilities
for numerical analysis and algorithm verification.
4.1 Performance Assessment Using
Survey Data Values
In this series of experiments, we focus on determining
the key parameters for building a classification model.
One of the configurations under consideration is
the number of explanatory variables (features) used
to train the model. To investigate this, we vary the
number of features f from 1 to 10. The quality of each
feature selection is evaluated using a score, defined as
the predictive accuracy of the model.
To identify the optimal number of features, the
experiments were conducted in five data sets. Fig-
ure 1 shows how the model accuracy changes with the
number of features and presents the average accuracy
across all data sets.
As shown, the highest accuracy of 94.1% was ob-
ICINCO 2025 - 22nd International Conference on Informatics in Control, Automation and Robotics
222
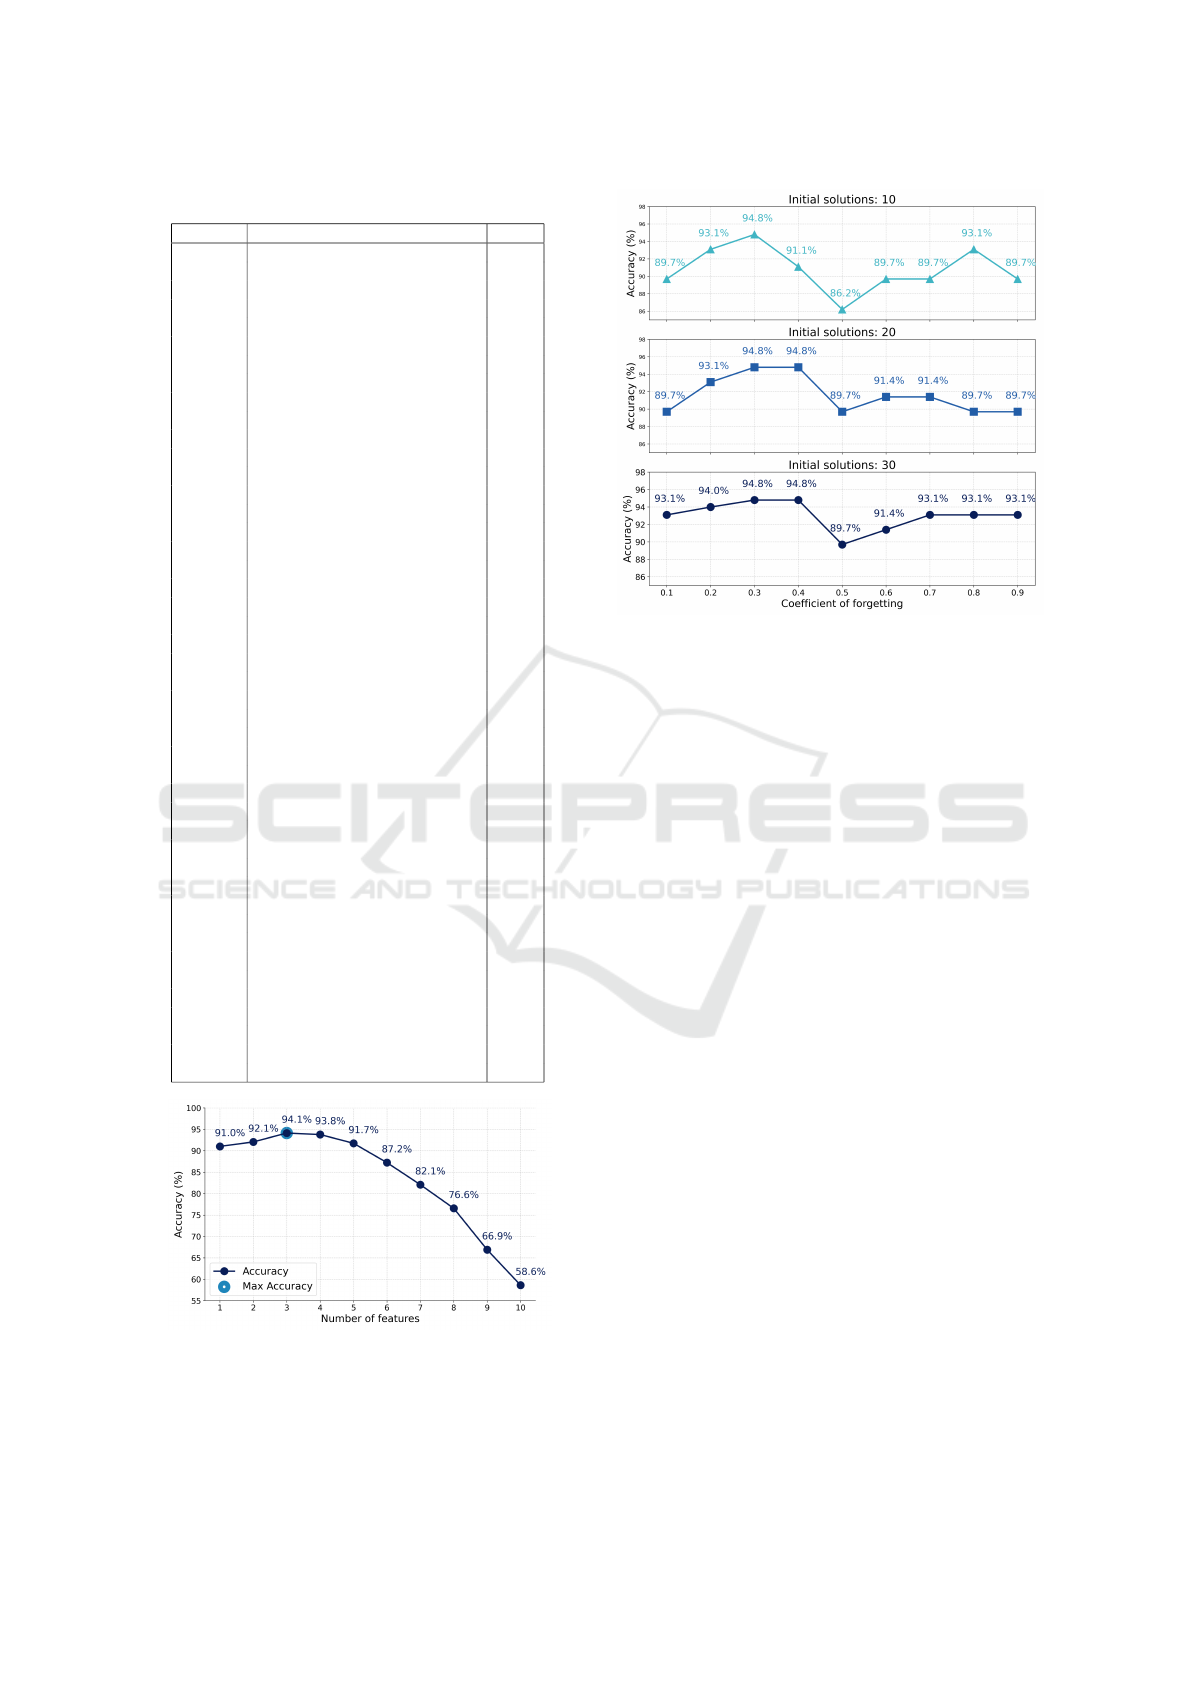
Table 4: Variables and their value ranges.
Variable Name Value
1 Age 1–7
2 Gender 1–2
3 Marital Status 1–3
4 Occupation 1–4
5 Monthly Income 1–3
6 Education 1–5
7 Family Size 1–6
8 Ease and Convenience 1–3
9 Time Saving 1–3
10 More Restaurant Choices 1–3
11 Easy Payment Option 1–3
12 More Offers and Discounts 1–3
13 Good Food Quality 1–3
14 Good Tracking System 1–3
15 Self Cooking 1–3
16 Health Concern 1–3
17 Late Delivery 1–3
18 Poor Hygiene 1–3
19 Bad Past Experience 1–3
20 Unavailability 1–3
21 Unaffordable 1–3
22 Long Delivery Time 1–3
23 Delay in Assigning Delivery Person 1–3
24 Delay in Picking Up Food 1–3
25 Wrong Order Delivered 1–3
26 Missing Item 1–3
27 Order Placed by Mistake 1–3
28 Influence of Time 1–3
29 Order Time 1–3
30 Maximum Wait Time 1–5
31 Residence in Busy Location 1–3
32 Google Maps Accuracy 1–3
33 Good Road Condition 1–3
34 Low Quantity, Low Time 1–3
35 Delivery Person Ability 1–3
36 Influence of Rating 1–3
37 Less Delivery Time 1–3
38 High Quality of Package 1–3
39 Number of Calls / Politeness 1–3
40 Freshness 1–3
41 Politeness 1–3
42 Temperature 1–3
43 Good Taste 1–3
44 Good Quantity 1–3
45 Output 0–1
Figure 1: Accuracy comparison with number of features
from 1 to 10.
tained using three features, while using four led to a
Figure 2: Accuracy comparison concerning the forgetting
coefficient and the number of initial candidate solutions,
with the number of features fixed at three.
slightly lower mean accuracy of 93.8%.
Based on this result, the next experiment was con-
ducted to investigate the effect of two parameters on
model performance: the forgetting coefficient β (var-
ied from 0.1 to 0.9) and the number of initial can-
didate solutions P
k
. For this analysis, the number of
features n
f
was fixed at three.
As shown in Figure 2, the model achieves the
highest accuracy when the forgetting coefficient β is
in the range of 0.2 to 0.4. Moreover, increasing the
number of initial candidate solutions to 30 leads to
improved predictive accuracy, indicating that greater
diversity in initialization improves model accuracy.
4.2 Models Comparison
The goal of these experiments is to evaluate and com-
pare established machine learning algorithms to de-
termine which perform best on discrete data. A set
of baseline algorithms was selected for comparison
with the proposed method, including random for-
est (RF), categorical boosting (CatBoost), k-nearest
neighbors (KNeighbors), light gradient boosting ma-
chine (LightGBM), an extended variant of LightGBM
with increased model capacity (LightGBMLarge), ex-
treme gradient boosting (XGBoost), and a neural net-
work implemented using the FastAI library (Neu-
ralNetFastAI). All experiments and model evalua-
tions were conducted using the AutoGluon library
(auto.gluon.ai).
The model parameters were fixed according to the
previous analysis: the number of features was set to
Categorical Model Estimation with Feature Selection Using an Ant Colony Optimization
223
three, the forgetting coefficient to 0.3, and the number
of initial candidate solutions to 30.
Table 5 summarizes the classification accuracy
of each model. The proposed method achieved the
highest average accuracy of 94.1%, outperforming all
other models. CatBoost followed with 90.7%, Ran-
dom Forest with 90.3%, and KNeighbors with 90.0%.
Table 5: Comparison of the performance of algorithms on
five data sets.
Algorithm DS 1 DS 2 DS 3 DS 4 DS 5 Average
Proposed method 94.8% 93.1% 93.1% 93.1% 96.6% 94.1%
CatBoost 94.8% 87.9% 91.4% 89.7% 89.7% 90.7%
RandomForest 94.8% 89.7% 89.7% 87.9% 89.7% 90.3%
KNeighbors 93.1% 87.9% 89.7% 89.7% 89.7% 90.0%
LightGBM 96.6% 89.7% 89.7% 82.8% 86.2% 89.0%
XGBoost 90.0% 87.9% 87.9% 87.9% 84.5% 87.6%
NeuralNetFastAI 91.4% 79.3% 86.2% 87.9% 82.8% 85.5%
LightGBMLarge 84.5% 82.8% 86.2% 84.5% 87.9% 85.2%
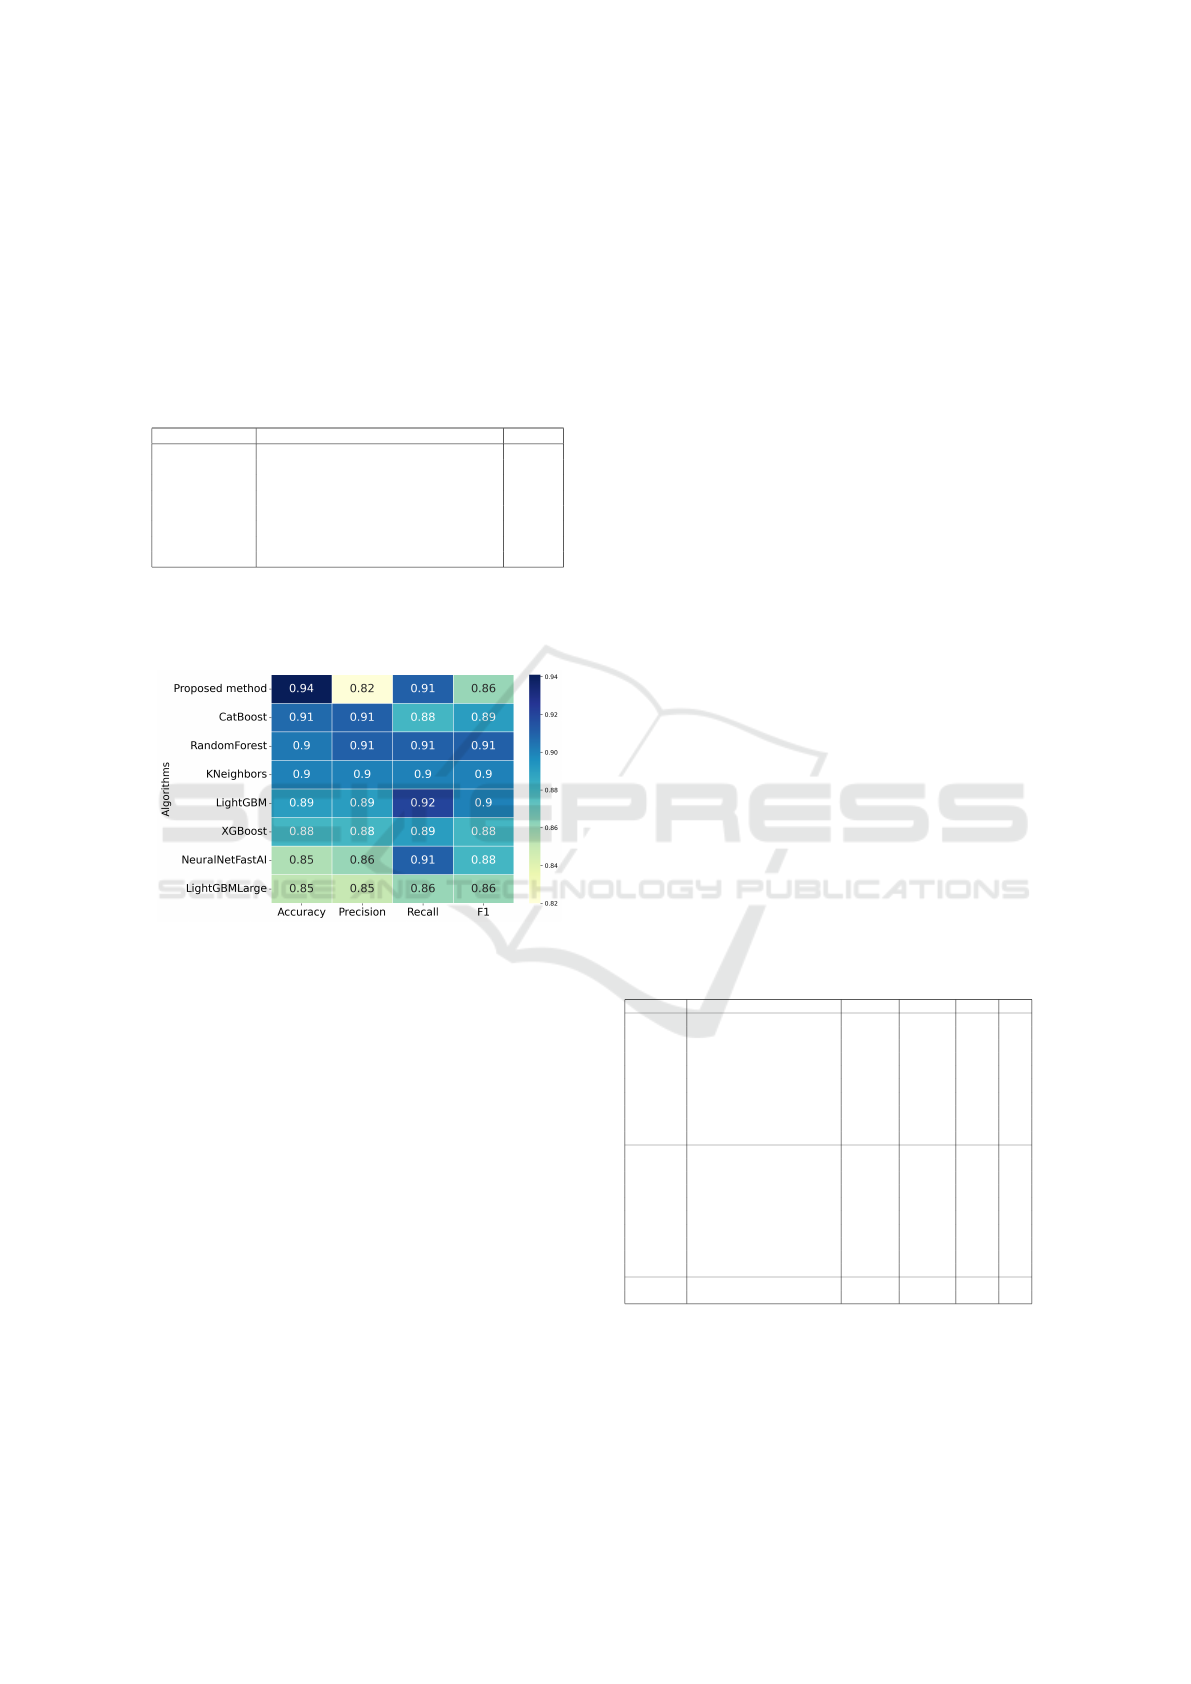
Figure 3 presents a heat map summarizing the av-
erage performance of each model in four key evalua-
tion metrics: accuracy, precision, recall, and F1 score.
Figure 3: Average performance metrics for each classifica-
tion model.
Models such as Random Forest and CatBoost
achieve precision and recall values near 0.91, leading
to the highest F1 scores 0.91. The proposed method
achieves a recall 0.91. However, its precision 0.82 is
lower than that of other models.
In this experiment, all machine learning algo-
rithms except the proposed method were applied to
the full set of input variables. Challenges associ-
ated with the dataset’s high dimensionality will be
addressed in subsequent experiments that aim to im-
prove performance and reduce the number of input
features.
4.3 Feature Selection
This stage aims to conduct experiments using a re-
duced set of variables to achieve efficient classifica-
tion. Feature selection was applied to identify the
most informative variables from the full set.
As discussed in Subsection 4.2, Random Forest
and CatBoost demonstrated the highest classification
performance among the baseline models. Therefore,
feature importance selection methods tailored to each
algorithm were employed. For Random Forest, im-
portance scores were computed using the Mean De-
crease in Impurity (as implemented in scikit-learn).
For CatBoost, the default feature importance method
– PredictionValuesChange (catboost.ai) – was used.
Two configurations of the proposed hybrid
method were evaluated. The model setup followed the
best-performing parameters from earlier experiments:
a forgetting coefficient β of 0.3 and 30 initial candi-
date solutions. The number of selected variables was
set to 3 for the first configuration and 4 for the second.
Feature sets ranging in size from one to nine were
established for each algorithm. The results are pre-
sented in Table 6. Random Forest achieved an accu-
racy of 91.4% with seven variables, where the preci-
sion was 0.90, the recall and the F1 score decreased
to 0.81 and 0.84, respectively. CatBoost achieved an
improved accuracy of 93.1% with an F1 score of 0.87.
The results of the proposed method applied to
different subsets of variables are shown in Table
6. When using the variables set {9,22,37,42}, the
model achieved the highest accuracy of 94.8%, with
a precision of 0.90, recall of 0.82, and an F1 score
of 0.86. This indicates effective overall performance.
In contrast, using a smaller subset of three features
{9,17,21} led to a slight decrease in performance.
The model achieved the accuracy of 93.1%, a preci-
sion of 0.89, a recall of 0.73, and an F1 score of 0.80.
Table 6: Comparison of model performances with different
feature sets.
Algorithm Selected variables Accuracy Precision Recall F1
RF all variables 91.4% 0.91 0.90 0.91
10 84.5% 0.77 0.66 0.69
10, 11 84.5% 0.77 0.66 0.69
10, 11, 12 82.8% 0.72 0.72 0.72
10, 11, 12, 9 87.9% 0.82 0.75 0.78
10, 11, 12, 9, 14 87.9% 0.82 0.75 0.78
10, 11, 12, 9, 14, 1 84.5% 0.77 0.66 0.69
10, 11, 12, 9, 14, 1, 21 91.4% 0.90 0.81 0.84
10, 11, 12, 9, 14, 1, 21, 30 89.6% 0.88 0.76 0.80
10, 11, 12, 9, 14, 1, 21, 1, 30, 13 89.7% 0.88 0.76 0.80
CatBoost all variables 89.7% 0.89 0.89 0.89
8 89.7% 0.94 0.73 0.78
8, 9 86.2% 0.80 0.71 0.74
8, 9, 1 81.0% 0.67 0.57 0.58
8, 9, 1, 12 84.5% 0.77 0.66 0.69
8, 9, 1, 12, 2 86.2% 0.83 0.67 0.71
8, 9, 1, 12, 2, 17 93.1% 0.96 0.82 0.87
8, 9, 1, 12, 2, 17, 9 91.4% 0.95 0.77 0.83
8, 9, 1, 12, 2, 17, 9, 23 89.7% 0.94 0.73 0.78
8, 9, 1, 12, 2, 17, 9, 23, 11 89.7% 0.94 0.73 0.78
PM 9, 17, 21 93.1% 0.89 0.73 0.80
9, 22, 37, 42 94.8% 0.90 0.82 0.86
Table 7 presents the classification performance of
the Random Forest and CatBoost models when ap-
plied to feature subsets selected by the proposed hy-
brid method (PM). The models were evaluated on fea-
ture subsets selected by the proposed method.
ICINCO 2025 - 22nd International Conference on Informatics in Control, Automation and Robotics
224

Table 7: Performance of models with selected features us-
ing the proposed method.
Algorithm Selected variables Accuracy Precision Recall F1
Random Forest with PM 9, 17, 21 93.1% 0.91 0.85 0.88
Random Forest with PM 9, 22, 37, 42 94.8% 0.93 0.90 0.91
CatBoost with PM 9, 17, 21 93.1% 0.91 0.85 0.88
CatBoost with PM 9, 22, 37, 42 94.8% 0.93 0.90 0.91
Both models achieved their highest accuracy of
94.8% when using the feature subset 9, 22,37,42,
with precision, recall, and F1 score of 0.93, 0.90,
and 0.91, respectively. When a reduced subset of
three features 9, 17, 21 was used, accuracy slightly de-
creased to 93.1% for both Random Forest and Cat-
Boost. The corresponding precision, recall, and F1
score also declined to 0.91, 0.85, and 0.88, respec-
tively.
4.4 Discussion
This study aimed to validate the proposed method
and select a subset of explanatory variables for which
a categorical model can optimally predict the target
variable. This objective was achieved successfully.
The results demonstrated that the method achieves
high accuracy when the optimal subset consists of
only four variables. Moreover, the selected variables
enhanced the performance of both the Random Forest
and CatBoost models.
One limitation of the proposed hybrid algorithm
is its reliance on randomly generating variable sub-
sets, which can increase computational time during
the search for the most relevant subset. Addition-
ally, the method requires careful setting of parameters
such as the subset size and the forgetting coefficient,
which may reduce the performance of a model. De-
spite these limitations, the algorithm has the potential
to analyze questionnaire data in fields such as market-
ing, the social sciences, and transportation research,
where identifying a reduced set of informative cate-
gorical variables is essential.
5 CONCLUSION
This study focused on analyzing discrete data ob-
tained from questionnaires. The paper presented the
hybrid method for categorical model estimation with
feature selection using an ant colony optimization.
The proposed method was applied to discrete ques-
tionnaire data to select a subset of explanatory vari-
ables to predict the target variable. To assess the
effectiveness of the presented method, experiments
were conducted.
The main contributions of this study are the iden-
tification of a relevant set of variables – achieved
by evaluating multiple categorical models using ant
colony optimization – and the reduction of the
model’s dimensionality. Further work will focus on
improving and optimizing the search for relevant vari-
ables, which will enhance both the speed of determi-
nation and the accuracy, thereby increasing the effi-
ciency in solving complex tasks.
In general, the proposed method shows potential
as a useful tool in practical tasks related to question-
naire data analysis, where preserving information in
high-dimensional discrete models is important.
ACKNOWLEDGEMENTS
This paper was funded by the project
SGS25/096/OHK2/2T/16 from the Student Grant
Competition of the Czech Technical University in
Prague, Faculty of Transportation Sciences.
European Funding: Under grant 101096884, Lis-
ten2Future is co-funded by the European Union.
Views and opinions expressed are however those of
the author(s) only and do not necessarily reflect those
of the European Union or Chips Joint Undertaking.
Neither the European Union nor the granting author-
ity can be held responsible for them. The project is
supported by the CHIPS JU and its members (includ-
ing top-up funding by Austria, Belgium, Czech Re-
public, Germany, Netherlands, Norway and Spain.
National Funding: This project has also received
national funding from the Ministry of Education,
Youth and Sports of the Czech Republic (MEYS) un-
der grant agreement No 9A22004.
REFERENCES
Aggarwal, C. C. (2018). Neural Networks and Deep Learn-
ing: A Textbook. Springer.
Agresti, A. (2012). Categorical Data Analysis. John Wiley
& Sons, 3rd edition.
Agresti, A. (2018). An Introduction to Categorical Data
Analysis. Wiley, 3rd edition.
Alwosheel, A., Cranenburgh, S. V., and Chorus, C. G.
(2018). Is your dataset big enough? sample size re-
quirements when using artificial neural networks for
discrete choice analysis. Journal of Choice Modelling,
28:167–182.
Ayesha, S., Hanif, M. K., and Talib, R. (2020). Overview
and comparative study of dimensionality reduction
techniques for high dimensional data. Information Fu-
sion, 59:44–58.
Azad, M., Nehal, T. H., and Moshkov, M. (2025). A novel
ensemble learning method using majority based vot-
ing of multiple selective decision trees. Computing,
107(1):42.
Categorical Model Estimation with Feature Selection Using an Ant Colony Optimization
225

Bergsma, W. and Lupparelli, M. (2025). Editorial for spe-
cial issue on categorical data analysis. Metrika, pages
1–3.
Berthold, M. R., Wiswedel, B., and Gabriel, T. R. (2013).
Fuzzy logic in knime – modules for approximate rea-
soning. International Journal of Computational Intel-
ligence Systems, 6(1):34–45.
Biau, G. and Scornet, E. (2016). A random forest guided
tour. Test, 25(2):197–227.
Blum, C. (2005). Ant colony optimization: Introduction and
recent trends. Physics of Life Reviews, 2(4):353–373.
Bouguila, N. and Elguebaly, W. (2009). Discrete data clus-
tering using finite mixture models. Pattern Recogni-
tion, 42(1):33–42.
Congdon, P. (2005). Bayesian Models for Categorical Data.
John Wiley Sons.
D. Zwahlen, C. J. and Pf
¨
affli, M. (2016). Sleepiness, driv-
ing, and motor vehicle accidents: a questionnaire-
based survey. Journal of Forensic and Legal Medicine,
44:183–187.
Dell’Olio, L., Ibeas, A., de O
˜
na, J., and de O
˜
na, R.
(2017). Public transportation quality of service: Fac-
tors, models, and applications. Elsevier.
Falissard, B. (2012). Analysis of Questionnaire Data with
R. Chapman & Hall/CRC, Boca Raton.
Fidanova, S. (2021). Ant colony optimization. In Ant
Colony Optimization and Applications, pages 3–8.
Springer International Publishing, Cham.
Forsyth, D. (2019). Applied Machine Learning. Springer.
F
¨
oldes, D., Csisz
´
ar, C., and Zarkeshev, A. (2018). User
expectations towards mobility services based on au-
tonomous vehicle. In 8th International Scientific Con-
ference CMDTUR, pages 7–14.
Genuer, R., Poggi, J. M., and Tuleau-Malot, C. (2010).
Variable selection using random forests. Pattern
Recognition Letters, 31(14):2225–2236.
Goodman, L. A. and Kruskal, W. H. (1963). Measures of
association for cross classifications iii: approximate
sampling theory. Journal of the American Statistical
Association, 58(302):310–364.
Hancock, J. T. and Khoshgoftaar, T. M. (2020). Catboost
for big data: an interdisciplinary review. Journal of
Big Data, 7(1):94.
Hjellbrekke, J. (2018). Multiple Correspondence Analysis
for the Social Sciences. Routledge.
Hosmer, D. W. and Lemeshow, S. (2000). Applied Logistic
Regression. Wiley-Interscience, 2nd edition.
Hu, Y., Li, Y., Huang, H., Lee, J., Yuan, C., and Zou,
G. (2022). A high-resolution trajectory data driven
method for real-time evaluation of traffic safety. Acci-
dent Analysis & Prevention, 165:106503.
Jozova, S., M. Matowicki, O. Pribyl, M. Z. S. O., and Zi-
olkowski, R. (2021). On the analysis of discrete data
finding dependencies in small sample sizes. Neural
Network World, 31(5):311.
Kaggle (2019). Online food delivery
preferences-bangalore region. Available:
https://www.kaggle.com/datasets/benroshan/online-
food-delivery-preferencesbangalore-region.
K
´
arn
´
y, M. (2016). Recursive estimation of high-order
markov chains: Approximation by finite mixtures. In-
formation Sciences, 326:188–201.
Li, Y., Schofield, E., and G
¨
onen, M. (2019). A tutorial on
dirichlet process mixture modeling. Journal of Math-
ematical Psychology, 91:128–144.
Lovatti, B. P., Nascimento, M. H., Neto,
´
A. C., Cas-
tro, E. V., and Filgueiras, P. R. (2019). Use of random
forest in the identification of important variables. Mi-
crochemical Journal, 145:1129–1134.
Matowicki, M., Pribyl, O., and Pecherkova, P. (2021). Car-
sharing in the czech republic: Understanding why
users chose this mode of travel for different purposes.
Case Studies on Transport Policy, 9(2):842–850.
Pereira, R. B., Plastino, A., Zadrozny, B., and Merschmann,
L. H. (2018). Categorizing feature selection methods
for multi-label classification. Artificial Intelligence
Review, 49:57–78.
Phuong, N. T., Hoang, P. V., Dang, T. M., Huyen, T. N. T.,
and Thi, T. N. (2023). Improving hospital’s quality
of service in vietnam: the patient satisfaction eval-
uation in multiple health facilities. Hospital Topics,
101(2):73–83.
Prokhorenkova, L., Gusev, G., Vorobev, A., Dorogush,
A. V., and Gulin, A. (2018). Catboost: unbiased boost-
ing with categorical features. In Advances in Neural
Information Processing Systems, volume 31.
Ray, P., Reddy, S. S., and Banerjee, T. (2021). Various
dimension reduction techniques for high dimensional
data analysis: a review. Artificial Intelligence Review,
54(5):3473–3515.
Reeves, C. R. (2010). Genetic algorithms, pages 109–139.
Roux, B. L. and Rouanet, H. (2010). Multiple Correspon-
dence Analysis, volume 163. Sage.
Stokes, M. E., Davis, C. S., and Koch, G. G. (2012). Cate-
gorical Data Analysis Using SAS. SAS Institute, 3rd
edition.
Suykens, J. A., Signoretto, M., and Argyriou, A. (2014).
Regularization, Optimization, Kernels, and Support
Vector Machines. CRC Press.
Tang, W., He, H., and Tu, X. M. (2012). Applied Cat-
egorical and Count Data Analysis. Chapman and
Hall/CRC.
Wade, C. and Glynn, K. (2020). Hands-On Gradient Boost-
ing with XGBoost and scikit-learn: Perform accessi-
ble machine learning and extreme gradient boosting
with Python. Packt Publishing Ltd.
Wang, W., Wang, Y., Wang, G., Li, M., and Jia, L. (2023).
Identification of the critical accident causative factors
in the urban rail transit system by complex network
theory. Physica A: Statistical Mechanics and its Ap-
plications, 610:128404.
Zhang, S. and Li, J. (2021). Knn classification with one-
step computation. IEEE Transactions on Knowledge
and Data Engineering, 35(3):2711–2723.
ICINCO 2025 - 22nd International Conference on Informatics in Control, Automation and Robotics
226
