
From Traditional to Intelligent: The Theoretical Foundations,
Method Comparisons, and Challenges of Stock Price Prediction
Models
Qiancheng Rong
a
School of Mathematics and Statistics, The University of Sydney, Camperdown, New South Wales 2006, Australia
Keywords: Machine Learning; Deep Learning; Stock Price Prediction.
Abstract: Stock prices are a fundamental component of financial markets, encapsulating collective investor expectations
and serving as a crucial basis for economic decision-making. The accurate prediction of price movements
remains a longstanding challenge in financial research, driven by the complex, nonlinear, and dynamic nature
of market behavior. With the proliferation of high-frequency financial data and advancements in
computational methodologies, a diverse array of predictive models has been developed, ranging from
traditional statistical techniques to sophisticated machine learning algorithms. This paper aims to provide a
comprehensive review of the principal methodologies and recent advancements in stock price forecasting. It
covers traditional statistical approaches such as Support Vector Machines (SVM), Random Forests (RF),
Long Short-Term Memory networks (LSTM), Convolutional Neural Networks (CNN), and Reinforcement
Learning (RL). By examining the underlying mechanisms, performance metrics, and implementation
challenges, this paper offers a structured perspective on the diverse methodologies employed in stock price
prediction, which contributes to a deeper understanding of their theoretical foundations and key characteristics.
1 INTRODUCTION
Stocks are a fundamental financial instrument that
represents a share of ownership in a company.
Investors holding stocks thereby become partial
owners and are entitled to a proportional claim on the
company’s assets and profits. In the stock market,
prices are determined by a confluence of factors,
including supply and demand dynamics, market
sentiment, and corporate performance. In the global
financial arena, forecasting stock prices has long been
a central challenge in both theoretical and practical
investment research, as prediction accuracy directly
influences investment decisions, risk management,
and capital allocation (Sun et al., 2020; Sun et al.,
2019; Raza et al., 2014).
Traditional time series models, such as the
AutoRegressive Integrated Moving Average
(ARIMA) model, have historically provided robust
tools for stock price forecasting. In recent years, the
advent of big data, the exponential growth in
computational power, and the rapid development of
a
https://orcid.org/0009-0007-3613-8473
Artificial Intelligence techniques have ushered in
significant advancements in stock price prediction.
Emerging methodologies are gradually dominating
this field involving Support Vector Machines (SVM),
Random Forests (RF), Long Short-Term Memory
networks (LSTM), Convolutional Neural Networks
(CNN), and Reinforcement Learning (RL). These
models not only possess the capacity to automatically
mine hidden patterns from vast datasets but also
exhibit commendable flexibility and precision when
processing long-term dependencies and non-
stationary data.
This paper aims to present a summary of recent
research developments in stock price prediction. This
research meticulously examines the effectiveness and
limitations of both traditional statistical approaches
and contemporary methods from machine learning,
deep learning, and reinforcement learning, evaluating
and comparing each technique in practical
applications. Furthermore, the paper will analyse the
prevailing challenges and potential future directions
in this rapidly evolving field. Through a critical
660
Rong, Q.
From Traditional to Intelligent: The Theoretical Foundations, Method Comparisons, and Challenges of Stock Price Prediction Models.
DOI: 10.5220/0013703700004670
Paper published under CC license (CC BY-NC-ND 4.0)
In Proceedings of the 2nd International Conference on Data Science and Engineering (ICDSE 2025), pages 660-666
ISBN: 978-989-758-765-8
Proceedings Copyright © 2025 by SCITEPRESS – Science and Technology Publications, Lda.

comparative discussion of these diverse approaches,
the goal is to offer the academic community and
industry practitioners a comprehensive and profound
perspective, thereby fostering further innovation and
application in the realm of stock price forecasting.
2 STOCK PREDICTION BASED
ON MACHINE LEARNING
MODELS
2.1 Stock prediction based on Machine
Learning Models
2.1.1 SVM Model
SVM endeavor to find an optimal hyperplane in the
feature space that maximizes the margin between
itself and the nearest data points (the support vectors).
For linearly separable cases, a straightforward linear
boundary suffices; however, when dealing with
nonlinearly separable data, kernel functions (such as
the Radial Basis Function or polynomial kernels) are
employed to map the data into a higher-dimensional
space where a linear separation is achievable.
In many stock prediction studies, researchers treat
future price movements as a classification problem—
dividing outcomes into “upward” or “downward
” trends—by leveraging features such as technical
indicators, trading volume, and fundamental data.
This method is prized for its relative simplicity,
interpretability, and its capacity to capture nonlinear
signals. Alternatively, Support Vector Regression
(SVR) is used to directly forecast stock returns or
prices by minimizing prediction errors within a
predefined tolerance, while the kernel trick allows it
to effectively model nonlinear relationships.
Compared to traditional linear regression, SVR
generally exhibits enhanced robustness in noisy
environments and complex data structures, yielding
superior predictive performance.
SVM is further acclaimed for its strong
generalization ability, primarily due to its strategy of
maximizing the classification margin. This approach
minimizes training errors while bolstering
performance on unseen data by reducing sensitivity to
noise, thereby mitigating overfitting — an essential
attribute given the inherent uncertainty in financial
markets. The versatility of kernel methods makes
SVM particularly apt for financial applications, as
they enable the implicit mapping of data into higher-
dimensional spaces where nonlinear patterns become
linearly separable. In addition, the SVM model was
suggested to perform better than the Linear
Regression model by a review study (Kontopoulou et
al., 2023).
On the downside, the effectiveness of SVM is
highly contingent on the appropriate choice of kernel
function and the fine-tuning of hyperparameters.
Inadequate parameterization can severely impair
model performance, and the tuning process can be
both time-consuming and computationally intensive.
The running efficiency is estimated to be affected by
the training period and process of large amounts of
data (Kontopoulou et al., 2023). Moreover, solving
the quadratic programming problem intrinsic to SVM,
especially with nonlinear kernels, escalates
computational demands as data volumes increase,
potentially necessitating distributed computing or
approximation methods for efficiency. This
computational overhead can present a bottleneck in
real-time trading applications. Finally, despite partial
interpretability through support vectors, the overall
decision-making process in high-dimensional spaces
often remains opaque, a “black-box” characteristic
that is problematic in financial contexts where clear
rationale is crucial for risk management and
regulatory oversight.
2.1.2 Random Forest Model
RF employs a bootstrap sampling strategy, whereby
multiple sub-samples are drawn with replacements
from the original dataset. Each sub-sample is then
used to train an individual decision tree. This
approach ensures that each tree is trained on a slightly
different subset of the data, which, when aggregated,
reduces the overall model variance and mitigates the
risk of overfitting. In the domain of stock price
forecasting, Random Forest can be utilized to frame
the prediction problem as a classification task – for
instance, predicting whether a stock’s price will rise
or fall. The RF classifier leverages a
multidimensional feature set (including historical
prices, trading volumes, technical indicators, and
fundamental metrics) to discern the directional
movement of stocks, thereby generating actionable
buy and sell signals. Simultaneously, Random Forest
is also applicable in a regression context, where it
models historical data to produce continuous
forecasts of future stock prices or returns, serving as
quantitative inputs for investment decision-making.
RF model offers an alternative approach by
adeptly handling nonlinear relationships — a critical
advantage given the multifactorial nature of stock
prices. By constructing an ensemble of decision trees,
each derived from a randomly selected subset of
From Traditional to Intelligent: The Theoretical Foundations, Method Comparisons, and Challenges of Stock Price Prediction Models
661

features, RF can effectively capture diverse nonlinear
patterns. This ensemble method not only enhances
long-term predictive accuracy by identifying hidden
patterns but also inherently performs feature selection
through metrics (Majumder & Hossain, 2019). Such
mechanisms diminish the impact of noisy or
redundant variables and facilitate the extraction of the
most predictive features, thereby streamlining the
model. Additionally, the aggregation of predictions
across multiple trees confers robustness, mitigating
the influence of outliers and ensuring stability in
volatile market conditions.
Conversely, the computational complexity and
resource demands of RF can hinder system
responsiveness and deployment efficiency. Although
parallel processing can alleviate some of these
concerns, constructing, selecting features for, and
aggregating predictions from numerous trees
becomes computationally onerous with high-
dimensional and large-scale data. This challenge is
particularly acute in real-time forecasting scenarios,
where frequent model updates are required.
Furthermore, while RF can output feature importance
rankings, the composite nature of its decision-making
process renders it less interpretable, thereby
complicating risk assessment and undermining
stakeholder confidence. In high-dimensional
contexts, the presence of substantial noise or
redundant features may further impair RF
performance, despite its built-in random feature
selection.
2.2 Stock prediction based on Deep
Learning Models
2.2.1 LSTM Model
LSTM networks capitalize on gated mechanisms —
specifically the input, forget, and output gates — to
control information flow within each cell. This design
allows LSTM to effectively propagate gradients
across long sequences, thereby capturing long-term
dependencies essential for forecasting in financial
markets, where historical price trends, trading
volumes, and volatility may have prolonged effects
on future movements.
LSTM ’ s capacity for automatic feature
extraction obviates the need for elaborate manual
engineering, enabling it to discern critical patterns
from raw time series data, and a study proposed that
the prediction error can be reduced by incorporating
feature-attention mechanisms (Xavier, 2019).
Through successive layers of nonlinear
transformation, LSTM can convert raw inputs into
deep, predictive representations that underpin
subsequent forecasting or decision-making tasks.
Moreover, its ability to dynamically adjust hidden
states in response to evolving market conditions
enhances its robustness during periods of heightened
volatility.
Nonetheless, research has demonstrated that
relying solely on historical closing prices as a singular
feature is insufficient for forecasting stock trends,
causing LSTM networks typically require a large
volume of data to effectively extract relevant
features, and insufficient or noisy datasets may hinder
their ability to capture complex temporal dynamics
(Yan & Yang, 2021). Rigorous data preprocessing
including normalization, denoising, and stabilization
is often necessary to optimize performance, thereby
imposing higher demands on data quality and
processing. Furthermore, the computational and
training costs associated with deep LSTM
architectures are significant, often necessitating
Graphics Processing Unit (GPU)acceleration and
distributed computing — especially when high-
frequency data are involved. Extended training cycles
can thus become a bottleneck for real-time
applications. Hyperparameter tuning in LSTM
networks is equally challenging, as performance is
highly sensitive to factors such as network depth,
hidden unit count, learning rate, batch size, and
regularization; suboptimal configurations can lead to
overfitting and compromised generalization. Lastly,
despite its strengths, the internal decision processes of
LSTM remain relatively opaque compared to
classical statistical models, which can be a critical
drawback in financial settings where interpretability
is paramount.
2.2.2 CNN Model
Convolutional Neural Networks (CNN) have also
been applied to stock prediction by exploiting their
ability to automatically extract local features via
convolutional and pooling operations. In this context,
CNNs can capture short-term volatility patterns from
time series data. An innovative approach involves
transforming time series data into visual formats —
such as candlestick charts or heat maps—and applying
CNN-based image analysis to detect latent patterns
that inform stock price forecasts. This methodology
leverages CNNs’ well-established prowess in image
processing to achieve effective predictive
performance. Additionally, CNNs have been utilized
in intelligent stock selection strategies, where
multifactor features are extracted to classify or score
ICDSE 2025 - The International Conference on Data Science and Engineering
662

stocks, thereby aiding in the identification of
promising investment opportunities.
From an advantages perspective, CNNs benefit
from parameter sharing and sparse connectivity
(Zheng et al., 2024), which dramatically reduce the
number of parameters, enhance training efficiency,
and lower the risk of overfitting—especially in high-
dimensional settings. Their aptitude for discerning
local patterns and short-term fluctuations is
particularly valuable for capturing transient price
trends relevant to short-term trading. CNN can be
employed to predict stock prices by analyzing images
that represent stock price trends (Zheng et al., 2024).
However, CNNs are inherently limited in their
ability to model long-term dependencies, as they are
primarily designed for spatial rather than temporal
data. Consequently, relying solely on CNNs may be
insufficient for capturing the extended temporal
dependencies characteristic of stock price
movements. Moreover, deep CNN architectures
demand extensive training data and substantial
computational resources, and their “ black-box ”
nature further complicates interpretability, potentially
leading to challenges in aligning model outputs with
sound investment decisions.
2.3 Reinforcement Learning Model
RL is a paradigm that learns optimal decision-making
policies through continuous interaction with a
dynamic environment. Its fundamental principle is to
enable an agent to perform actions within an
environment, receive corresponding rewards, and
iteratively refine its strategy to maximize cumulative
returns. In stock trading scenarios, the environment is
typically constructed from historical prices, trading
volumes, and technical indicators; actions may
include buying, selling, or holding a stock; and the
reward function is often defined in terms of realized
profits (or losses). State space design involves
assembling a state vector from historical stock data
and relevant indicators, while the action space is
frequently discretized (e.g., 0 for hold, 1 for buy, 2 for
sell). Moreover, the reward function can be defined
either in terms of single-trade profits or cumulative
returns—often adjusted for risk using measures such as
the Sharpe ratio.
On the positive side, RL emphasizes the
autonomous extraction of effective trading strategies
from raw data, reducing the need for extensive
manual intervention. Once trained, an RL model can
rapidly adapt to real-time market conditions by
evaluating the current state and executing appropriate
buy or sell decisions, thus enhancing both the
timeliness and efficiency of trade execution (Dang,
2020). Furthermore, RL models have the capacity to
dynamically update their strategies to accommodate
evolving market volatility. By integrating risk control
metrics (such as maximum drawdown or the Sharpe
ratio) into the reward function, the agent is
encouraged not only to maximize returns but also to
maintain a prudent risk profile. In contrast to
supervised learning approaches, RL does not require
vast quantities of pre-labeled data and profitable
trading strategies can be developed even with only a
few hundred samples, which is an advantage when
labeled data is scarce or costly to obtain (Dang, 2020).
However, several challenges and limitations
temper the application of RL in stock price prediction.
Firstly, RL methods typically exhibit low sample
efficiency, requiring a substantial number of
interactions to converge on an optimal policy — a
significant drawback in financial markets where
effective samples may be limited. Training instability
and the risk of overfitting further complicate the use
of RL, as market noise, non-stationary data, and
poorly designed reward functions can lead the model
to overfit historical patterns, thereby undermining its
performance in live trading (Sahu et al., 2023).
Moreover, deep reinforcement learning models are
computationally intensive, with large numbers of
parameters and lengthy training periods that demand
significant computational resources (e.g., GPUs),
potentially impeding real-time application.
Additionally, the design of a robust and balanced
reward function — which accurately reflects real
trading profits while incorporating risk management—
is inherently complex. An ill-conceived reward
function may steer the agent away from desirable
trading behavior (Sahu et al., 2023). Finally, the “
black-box” nature of RL models often results in
limited interpretability, which can reduce investor
confidence and complicate regulatory oversight.
3 COMPARISON AND
EVALUATION
Model evaluation is a critical component in stock
price forecasting. Diverse evaluation criteria allow
for a multidimensional assessment of a model’s
performance, thereby guiding model fine-tuning and
strategy enhancement.
From Traditional to Intelligent: The Theoretical Foundations, Method Comparisons, and Challenges of Stock Price Prediction Models
663
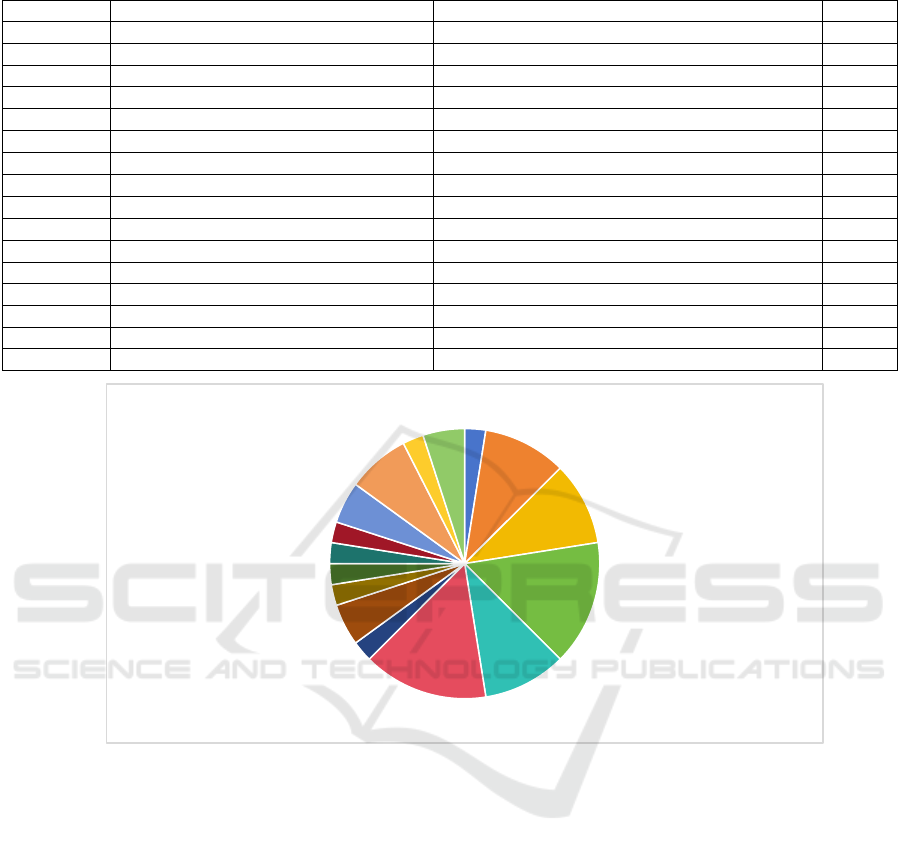
Table 1: Evaluation method of selected studies.
Model Citation Evaluation Metho
d
Yea
r
ARIMA
(
Altan & Karasu, 2019
)
MPE, MAPE 2020
ARIMA
(
Budiharto, 2021
)
MSE, MAE, RMSE,MAPE 2021
ARIMA (Carapuço et al., 2018) Accurac
y
2020
SVM (Chen & Huang, 2021) MSE, RMSE, MAE 2019
SVM (Dhyani et al., 2020) MSE, MAE, AUC, Accuracy, Recall 2020
SVM (Ganesan & Kannan, 2021)
MSE, RMSE, MAE,
R
2019
RF
(
Ghosh et al., 2019
)
RMSE, MAPE, MBE 2020
LSTM (Gururaj et al., 2019)
RMSE, MAE,
R
2020
LSTM
(
Khan & Al
g
hulaiakh, 2020
)
Error Values 2019
LSTM
(
Nti et al., 2020
)
Accurac
y
, RMSE, 2021
CNN (Oncharoen & Vateekul, 2018) Accuracy, Precision, Recall, F1 Score 2021
CNN (Patil et al., 2020) RMSE, MAE, MAPE 2020
CNN (Qiu et al., 2020) F-measure, Return Rate, Sharpe Ratio 2018
RL
(
Shin et al., 2019
)
Return Rate 2018
RL
(
Tsantekidis et al., 2020
)
Shar
p
e Ratio 2019
RL
(
Vi
j
h et al., 2020
)
Shar
p
e Ratio 2020
Figure 1: Occupation for each evaluation method of selected studies. (Picture credit: Original).
Table 1 and Figure 1 indicate that the vast
majority of stock price forecasting models can be
evaluated using conventional statistical metrics. In
contrast, RL models are predominantly assessed by
risk-adjusted performance indicators such as the
Sharpe Ratio and Return Rate. The fundamental
distinction lies in the training process: RL models
iteratively refine their decision-making strategies
through trial-and-error interactions with the
environment rather than merely minimizing
prediction error. Consequently, one may
preliminarily infer that RL possesses certain
advantages over other models.
4 CONCLUSIONS
Initially, this paper provides a systematic review of
the theoretical underpinnings and practical
applications of various forecasting models,
elucidating their respective strengths and limitations.
Subsequently, it consolidates several evaluation
methodologies employed in prior studies, which
tentatively demonstrate the superiority of RL-based
approaches. Given the inherent complexity and
nonlinearity of financial markets, as well as the
specific constraints associated with individual
models, this review advocates for future research to
adopt hybrid and ensemble techniques — such as
ARIMA-LSTM models—that can effectively capture
MPE
MAPE
MSE
RMSE
Accuracy
MAE
AUC
Recall
MBE
Error Values
Precision
F1 Score
Return Rate
Sharpe Ratio
F-measure
R^2
ICDSE 2025 - The International Conference on Data Science and Engineering
664

both linear trends and nonlinear dynamics. Moreover,
future investigations should leverage big data and
multimodal information to explore more adaptive
dynamic strategies and efficient training methods,
ultimately furnishing robust theoretical and empirical
support for investment decision-making and risk
management.
By integrating these advancements, researchers
and practitioners can develop more resilient and
interpretable forecasting frameworks, enhancing
predictive accuracy and robustness in real-world
financial applications. As financial markets continue
to evolve, a multidisciplinary approach that
synergizes machine learning, econometrics, and
domain-specific expertise will be crucial in shaping
the next generation of intelligent financial forecasting
systems.
REFERENCES
Altan, A., & Karasu, S. 2019. The effect of kernel values in
support vector machine to forecasting performance of
financial time series. The Journal of Cognitive Systems,
4(1), 17-21.
Budiharto, W. 2021. Data science approach to stock prices
forecasting in Indonesia during Covid-19 using Long
Short-Term Memory (LSTM). Journal of Big Data,
8(1).
Carapuço, J., Neves, R., & Horta, N. 2018. Reinforcement
learning applied to Forex trading. Applied Soft
Computing, 73, 783–794.
https://doi.org/10.1016/j.asoc.2018.09.017
Chen, Y.-C., & Huang, W.-C. 2021. Constructing a stock-
price forecast CNN model with gold and crude oil
indicators. Applied Soft Computing, 112(107760),
107760.
Dang, Q. V. 2020. Reinforcement learning in stock trading.
In H. Le Thi, H. Le, T. Pham Dinh, & N. Nguyen (Eds.),
Advanced computational methods for knowledge
engineering (Vol. 1121, pp. 311–322). Springer, Cham.
Dhyani, B., Kumar, M., Verma, P., & Jain, A. 2020. Stock
Market Forecasting Technique using Arima Model.
International Journal of Recent Technology and
Engineering, 8(6), 2694–2697.
Ganesan, A., & Kannan, A. 2021. Stock Price Prediction
using ARIMA Model. International Research Journal of
Engineering and Technology.
Ghosh, A., Bose, S., Maji, G., Debnath, N., & Sen, S. 2019,
September 26. Stock Price Prediction Using LSTM on
Indian Share Market. Easychair.org; EasyChair.
Gururaj, V., V R, S., & Ashwini K, D. 2019. Stock Market
Prediction using Linear Regression and Support Vector
Machines. International Journal of Applied
Engineering Research, 14(8), 1931–1934.
Khan, S., & Alghulaiakh, H. 2020. ARIMA Model for
Accurate Time Series Stocks Forecasting. International
Journal of Advanced Computer Science and
Applications, 11(7).
Kontopoulou, V. I., Panagopoulos, A. D., Kakkos, I., &
Matsopoulos, G. K. 2023. A Review of ARIMA vs.
Machine Learning Approaches for Time Series
Forecasting in Data Driven Networks. Future Internet,
15(8), 255. https://doi.org/10.3390/fi15080255
Majumder, Md. M. R., & Hossain, Md. I. 2019, February 1.
Limitation of ARIMA in extremely collapsed market:
A proposed method. IEEE Xplore.
Nti, I. K., Adekoya, A. F., & Weyori, B. A. 2020. Efficient
Stock-Market Prediction Using Ensemble Support
Vector Machine. Open Computer Science, 10(1), 153–
163.
Oncharoen, P., & Vateekul, P. 2018. Deep Learning Using
Risk-Reward Function for Stock Market Prediction.
Proceedings of the 2018 2nd International Conference
on Computer Science and Artificial Intelligence - CSAI
’18.
Patil, P., Wu, C.-S. M., Potika, K., & Orang, M. 2020. Stock
Market Prediction Using Ensemble of Graph Theory,
Machine Learning and Deep Learning Models.
Proceedings of the 3rd International Conference on
Software Engineering and Information Management.
Qiu, J., Wang, B., & Zhou, C. 2020. Forecasting stock
prices with long-short term memory neural network
based on attention mechanism. PLOS ONE, 15(1),
e0227222.
Raza, S. A., Jawaid, S. T., & Hussain, A. 2014. Risk and
investment decisions in stock markets: evidence from
four Asian countries. International Journal of
Managerial and Financial Accounting, 6(3), 227-250.
Sahu, S. K., Mokhade, A., & Bokde, N. D. 2023. An
Overview of Machine Learning, Deep Learning, and
Reinforcement Learning-Based Techniques in
Quantitative Finance: Recent Progress and Challenges.
Applied Sciences, 13(3), 1956.
Shin, H.-G., Ra, I., & Choi, Y.-H. 2019. A Deep
Multimodal Reinforcement Learning System
Combined with CNN and LSTM for Stock Trading.
2019 International Conference on Information and
Communication Technology Convergence (ICTC).
Sun, Y., Jin, Q., Cheng, Q., & Guo, K. 2019. New tool for
stock investment risk management: Trend forecasting
based. Industrial Management & Data Systems.
Sun, Y., Jin, Q., Cheng, Q., & Guo, K. 2020. New tool for
stock investment risk management: Trend forecasting
based on individual investor behavior. Industrial
Management & Data Systems, 120(2), 388-405.
Tsantekidis, A., Passalis, N., Toufa, A.-S., Saitas-Zarkias,
K., Chairistanidis, S., & Tefas, A. 2020. Price Trailing
for Financial Trading Using Deep Reinforcement
Learning. IEEE Transactions on Neural Networks and
Learning Systems, 32, 1–10.
Vijh, M., Chandola, D., Tikkiwal, V. A., & Kumar, A.
2020. Stock Closing Price Prediction using Machine
Learning Techniques. Procedia Computer Science,
167(167), 599–606.
Xavier, A. 2019, January 22. Predicting stock prices with
LSTM - Neuronio - Medium. Medium; Neuronio.
From Traditional to Intelligent: The Theoretical Foundations, Method Comparisons, and Challenges of Stock Price Prediction Models
665

https://medium.com/neuronio/predicting-stock-prices-
with-lstm-349f5a0974d4
Yan, Y., & Yang, D. 2021. A Stock Trend Forecast
Algorithm Based on Deep Neural Networks. Scientific
Programming, 2021(7510641), 1–7.
Zheng, J., Xin, D., Cheng, Q., Tian, M., & Yang, L. 2024.
The Random Forest Model for Analyzing and
Forecasting the US Stock Market in the Context of
Smart Finance.
ICDSE 2025 - The International Conference on Data Science and Engineering
666
