
A Study on the Impact of Decision Tree and Multiple Regression on
Study Time Optimization and Performance
Tianyu Fu
a
School of Computing, Clemson University, 821 McMillan Rd, Clemson, U.S.A.
Keywords: Study Time Allocation, Academic Performance Predication, Multiple Linear Regression, Decision Tree
Algorithm, Machine Learning in Education.
Abstract: Student achievement is affected by a variety of factors, such as study time, prior grades, extracurricular
activities, hours of sleep, and a number of practice problems. In this paper, multiple linear regression model
and decision tree models are used for modeling and analysis. The results of multiple linear regression showed
that prior grades, study time, and the number of practice problems were significant factors affecting students'
performance, with students' study time having a highly significant positive effect on students' academic
performance. In addition, the decision tree model further indicates the different trends of students'
performance under changes in study time for different prior achievement intervals, which provides data
support for the development of personalized learning strategies. Based on the findings, this paper provides
recommendations for optimizing students' time management, enhancing after-school exercise practice, and
developing individualized learning plans for students at different achievement levels. Future research could
introduce additional variables, such as mental health and family support, to improve the predictive power of
the model and inform education policy optimization.
1 INTRODUCTION
In the modern education system, unequal distribution
of educational resources and difficulties in the time
management of students have become important
factors affecting academic performance. With the
networking of educational resources and the
popularization of advanced data analysis methods,
rational planning, and optimization of students' study
time to bridge the resource gap and enhance learning
efficiency have become a core topic of educational
research. The need to optimize study time is further
highlighted by the fact that, against the backdrop of
increasing global competition, students are faced with
a significant increase in the pressure to advance to the
next level of education, a heavy load of coursework
and varying degrees of independent learning ability.
The study of how to improve students' performance
index through scientific learning strategies not only
contributes to students' academic success but also
provides a practical basis for the development of
educational policies and the improvement of teaching
methods. This study focuses on the effects of study
a
https://orcid.org/ 0009-0004-6173-1111
time and practice problems on students' academic
performance under different academic foundation
conditions, and explores how machine learning-based
models can provide suggestions for optimizing study
strategies for students with different academic
foundations. By analyzing data on how study time is
allocated, the number and type of practice problems,
and students' learning outcomes in different academic
contexts, this study aims to reveal the relationship
between these factors and provide data to support the
development of individualized learning programs.
In recent years, researchers have utilized
algorithms that commonly use machine learning to
predict student academic performance and explore
the factors that influence it. For example, Verma’s
team made use of different machine learning
algorithms to predict student academic performance
based on real-world data, which includes academic
history and student habits. Their research was
indicating the potential of educational data mining in
helping students optimize their study patterns (Verma
et al. 2022). Similar to Verma, Rajendran’s team also
used multiple techniues,including multinomial
624
Fu, T.
A Study on the Impact of Decision Tree and Multiple Regression on Study Time Optimization and Performance.
DOI: 10.5220/0013703000004670
Paper published under CC license (CC BY-NC-ND 4.0)
In Proceedings of the 2nd International Conference on Data Science and Engineering (ICDSE 2025), pages 624-631
ISBN: 978-989-758-765-8
Proceedings Copyright © 2025 by SCITEPRESS – Science and Technology Publications, Lda.

logistic regression, artificial neural networks, random
forests, gradient boosting, and methods to predict
GPA based on socio-demographic, school-related
factors, and individual student variables (Rajendran
et al., 2022) . The study showed that students' healthy
lifestyle is positively related with academic
performance, while poor lifestyle such as chronic
negative emotions and stress negatively affects
academic performance, with no significant effect of
gender factor. Other research group also applied
machine learning algorithms to predict undergraduate
students' final exam grades based on their midterm
scores. Their prediction model achieved an accuracy
of 70–75% and the potential of educational data
mining for early identification of poor academic
performance students were highlighted (Yağcı,
2022). In addition, Martey investigated the
relationship between study time and performance
using an optimized Support Vector Regression (SVR)
model combined with Recursive Feature Elimination
(RFE) and found that SVR performs best with an
accuracy of R² value of 0.97, which is higher than
methods such as Decision Tree and Random Forest
(Martey et al., 2024). The impact of students' mental
health on academic performance is of equal concern.
Elshewey research group investigated the
relationship between levels of depression, attention
deficit hyperactivity disorder (ADHD ), and course
grades (Elshewey et al., 2024). Specifically, they used
a random forest algorithm for the data analysis, and
the results revealed that student psychological status,
hours of sleep, and social relationships have a
significant impact on academic success. They
suggested that psychological support should be
provided for students. Additionlly, Support Vector
Machine was also implemented to the predicting
students academic performance. Recent research has
demonstrated that student academic performance
was effectively predicted by the Time Management
Skills data from the Time Structure Questionnaire
(TSQ), which achived 80% accuracy by using a
Linear Support Vector Machine model (Khoudier et
al., 2023). Similarly, Other Researchers also explored
the Time Management Skills data from the Time
Structure Questionnaire (TSQ) to predict student
academic performance. They used Linear Support
Vector Machine which finally achieved 80%
accuracy in academic performance prediction and
84% in English performance(Rimadana et al. 2019).
Other Reseacher did similarwork by implementing
Extreme Gradient Boosting (XGBoost) that can
predict student academic performance with 97.12%
accuracy. The final output was highlighting the
impact from social and demographic on student
successs (Ojajuni et al. 2021). To improve
predicational model’s stabilities, lots of resrach team
made use of different methods. Some researchers
introduced a graph-based ensemble machine learning
approach that integrated supervised method with
unsupervised methods to improve model’s stability
and accuracy in student performance prediction, and
eventually outperformed traditional models by up to
14.8% (Wang et al. 2021). Lastly, researcher also
used the output of machine learning model to guide
them construct customized education. Researchers
conducted a comprehensive review of personalized
learning in smart and customized education, which
emphasized role of personalized learning by
integrating large-scale education with individualized
learning.(Wu et al. 2022).
The goal of this study was to explore the impact
of study time on student performance and to suggest
personalized learning strategies based on data
analysis.
This paper is structured as follows: the second
section describes the research methodology,
including data collection, variable selection, and
model construction; The third section presents the
results of the study and analyzes the trends in the
performance of students in different achievement
zones under changes in study time; Part IV discusses
the findings of the study and makes recommendations
for dynamically adapting instructional strategies;
Finally, Part V summarizes the contributions of this
study and future research directions.
2 DATA AND METHODS
2.1 Data Sources
2.1.1 Data Source
The data was obtained from the website Kaggle. The
file contains several variables related to student
performance with specific characteristics as shown in
Table 1.
Table 1 Data variables in Multiple Linear Regression
Model
Parameters Meanings
Hours Studied Total number of hours per
week that students spend
stud
y
in
g
Previous Scores Student's test scores at the
p
revious level
Extracurricular
Activities
Whether the student
p
articipates in
A Study on the Impact of Decision Tree and Multiple Regression on Study Time Optimization and Performance
625

extracurricular activities
(
Yes/No
)
Sleep Hours Average number of hours
of sleep per day for
students
Sample Question Papers
Practiced
Number of practice
problems completed by
students
Performance Index Target variable, a
measure of overall
student performance
2.1.2 Data Characteristics
The data has continuous variables Hours Studied,
Previous Scores, Sleep Hours, Performance Index,
and subtyped variables Extracurricular Activities also
suitable for studying the combined effect of different
variables on student performance.
2.1.3 Reasons for Choice
The dataset covers multiple aspects of key factors that
influence student performance and can be used to
analyze the influences on academic performance as
well as predict student achievement.
2.2 Methodologies
2.2.1 Linear Regression Model
Multiple linear regression is a machine learning and
statistical method that measures the effects of
multiple variables on a target variable and the
interactions between multiple variables
simultaneously. In this study, variables including
Hours Studied, Previous Scores, Extracurricular
Activities, Sleep Hours, and Sample Question Papers
Practiced were used as independent variables, and the
Performance Index was used as the target variable.
Practiced) were used as independent variables, and
the Performance Index was used as the target
variable.
In addition to multiple regression modeling,
decision tree modeling is an important statistical tool
for studying student performance. Decision trees can
categorize students' performance in different tiers,
revealing the pattern of influence of the different
variables above on students' performance in a non-
linear manner. In this study, a decision tree model was
constructed using Hours Studied and Previous Scores
as input variables and Performance Index as the target
variable. Building a decision tree model centers on
determining the rules for dividing the data and
identifying the key factors that best differentiate
student performance. The decision tree can
automatically select the most influential variables in
the modeling process and construct a tree structure so
that different combinations of variable characteristics
correspond to different results on student
performance.
2.2.2 Model Concepts
Multiple regression models were applied to analyze
the combined effects of multiple independent
variables (e.g., hours of study, prior grades,
extracurricular activities, hours of sleep, and a
number of practice problems) on the Performance
Index (PI) of student achievement. The error term (ϵ)
in the model represents other factors that cannot be
explained by these variables.
Decision tree modeling was applied to analyze the
path of influence of two independent variables such
as length of study, and prior grades) on the different
tiers of the division and of the Performance Index (PI)
of student achievement. The tree structure
characterizes the model, which recursively divides
the training dataset and generates decision rules based
on the range of values of different variables to predict
the values of the student performance index. The
value of each leaf node represents the value of the
predicted target variable (Performance Index), while
each split node shows the variable that has the
greatest impact on that split point and its threshold.
2.2.3 Model Benefits
Multiple regression models have a strong analytical
ability to consider the effects of multiple factors on
student performance simultaneously and reveal the
interactions between variables. By calculating the
regression coefficients (β), the model can
quantitatively assess the extent to which each variable
contributes to student performance, enabling the
researcher to specify which factors have the greatest
impact on student academic performance. In addition,
the multiple regression model has a strong predictive
ability, which can predict the future performance of
students based on existing data and provide a
scientific basis for the development of personalized
learning plans. Due to the high flexibility of the
model, the researcher can adjust the variables
according to the demand or introduce new
characteristic variables (e.g., socio-economic
background) to further optimize the analytical effect
of the model, thus improving the accuracy and
applicability of the prediction.
The decision tree model is more interpretable and
can be visualized by dividing the rules to show how
the two variables, length of study and prior grades,
ICDSE 2025 - The International Conference on Data Science and Engineering
626

have an impact on the student's performance index.
Compared to multiple linear regression, decision tree
models can present different groups and conditions
affecting student performance through different
levels of splitting, which can provide more
personalized guidance for student learning.
2.2.4 Best Subset Selection for Multiple
Linear Regression (MLR)
The subsets of all variables were combined using the
Treg subsets function to find the combination of
variables with the highest adjusted R² to ensure model
simplicity and explanatory power. A subset of all
variables was combined using the regsubsets function
to find the combination of variables with the highest
adjusted R², ensuring model simplicity and
explanatory power. Regarding the use of the
variables, Hours. Studied was not forced to be
included in the model, but it may be very important
for the prediction of the effect and is therefore marked
as “ ”. The previous score (Previous.Scores) was
likewise not forced into the model, but was selected
in most of the models, suggesting that it had less of
an effect on the target variable, and was therefore also
labeled as “ ”. Extracurricular Activities were not
forced into the model and were only selected in some
of the models, implying that their relationship with
the target variable may not be significant.
Sleep.Hours was likewise not forced into the model
and was not selected in most models, indicating that
it had less of an effect on the target variable, hence
the absence of the flag. Finally, the number of
practice sample papers
(Sample.Question.Papers.Practiced) was not forced
into the model, but it may be very important for the
prediction effect and is therefore marked as “ ”.
By exhaustive algorithm to taste the different
number of combinations of parameters, the final five-
parameter model has the highest goodness-of-fit
effect (R² = 0.9887523) therefore the five-parameter
model works best.
2.2.5 Comparison of Multiple Linear
Regression Models and Analysis of
Variance (ANOVA)
When making model selection, in addition to
focusing on the overall model's goodness of fit (e.g.,
R² or adjusted R²), it is necessary to further assess the
contribution of each variable to the explanatory
power of the model. By introducing or removing
specific variables, quantitative assessment using
model comparison and analysis of variance
(ANOVA) can test whether they significantly affect
the explanatory power of the target variable
(Performance. Index).
In this analysis, the significance of the
enhancement of the explanatory power of the model
with the introduction of Extracurricular. Activities
and Sleep. Hours were tested. Specifically, the need
to retain all variables was assessed by constructing
two models: a full model with all variables included
(Full Model) and a simplified model with both
variables removed (Reduced Model) as well as
through F-tests on both the full and simplified models
to ensure statistical significance of the models.
H0: The introduced variable has no significant
effect
H1: The introduced variable has a significant
effect
The ANOVA test showed that the inclusion of
Extracurricular. Activities and sleep. Hours
significantly increased the model's ability to explain
the target variable (Performance. Index) (F=898.28,
p<0.001). Therefore, the original hypothesis H0 is
rejected and Extracurricular. Activities and Sleep.
Hours are considered as significant variables. The
original hypothesis H0 is rejected.
2.2.6 Decision Tree Model Training
Firstly, to divide the dataset, the (train_test_split)
method was used. The original dataset is divided into
a training set and a test set, and the trainer randomly
selects 70% of the original data (test_size=0.7). The
test set randomly selects 30% of the original data
(test_size=0.3), and the random seed is set to 42
(random_state=42) to ensure the reproducibility of
the results.
Secondly, to select characteristics and target
variables, the feature variables, features, as 'Hours
Studied' and 'Previous Scores', representing the total
study duration and previous academic performance,
were defined respectively. The target variable, target,
corresponds to the student’s Performance Index.
Extract the relevant columns, X_train and y_train,
from the training set and assign them to X and y,
respectively, for model training.
Lastly, to train the Decision Tree Model, the
model is trained using Decision Tree Regressor. To
mitigate overfitting, the maximum tree depth is
constrained to 3 max_depth=3, ensuring controlled
model complexity. Additionally, to enhance the
model’s stability and reproducibility, the random seed
is set to 42 (random_state=42).
A Study on the Impact of Decision Tree and Multiple Regression on Study Time Optimization and Performance
627
3 ANALYSES OF RESULTS
3.1 Multiple linear regression model results
Table 2
R
esults of Multiple Linear Regression Analysis
Variable Estimate Std. Error t-value Pr(>|t|)
Interprect
-34.075588 0.127143
-268.01 <2e-16
Hours
Studied
2.852982
0.007873
362.35 <2e-16
Previous
Scores
1.018434
0.001175
866.45 <2e-16
Extracurric
ular
Activities
0.612898
0.040781
15.03
<2e-16
Sleep
Hours
0.480560
0.12022
39.97
<2e-16
Sample
Question
Papers
Practiced
0.193802
0.007110
27.26
<2e-16
The significance of the multiple linear regression
model body is high as the model has an F-value of
1.757e+05 and the corresponding p-value is also less
than 2.2e-16 (Table 2). The R² value of 0.9888 as well
as the value of the adjusted R
2
is slightly 0.9887,
which proves that the model can account for most of
the variance in the target variable as well as maintains
a high level of robustness and validity when dealing
with complex data.
3.2 Residual analysis of multiple linear
regression models
The standardized residual distribution indicates that
the model meets the linear regression assumptions
and the residuals are uniformly distributed without
significant bias.
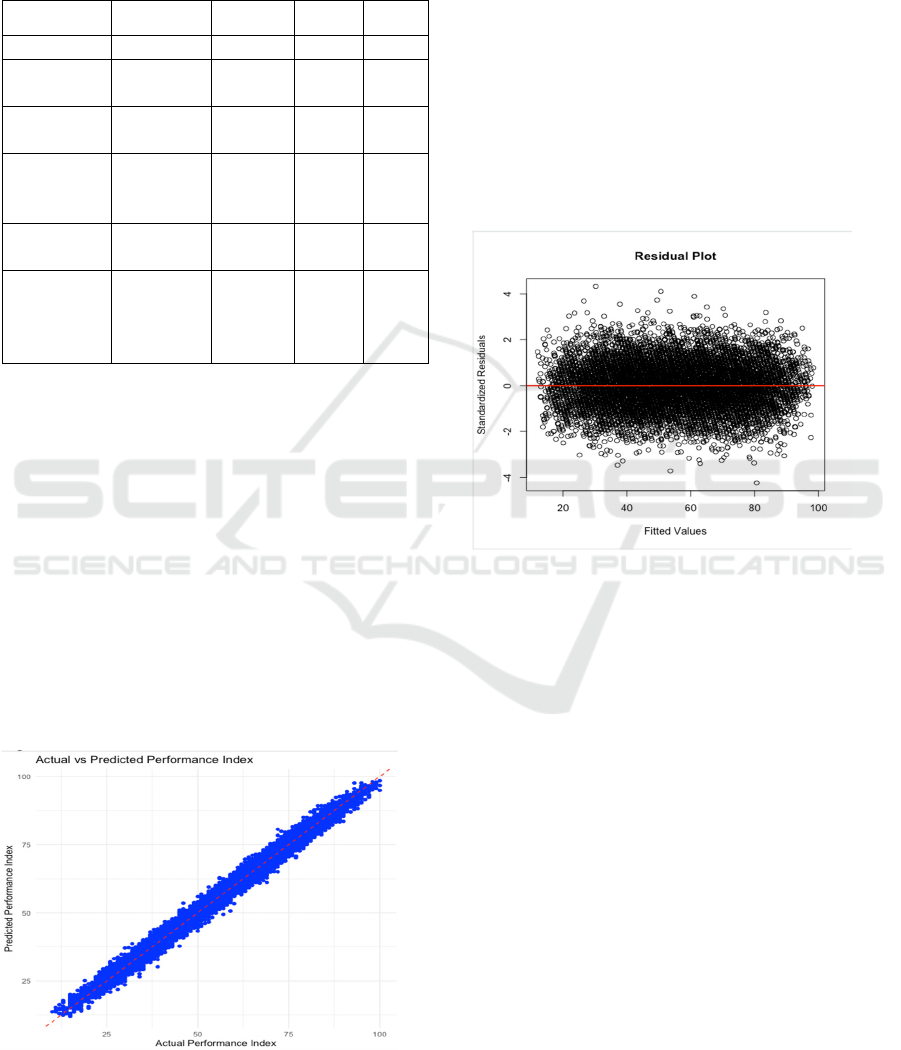
Figure 1: Comparison of actual and predicted values
(Picture credit : Original)
Figure 1 illustrates the relationship between the
actual values of the Student Performance Index and
the predicted values of the multiple linear regression
model. As can be seen in Figure 1, the data points are
tightly and linearly distributed around the diagonal
line (red dashed line). The red dashed line represents
the ideal prediction line, and the dense distribution of
data points on both sides of this line indicates a small
deviation between the predicted and actual values.
The accuracy of the model's predictions of the
Student Performance Index was high. Figure 1
visually illustrates the high accuracy and strong
explanatory power of the model in predicting student
performance indices, supporting the previous
conclusions about the significance of the model.
Figure 2: Residual Plot(Picture credit : Original)
Figure 2 illustrates the distribution between the
normalized residuals and the predicted values. As
seen in Figure 2, most of the residuals are distributed
above and below 0 and are scattered randomly with
no clear pattern or trend. The residuals are
predominantly distributed between [-4, 4], which
indicates a moderate error margin. The model's
residual distribution satisfies the basic assumptions of
linear regression, and the model's predictive and
explanatory power is high and relatively robust.
3.3 Analysis of Decision Tree Model Results
3.3.1 Program Code
Use decision_tree.predict(X_test) to predict the test
set X_test and get the predicted value y_pred.
ICDSE 2025 - The International Conference on Data Science and Engineering
628
3.3.2 Decision Tree Decision Rules
Based on the partitioning logic of the decision tree
model, the specific rules by which a student's
Previous Scores and Hours Studied contribute to the
prediction of the Performance Index are as follows:
Rule 1: When Previous Scores are less than or
equal to 69.50 and less than or equal to 55.50, the
predicted Performance Index is 25.84 if Hours
Studied is less than or equal to 4.50; if Hours Studied
is greater than 4.50, the predicted Performance Index
is 38.79.
For the mutual benefit and protection of Authors
and Publishers, it is necessary that Authors provide
formal written Consent to Publish and Transfer of
Copyright before publication of the Book. The signed
Consent ensures that the publisher has the Author’s
authorization to publish the Contribution.
Rule 2: If a student's Prior Scores are less than or
equal to 69.50 and greater than 55.50, the Predicted
Performance Index will vary depending on the Hours
Studied. Specifically, when hours studied are less
than or equal to 4.50 hours, the predicted
Performance Index is 41.11; when hours studied are
greater than 4.50 hours, the predicted Performance
Index increases to 53.42.
Rule 3: If a student's Previous Scores are greater
than 69.50 and also less than or equal to 84.50, the
predicted Performance Index will vary depending on
the Hours Studied. Specifically, when the learning
time is less than or equal to 4.50 hours, the predicted
Performance Index is 55.81, while when the learning
time is greater than 4.50 hours, the predicted
Performance Index increases to 68.43.
Rule 4: If a student's Previous Scores are greater
than 69.50 and also greater than 84.50, the predicted
Performance Index will vary depending on the Hours
Studied. Specifically, when the learning time is less
than or equal to 4.50 hours, the predicted
Performance Index is 70.87, while when the learning
time is greater than 4.50 hours, the predicted
Performance Index increases to 83.76.
3.3.3 Decision Tree Modelling Performance
Using the mean_squared_error function, calculate the
Mean Squared Error (MSE) between the actual value
y_test and the predicted value y_pred. The result of
the calculation is 38.808, which indicates that the
mean squared error between the predicted and actual
values is low.
Using the r2_score function, the coefficient of
determination (R² Score) for the model was
calculated. An R² value of 0.895 indicates that the
model explains approximately 89.5% of the variance
of the target variable, Performance Index.
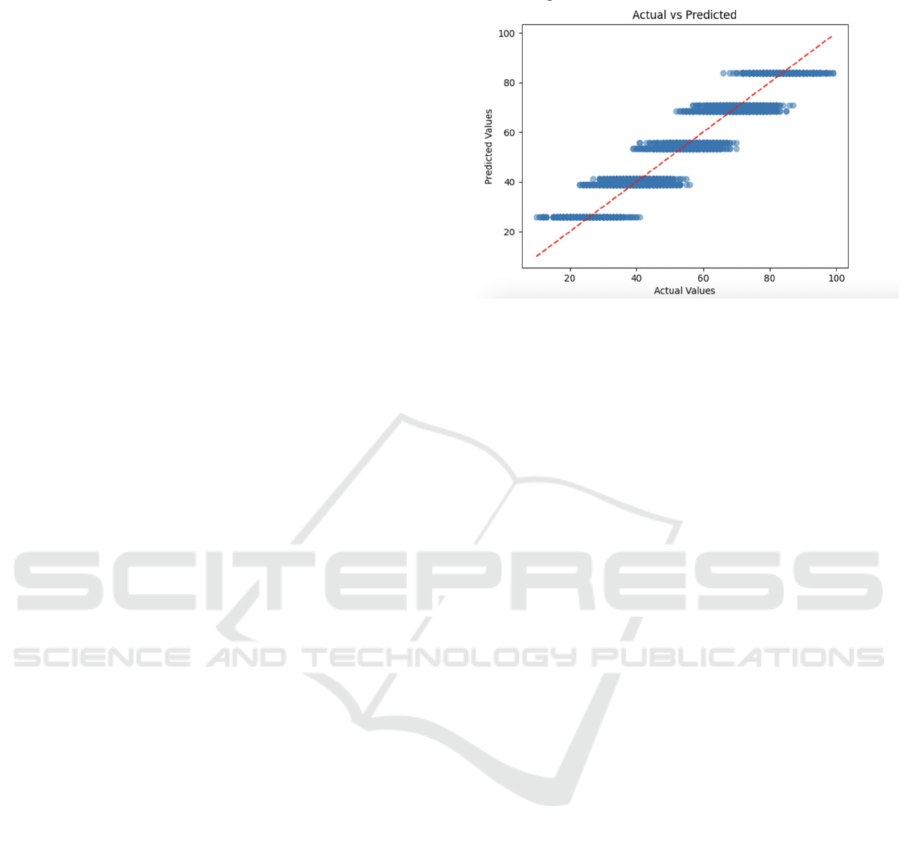
Figure 3. Decision Tree Predicted vs. Actual (Actual vs
Predicted)(Picture credit : Original)
Figure 3 illustrates the predicted versus actual
values of the model's student performance index
(Performance Index). The blue scatter represents the
predicted value and the red dotted line represents the
actual value, the overlapping part means that the
predicted value is exactly equal to the actual value.
As can be observed from Figure 3, most of the scatter
distributions are close to the red dashed line,
indicating that even though some of the scatters are
skewed, especially in the lower and higher intervals,
the model predicts a high degree of fit between the
student performance index (Performance Index) and
the actual values.
4 DISCUSSION AND
RECOMMENDATIONS
4.1 Discussion
This study shows that the effect of the amount of time
spent studying on students' performance indices is
significant and that students devoting more time to
studying is usually associated with higher academic
achievement. We hope you find the information in
this template useful in the preparation of your
submission. This emphasizes the critical role that the
investment of study time plays in academic success.
The classification results of the decision tree model
showed that students with less study time had lower
performance indices, indicating that time 3
management has a significant impact on academic
performance. In addition, research has shown that
students' prior achievement is a significant predictor
of future academic performance. Therefore,
providing students with the necessary and adequate
learning support at the beginning of their academic
A Study on the Impact of Decision Tree and Multiple Regression on Study Time Optimization and Performance
629

careers is necessary and important to promote long-
term academic success. In addition, the study
revealed that the number of practice problems of the
students was positively correlated with the
performance index, suggesting that the students'
after-school practice activities play an important role
in knowledge consolidation and academic
competence enhancement. However, although
multiple linear regression and decision tree models
demonstrated better predictive power in this study,
their explanatory power is still limited by the
completeness of the data. This study did not consider
incorporating variables into the model such as
physical health factors, psychological factors, and
family environment that may affect academic
performance, which may have reduced the
generalizability of the findings.
4.2 Recommendation
Based on these findings, this study makes the
following recommendations. First, students can plan
their study time wisely through time management
tools or course guidance. Schools and educational
institutions should also provide training for students
to enhance their time management skills and learning
effectiveness. Second, for students with poor prior
performance, schools should provide personalized
tutoring, allocating different study time to different
students based on their prior performance, and
progressively helping them build a solid academic
foundation at an early stage. For example, among
students with prior scores in the 69.5 - 84.5 range,
studying for more than four hours significantly
increased the performance index. Based on this,
educational institutions can implement precise
intervention strategies for this specific group. For
example, students in this zone are encouraged to add
an additional 1-2 hours of study time per day. At the
same time, schools can utilize the data monitoring
system to track changes in students' learning time and
dynamically adjust the content and difficulty of
teaching to ensure that students' learning efficiency
will not be reduced while their learning time is
increased.
In addition, schools should enrich students' after-
school practices by providing a variety of high-
quality practice questions or mock exams to help
students strengthen their knowledge acquisition and
enhance their academic performance. Meanwhile,
future research should explore more factors that
influence academic performance, such as mental
health, family support, and social activities, in order
to fully analyze the impact of these variables on
student learning outcomes. Finally, to further
improve the predictive accuracy and applicability of
the model, subsequent studies could collect a larger
and more diverse range of student data and attempt to
use more sophisticated machine learning models,
such as random forest or deep learning, to improve
the explanatory power and generalization of the
model. These improvements not only optimize the
learning strategies of individual students, but also
provide a scientific basis for educational policy-
making and contribute to the overall improvement of
academic outcomes.
5 CONCLUSIONS
This study analyzed the effects of several factors on
students' academic performance by modeling with
decision trees and multiple linear regression and
found that study time, previous grades, and the
number of practice problems were the most important
influences. Student performance can be effectively
enhanced by optimizing study plans, focusing on
practice and maintaining good habits. Although the
model showed good predictive performance, there are
still limitations in this study, such as the modeling of
the model did not consider factors such as mental
health and family environment. Future studies should
incorporate more variables and combine more
sophisticated machine learning models (e.g., vector
machines and random forests) to enhance the
predictive power. In addition, validation under
different countries' education systems contributes to
the generalizability of the study. The findings of this
study not only help students to develop efficient study
plans, but also provide empirical support for the
optimization of educational policies and teaching
methods.
REFERENCES
Elshewey, A. M., Ibrahim, A., Abdelhamid, A. A., Eid, M.
M., Singla, M. K., and Farhan, A. K., 2024.
Understanding the impact of mental health on academic
performance in students using random forest and
stochastic fractal search with guided whale
optimization algorithm. Journal of Artificial
Intelligence in Engineering Practice, 1(1):66–82.
Khoudier, M. M. E., Abdelnaby, R. H. M., Eldamnhoury,
Z. M., Abouzeid, S. R. A., El-Monayer, G. K., Enan, N.
M., El-Ghamry, A., Fouad, K., and Moawad, I., 2023.
Prediction of student performance using machine
learning techniques. In NILES 2023, 5th Novel
ICDSE 2025 - The International Conference on Data Science and Engineering
630

Intelligent and Leading Emerging Sciences Conference,
pages 333–338. IEEE.
Martey, E. M., Abdullah, A., and Appiah, O., 2024.
Predicting student academic performance using an
optimised regression machine learning model. In
ICAST 2024, IEEE 9th International Conference on
Adaptive Science and Technology, volume 9, pages 1–
7. IEEE.
Ojajuni, O., Ayeni, F., Akodu, O., Ekanoye, F., Adewole,
S., Ayo, T., Misra, S., and Mbarika, V., 2021.
Predicting student academic performance using
machine learning. In ICCSA 2021, 21st International
Conference on Computational Science and Its
Applications, pages 481–491. Springer.
Rajendran, S., Chamundeswari, S., and Sinha, A. A., 2022.
Predicting the academic performance of middle- and
high-school students using machine learning algorithms.
Social Sciences Humanities Open, 6(1):100357.
Rimadana, M. R., Kusumawardani, S. S., Santosa, P. I., and
Erwianda, M. S. F., 2019. Predicting student academic
performance using machine learning and time
management skill data. In ISRITI 2019, International
Seminar on Research of Information Technology and
Intelligent Systems, pages 511–515.
Verma, U., Garg, C., Bhushan, M., Samant, P., Kumar, A.,
and Negi, A., 2022. Prediction of students’ academic
performance using machine learning techniques. In
MECON 2022, International Mobile and Embedded
Technology Conference, pages 151–156. IEEE.
Wang, Y., Ding, A., Guan, K., Wu, S., and Du, Y., 2021.
Graph-based ensemble machine learning for student
performance prediction. arXiv preprint
arXiv:2112.07893.
Wu, S., Cao, Y., Cui, J., Li, R., Qian, H., Jiang, B., and
Zhang, W., 2024. A comprehensive exploration of
personalized learning in smart education: From student
modeling to personalized recommendations. arXiv
preprint arXiv:2402.01666.
Yağcı, M., 2022. Educational data mining: Prediction of
students’ academic performance using machine
learning algorithms. Smart Learning Environments,
9(1):11.
A Study on the Impact of Decision Tree and Multiple Regression on Study Time Optimization and Performance
631
