
Predicting Stock Closing Prices: A Random Forest Model Using
Fundamental, Technical, Risk, and Macroeconomic Indicators
Jiafan Liu
a
School of Finance, Guangdong University of Finance & Economics, Guangzhou, Guangdong, China
Keywords: Random Forest, Stock Price Prediction, Multi-Factor, Quantitative Trading.
Abstract: Accurate stock price prediction is crucial for investors and the economy, yet it remains challenging due to
market volatility and the limitations of traditional quantitative trading strategies, which struggle to capture
nonlinear relationships. This study employs a Random Forest (RF) model to enhance stock closing price
prediction ability by integrating fundamental, technical, risk, and macroeconomic indicators. Using stock data
from the Chinese A-share market's CSI300 and CSI1000 indices spanning January 2015 to December 2023,
the model was trained after preprocessing for missing values and standardization. The evaluation utilized
Root Mean Square Error (RMSE), R², and K-Fold Cross-Validation to ensure accuracy and reliability. The
model achieved high prediction accuracy, with an RMSE of 8.09 and R² of 0.9927 for BYD Co., Ltd. closing
price prediction, and similarly strong performance across 663 other stocks. These findings highlight the
effectiveness of combining macro and risk indicators within an RF framework, offering invaluable insights
for developing robust quantitative trading strategies that leverage machine learning to address complex market
dynamics.
1 INTRODUCTION
The stock market is a vital cog of the economic
machine. For the overall economy of a country, it
reflects, to a significant extent, the supply and
demand of market capital and the economic
trajectory; thus, it is often called the "barometer of the
economy". Nevertheless, since the market’s
pronounced volatility, the intricacies of the
investment decision-making process, and the
interference of myriad external factors, securing
investments that yield excessive returns remains a
profoundly challenging endeavor.
Traditional quantitative trading strategies employ
mathematical models and statistical analyses to
automatically discern investment opportunities,
effectively mitigating emotional biases in decision-
making, achieving excess returns, and reducing
investment risks (Sun, Wang, & An, 2023). However,
the preponderance of quantitative trading strategies
relies on conventional factor models, typically
utilizing fixed-weight factors such as fundamental
and technical indicators for stock selection. Notable
examples include the widely recognized Three-factor
a
https://orcid.org/0009-0001-6706-2703
Model and the Capital Asset Pricing Model (Sharpe,
1964; Fama & French, 1993). These quantitative
trading strategies, due to their reliance on fixed rules
and models, exhibit certain limitations, such as their
inability to effectively capture nonlinear relationships
between factors or to constantly adapt in real time to
trading environments characterized by heightened
complexity and uncertainty (Deng et al., 2016).
In the age of computer science and big data,
researchers have explored the application of machine
learning methodologies to stock trading (Rundo et al.,
2019; Bhandari, 2022; Zheng et al., 2020). Among
these, random forest (RF), a form of ensemble
learning, has garnered favor in stock price prediction
and quantitative trading due to its capacity to handle
vast datasets, capture nonlinear relationships,
facilitate feature selection, and mitigate overfitting
(Biau & Scornet, 2016). By integrating diverse
features, RF offers a multifaceted predictive
framework, yielding relatively accurate and stable
forecasting outcomes.
Scholars have conducted comparative analyses of
RF and Long Short-Term Memory (LSTM) models in
the context of stock price prediction and quantitative
612
Liu, J.
Predicting Stock Closing Prices: A Random Forest Model Using Fundamental, Technical, Risk, and Macroeconomic Indicators.
DOI: 10.5220/0013702800004670
Paper published under CC license (CC BY-NC-ND 4.0)
In Proceedings of the 2nd International Conference on Data Science and Engineering (ICDSE 2025), pages 612-618
ISBN: 978-989-758-765-8
Proceedings Copyright © 2025 by SCITEPRESS – Science and Technology Publications, Lda.

trading. Utilizing data from the S&P 500 index, these
studies revealed that, in the absence of pronounced
white noise, the RF model exhibits a smaller bias in
forecasting stock prices compared to LSTM. This
also demonstrates a superior capacity to accurately fit
price variations and respond more swiftly to price
fluctuations (Wu, 2024). In terms of quantitative
investment, Ma et al. integrated machine learning
models with traditional portfolio optimization
techniques, proposing a stock selection methodology
based on RF and support vector regression (SVR)
(Ma, Han, & Wang, 2021). This approach was
benchmarked against deep learning models, such as
LSTM networks and convolutional neural networks
(CNNs). Their experimental findings indicate that
machine learning models outperform conventional
time-series models in the stock pre-selection process.
Notably, when applied to Mean-Variance (MV) and
Omega portfolio optimization frameworks, the RF
model demonstrated superior predictive efficacy.
This study underscores that RF, as a robust regression
and classification tool, can effectively furnish reliable
predictive information for quantitative strategies,
particularly during the stock pre-selection phase.
Furthermore, Rasekhschaffe & Jones explored the
application of machine learning techniques in stock
selection, highlighting the RF's advantages in
managing multiple complex factors and nonlinear
relationships (Rasekhschaffe & Jones, 2019).
Although there has been some research on the
application of RF in stock prediction and quantitative
investment, how to integrate factors from different
sectors to effectively and accurately predict stock
prices is still a challenging topic. Compared to the
conventional application of machine learning in stock
price prediction, this study innovatively employs a
number of factors, including fundamental, technical,
risk, and macroeconomic indicators, to develop a
sophisticated RF model that can maximize the
utilization of information from bond market and
macroeconomy, aiming to capture as much valuable
market context as possible to yield a precise price
prediction.
The subsequent sections of this paper are
structured as follows. Section 2 will show the source
of the data and the descriptive statistics of the data,
followed by a brief introduction to how data
preprocessing was conducted in this study. Then, the
author will explain the basic principles of the random
forest model and how it was applied in this study. In
Section 3, the author will present the results of this
paper and conduct cross-validation. The last section
summarizes the whole paper.
2 DATA AND METHOD
2.1 Data Collection and Description
The data in this study are obtained from the CCER
and RESSET databases, covering samples from
January 1, 2015, to December 31, 2023. The sample
includes the constituent stocks of the CSI300 and
CSI1000 indices, which respectively represent the
companies with large and small market value in the
Chinese A-share market. The constituent stocks of
these indices are selected to analyze the predicted
performance of the RF algorithm with different
market capitalizations and liquidity under multi-
dimensional factors. The collected data include the
closing price of each stock every Friday and the data
corresponding to each factor. The factors used in this
study are divided into four types: fundamental
factors, technical factors, macroeconomic factors and
risk factors. The specific abbreviations and notations
are shown in Table 1.
Table 1: Abbreviations and notations.
Classification Abbreviation Notation
Fundamental
indicators
PE_Ratio Price-to-Earnings Ratio
PB_Ratio Price-to-Book Ratio
BM_Ratio Book-to-Market Ratio
Current_Ratio Measuring a company's short-term debt repayment ability
Quick_Ratio
Measuring a company's ability to pay its short-term liabilities without
rel
y
in
g
on inventor
y
.
Cash_Ratio The coverage of the company's cash holdings to short-term liabilities
Predicting Stock Closing Prices: A Random Forest Model Using Fundamental, Technical, Risk, and Macroeconomic Indicators
613

ROE Return on Equity, measuring profitability of a company's shareholders
Technical indicators
Momentum_4w Momentum factor, calculating the historical return over the past 4 weeks
Volatility_4w
Volatility factor, calculating the stock price volatility over the past 4
weeks
Volume_Change
Volume variation factor, calculating the difference from the previous
tradin
g
da
y
's volume
RSI Relative Strength Index
Macroeconomic
indicators
CPI_Growth Consumer Price Index (Month-on-month growth rate)
GDP_Growth Gross Domestic Product (Month-on-month growth rate)
Exchange_Rate
(USD)
RMB exchange rate (Based on USD)
Interest_Rate Benchmark Interest Rate
Risk indicators
Beta Measuring the correlation of individual stocks with the market as a whole
Default_Count Number of debt defaults
RMER Relative market excess return
Stock price Closing_price Closing price every Friday
2.2 Data Pre-processing
Data preprocessing is a key step to ensure that the RF
model can be effectively trained and predicted. The
data preprocessing in this study mainly includes
missing value processing and standardization
processing. Due to the complexity of financial market
data, missing values are common in a dataset.
Missing values of macro indicators are filled by the
time series interpolation method. For example, for the
monthly CPI sample, this study uses interpolation to
fill it into weekly data; for the quarterly GDP sample,
it fills it into weekly data. Missing values of
fundamental factors, technical factors, and risk
factors are handled by the linear filling method to
avoid the impact of days gap between two trading
days. After filling in all missing values, several
statistical characteristics of sample data are presented
through tables and graphs. Table 2 is the descriptive
statistics of all variables.
Table 2: Descriptive statistics of the dataset.
count mean std
Closing_price 363973 24.4785 57.9591
PE_Ratio 363973 67.6010 844.7043
PB_Ratio 363973 4.4241 32.4917
BM_Ratio 363973 1.4291 15.4509
Current_Ratio 363973 2.2972 2.4149
Quick_Ratio 363973 1.8550 2.2438
Cash_Ratio 363973 0.8232 1.3121
ROE 363973 0.0554 0.3888
Momentum_4w 363973 0.0028 0.1389
Volatility_4w 363973 1.2798 3.4418
Volume_Change 363973 96337 109895380
RSI 363973 47.9334 11.6070
CPI 363973 1.0013 0.0041
GDP_Growth 363973 1.0132 0.0219
Interest_Rate 363973 0.0245 0.0055
Beta 363973 1.1373 0.3595
Default_Count 363973 0.0176 0.3313
RMER 363973 -0.0007 0.0590
Exchange_Rate
(
USD
)
363973 6.7385 0.2678
For the relevant data of macro indicators, Figure
1 shows the data of the two indicators CPI_Growth
and GDP_Growth. The left y axis represents the CPI
growth rate, the right y axis represents the GDP
growth rate, and the x axis represents time. The CPI
ICDSE 2025 - The International Conference on Data Science and Engineering
614
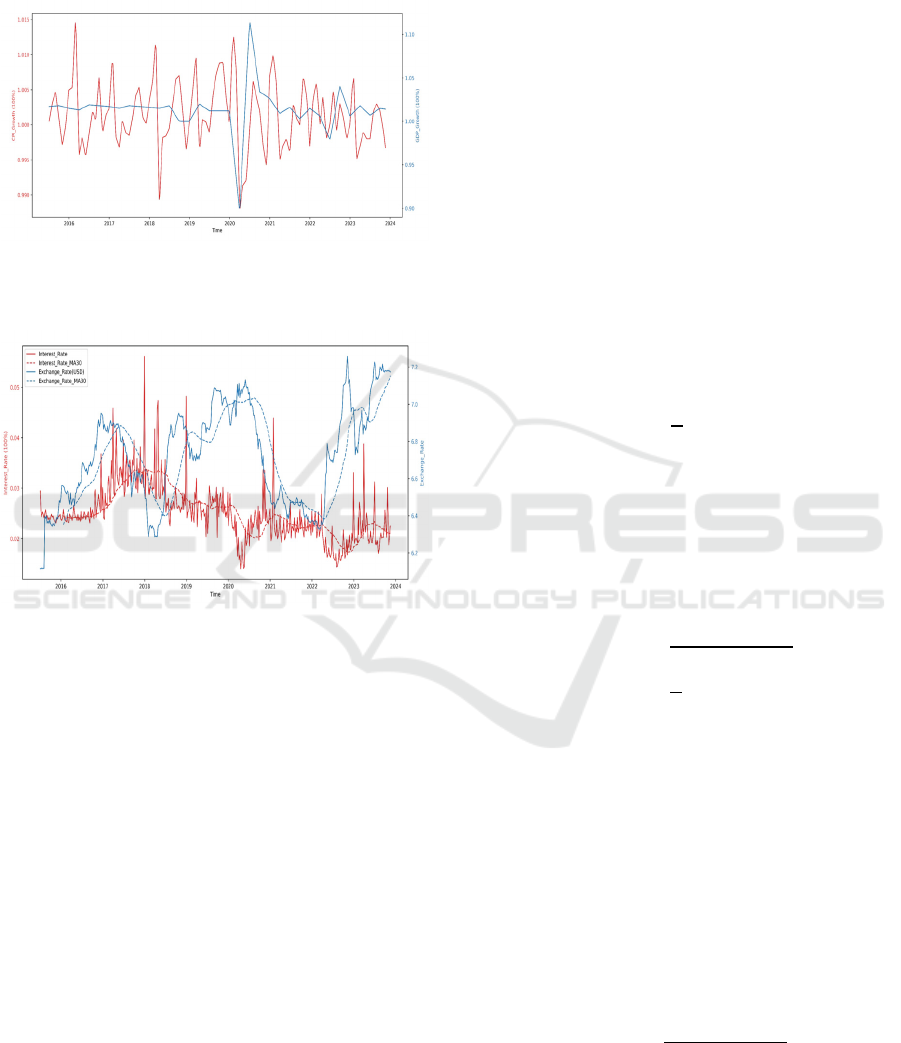
growth rate fluctuates prominently, especially around
2016, 2018 and 2020, while the GDP growth rate is
generally stable, but there are also obvious
fluctuations in 2020.
Figure 1: Line chart of CPI_Growth & GDP_Growth.
(Picture credit: Original)
Figure 2: Line chart of Interest_Rate & Exchange_Rate.
(Picture credit: Original)
Figure 2 shows the time series changes of the
benchmark interest rate and exchange rate x (1 USD
-- x RMB). Two y axes are used in the figure,
representing the different dimensions of the two
indicators. The red solid line represents the
fluctuation of the interest rate, and the blue solid line
represents the change of the exchange rate. Both are
equipped with a 30-day moving average (dashed line)
to show a smooth trend. As can be seen from Figure
2, the interest rate fluctuates greatly, while the
exchange rate fluctuates relatively stable. Therefore,
the author believes that interest rates and exchange
rates, as important macroeconomic factors in
quantitative trading, will play a crucial role in stock
price prediction.
In financial data, the differences in the dimension
of various factors may lead to deviations when
training machine learning models. Therefore, after
filling in all missing values, the author standardized
all data (except weekly closing prices) to ensure that
data of different dimensions can be used in the same
model.
3 MODEL
This study uses RF regression to forecast the closing
price of stocks. Subsequently, the author will
introduce the basic principles of the RF model, as
well as the model training and testing process of this
study. RF regression is an ensemble learning method
that improves the accuracy and stability of the model
by building multiple decision trees and combining
their prediction results. Each decision tree is trained
on a random (using the boosted sampling method)
sample in the original dataset and split into branches
using randomly selected features. The prediction
result of RF regression is the average of the prediction
results of all decision trees. Its calculation principle is
represented by formula (1),
y
1
T
y
1
Where 𝑇 is the number of decision trees and 𝑦
is
the prediction of the 𝑡-th decision tree.
Indicators such as Root Mean Square Error
(RMSE) and R² measure whether the prediction
results of RF regression are accurate. The formula (2)
is the equation for calculating RMSE,
𝑅𝑀𝑆𝐸
1
𝑛
𝑦
𝑦
2
where 𝑦
is the true value of the 𝑖-th data point; 𝑦
is the predicted value; 𝑛 is the number of data points.
The prediction error of the model is positively
correlated with the RMSE value. This indicator is
generally used in conjunction with the coefficient 𝑅
,
which is a statistic indicator that measures the
correlation between the true values and the
predictions, namely, the proportion of the variability
explained by the model to the total variability. The
formula (3) is the equation of calculating 𝑅
.
𝑅
1
∑
𝑦
𝑦𝑖
∑
𝑦
𝑦
3
Predicting Stock Closing Prices: A Random Forest Model Using Fundamental, Technical, Risk, and Macroeconomic Indicators
615
Its value ranges from 0 to 1. An accurate model
needs to have a high fit and a low prediction error,
that is, a high 𝑅
and a low RMSE.
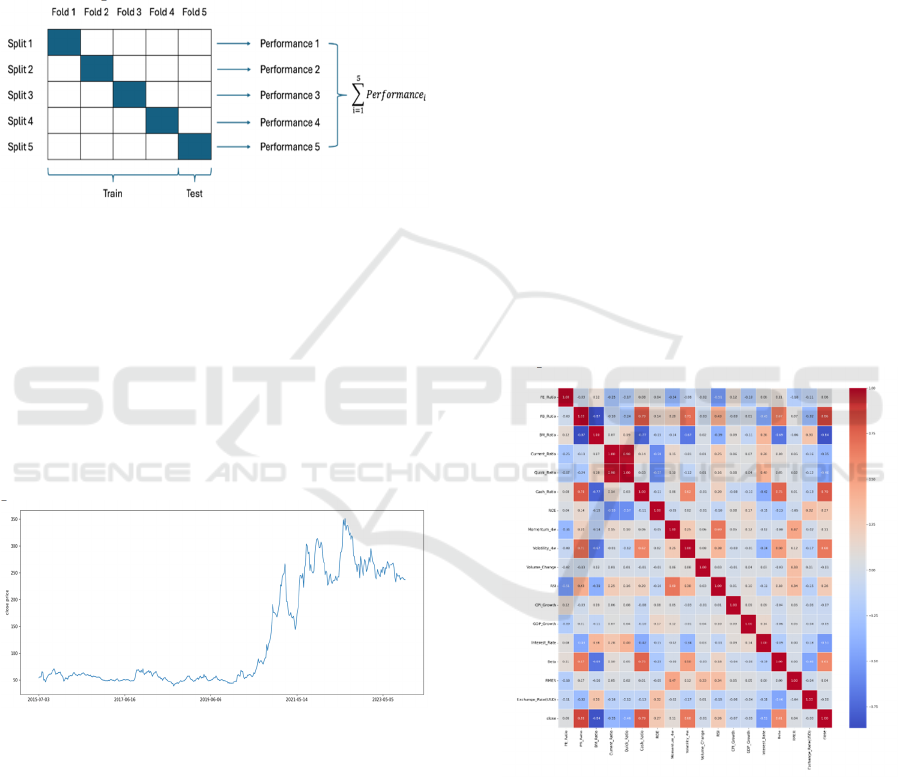
Finally, the author employed the K-Fold Cross-
Validation to test the stability and reliability of the
model by training and testing the model multiple
times, to avoid the situation where the model
performs well on the training set but performs poorly
in actual applications (also called overfitting). Figure
3 shows the process when 𝐾5.
Figure 3: K-Fold Cross-Validation. (Picture credit:
Original)
4 RESULTS AND DISCUSSION
This study first selects BYD Co., Ltd. (002594.SZ)
stock in the stock pool as representative, trains and
evaluates the RF model to verify the effectiveness of
the RF regression framework in stock prediction.
Figure 4 shows the tendency of this stock's Closing-
price.
Figure 4: BYD stock's closing price. (Picture credit:
Original)
The price of the stock rose significantly around
2020, and the volatility increased. The author
performs Z-score standardization on the relevant data
of the stock and randomly divides it into training sets
and test sets at a ratio of 4:1.
After data preprocessing, this paper conducted a
correlation analysis on the data, and the results are
shown in Figure 5. The PB_Ratio has the most
significant correlation with the closing price, with a
correlation coefficient of 0.858. A high price-to-book
ratio usually reflects the market's recognition of the
company's asset value, which aligns with normal
rules; The BM_Ratio and the closing price show a
strong negative correlation because when the book
value is high relative to the market value, the
corresponding stock price is relatively low; the
company's abundant cash may enhance market
confidence and drive up stock prices, so the
correlation coefficient between Cash_Ratio and the
closing price is 0.792. Other variables with high
correlation with closing prices include Interest_Rate
and Beta. Regarding the collinearity problem between
variables, the correlation coefficient between
PB_Ratio and BM_Ratio is -0.867, which is strongly
collinear (inverse relationship), and it is necessary to
avoid including them in the model at the same time;
while the correlation coefficient between the
Current_Ratio and Quick_Ratio is 0.978 (highly
redundant), so just keep one of them. Other variables
(such as PE_Ratio and Volume_Change) have a weak
correlation with the closing price, which means that
they may not have a significant impact on the
predictive ability of the model. However, they can
still provide some contextual information, so it may
be useful to include them as secondary features to
capture potential interactions.
Figure 5: Correlation heat map. (Picture credit: Original)
The RF model is trained after removing variables
that are not suitable for model training. Considering
the size of the dataset, the author uses 100 decision
trees to form an RF regression model. The
comparison between the predicted closing price and
the actual closing price is shown in Figure 6.
ICDSE 2025 - The International Conference on Data Science and Engineering
616
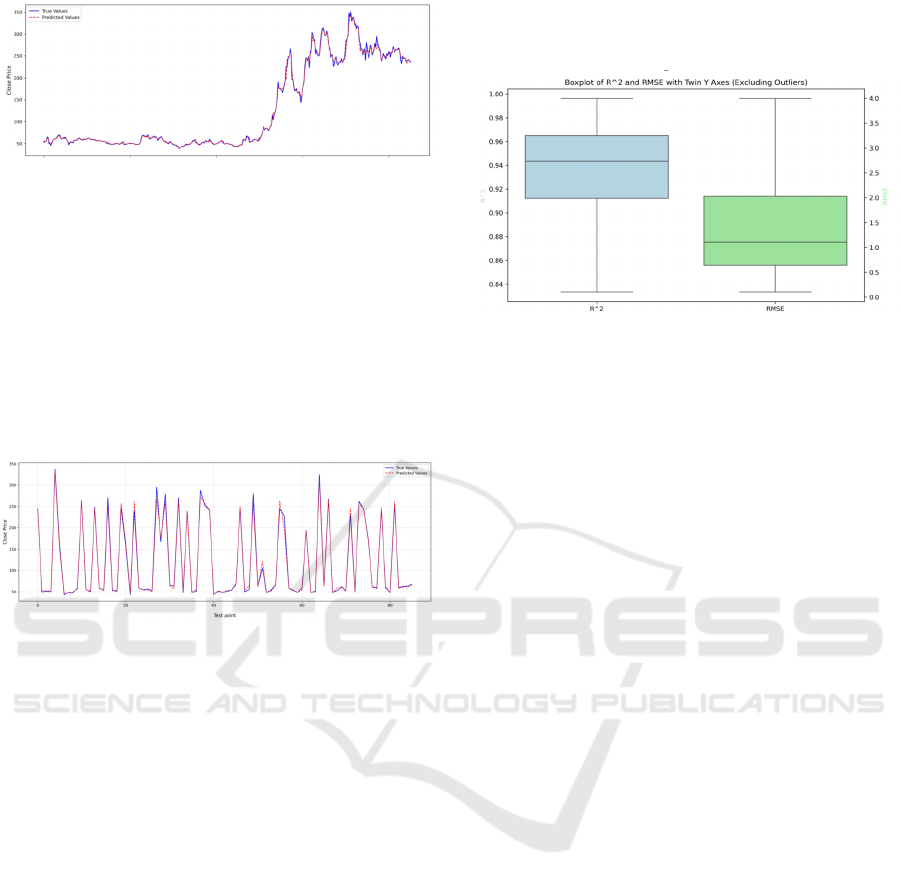
Figure 6: Forecasting performance of RF regression.
(Picture credit: Original)
The test outcomes of the test set are shown in Figure
7. The closing price predicted by the model is
basically close to the actual closing price. The RMSE
Score of the model is 8.09, which is relatively small
compared to the dimension of the closing price,
demonstrating that the prediction error of the model
is small; the 𝑅
of the model is 0.9927, which is close
to 1, presenting that the model has a good fitting
effect.
Figure 7: Forecasting performance of RF regression.
(Picture credit: Original)
To evaluate the generalization ability of the RF
model, the author applies K-Fold Cross-Validation
technique. After calculation, the RMSE of each fold
is: 8.13, 8.31, 7.94, 11.22, 9.62, and the average is
about 9.04. The range of RMSE values shows that the
performance of the model is relatively consistent, but
there are some differences in its predictions in
different data splits. This may be because the stock
has fluctuated greatly after 2020, resulting in different
characteristics of the training and test sets for each
fold. Generally, if the model performs very well on
the training set, but the performance on the cross
validation or test set varies greatly, then there may be
overfitting. However, from the results, the changes in
RMSE are not particularly extreme, so there is no
obvious sign that the model is overfitting on the
training set.
In addition to the experiments on the stock of
BYD Co., Ltd., the author also extends the model to
other constituent stocks in the CSI300 and CSI1000
indices (some stocks have fewer observations; stocks
with less than 300 observations are removed, leaving
663 stocks that meet the requirements), and used the
same training and testing process to predict other
stocks and calculate the RMSE and 𝑅
values for
each stock, shown in Figure 8.
Figure 8: Box plots of RMSE and 𝑅
. (Picture credit:
Original)
In the box plot on the left, the median of 𝑅
is
about 0.942, the first quartile (25%) is about 0.912,
and the third quartile (75%) is about 0.965, indicating
that most of the data are concentrated in this range,
indicating that the goodness of fit of most stocks is
close to a high level. The box plot on the right shows
that the median of RMSE is about 1.111, indicating
that the prediction errors of most stocks are
concentrated at this level. Considering the dimension
of stock closing prices, this value is relatively small,
indicating that the prediction errors of most models
are small. In conclusion, the RF regression model's
performance in other stocks is similar to that of BYD
stock. It can better recognize and utilize both long-
term and short-term trends of stocks, and the model
shows strong generalization ability.
5 CONCLUSIONS
This study investigated the effectiveness of an RF
regression model in predicting stock prices in the
Chinese A-share market, specifically for the
constituent stocks of the CSI300 and CSI1000
indices. The model utilized a range of different and
innovative indicators, including fundamental,
technical, macroeconomic, and risk factors, and was
trained and tested using data from January 2015 to
December 2023. The integration of macroeconomic
and risk factors, alongside traditional indicators,
enhances the model’s capacity to capture complex
market dynamics, as evidenced by correlation
analyses highlighting the influence of variables like
the Price-to-Book Ratio. The main findings showed
that the random forest approach achieved high
prediction accuracy, as evidenced by low RMSE and
Predicting Stock Closing Prices: A Random Forest Model Using Fundamental, Technical, Risk, and Macroeconomic Indicators
617

high R² values. For example, the model performed
with an RMSE of 8.09 and an R² of 0.9927 for BYD
Co., Ltd., with similar success for other stocks in the
sample. K-Fold Cross-Validation further confirmed
the robustness and generalization ability of the model,
showing consistent performance without overfitting.
Future studies could explore the following.
Initially, by analysing the feature importance of each
indicator, dynamically indicators selecting methods
could be used to boost predictive power. Furthermore,
researchers can investigate additional indicators to
make the prediction more accurate and reliable.
Finally, tuning parameters like tree depth or number
of trees may be able to enhance model performance.
REFERENCES
Bhandari, H. N., Rimal, B., Pokhrel, N. R., Rimal, R.,
Dahal, K. R., & Khatri, R. K. 2022. Predicting stock
market index using LSTM. Machine Learning with
Applications, 9, 100320.
Biau, G., & Scornet, E. 2016. A random forest guided tour.
Test, 25, 197-227.
Deng, Yue, Feng Bao, Youyong Kong, Zhiquan Ren, and
Qionghai Dai. 2016. Deep direct reinforcement
learning for financial signal representation and trading.
IEEE Transactions on Neural Networks and Learning
Systems, 28(3), 653–664.
Fama, Eugene F., & Kenneth R. French. 1993. Common
risk factors in the returns on stocks and bonds. Journal
of Financial Economics, 33(1), 3–56.
Ma, Y., Han, R., & Wang, W. 2021. Portfolio optimization
with return prediction using deep learning and machine
learning. Expert Systems with Applications, 165,
113973.
Rasekhschaffe, K. C., & Jones, R. C. 2019. Machine
learning for stock selection. Financial Analysts Journal,
75(3), 70-88.
Rundo, F., Trenta, F., Di Stallo, A. L., & Battiato, S. 2019.
Machine learning for quantitative finance applications:
A survey. Applied Sciences, 9(24), 5574.
Sharpe, William F. 1964. Capital asset prices: A theory of
market equilibrium under conditions of risk. The
Journal of Finance, 19(3), 425–442.
Sun, Shuo, Rundong Wang, & Bo An. 2023. Reinforcement
Learning for Quantitative Trading. ACM Trans. Intell.
Syst. Technol. 14(3), Article 44 (June 2023), 29 pages.
Wu, Haoyuan. 2024. Comparison of Random Forest and
LSTM in Stock Prediction. Advances in Economics,
Management and Political Sciences, 86, 28-34.
10.54254/2754-1169/86/20240936.
Zheng, L., Pan, T., Liu, J., Ming, G., Zhang, M., & Wang,
J. 2020. Quantitative trading system based on machine
learning in Chinese financial market. Journal of
Intelligent & Fuzzy Systems, 38(2), 1423-1433.
ICDSE 2025 - The International Conference on Data Science and Engineering
618
