
Multi-Time Scale Prediction of US Stock Index: A Feature Selection
Based Approach Using LSTM and Random Forest
Xiaomin Xia
a
Department of Electrical and Electronic Engineering, The Hong Kong Polytechnic University, Hong Kong, China
Keywords: LSTM, Random Forest, Feature Selection, Stock Index Prediction.
Abstract: The prediction of stock market indices presents significant challenges owing to their inherent complexity and
nonlinearity. Nevertheless, the swift advancement of artificial intelligence, coupled with its extensive
utilization within the financial sector, equips investors with robust tools for the analysis of market trends. This
research employs the Yahoo Finance API to obtain historical data pertaining to the S&P 500 index. It
subsequently implements data preprocessing techniques, feature selection methodologies, and machine
learning models, specifically Random Forest (RF) and Long Short-Term Memory (LSTM), to forecast trends
over short-term (1-week), mid-term (5-week), and long-term (30-week) horizons. Experimental results
indicate that RF performs better for short-term predictions, while LSTM excels in mid- and long-term
forecasting. The study also compares different methods for handling missing data, this paper uses removing
missing values method in order to simplify the preprocessing workflow. By eliminating irrelevant variables
through feature selection, the prediction accuracy is further improved. This study demonstrates an effective
workflow combining automated feature selection and machine learning algorithms, aiding investors in making
more informed decisions and providing a basis for future research on hybrid models.
1 INTRODUCTION
The inherent complexity and volatility of the stock
market present significant challenges in accurately
predicting market prices. Nevertheless, the rapid
advancements in artificial intelligence (AI) and its
increasing integration within the financial sector have
led investors to increasingly depend on AI-driven
tools for the analysis of market patterns and trends.
By comprehending the fundamental mechanics of the
market and employing automated buy-sell strategies,
investors are better positioned to make informed and
profitable decisions. Numerous researchers and
institutions are now utilizing machine learning
algorithms to process extensive datasets and adapt to
the ever-changing market conditions.
A stock index represents a subset of the stock
market and serves as a measure of its overall
performance. Its value reflects the performance of the
constituent stock within the market and is commonly
used to indicate the shared characteristics of a group
of assembled companies. The trends and trading
strategies for stock index prediction can be indicated
a
https://orcid.org/0009-0009-8308-2091
by technical indicators as characteristics (Hao, 2023).
By incorporating these indicators as new features
applied with a feature selection method, a more
accurate market direction can be predicted. However,
some variables are not associated with the response
and may even cause unnecessary complexity.
Therefore, the application of advanced approaches,
such as feature selection methods is essential to
exclude irrelevant variables (James et al., 2013).
In this study, the Yahoo Finance API was
employed to obtain historical data for the S&P 500
index, identified by its ticker symbol ^GSPC. This
API facilitates the acquisition of public financial
market data through a user-friendly interface. The
finance library's download function was utilized to
automate the data acquisition and processing over a
designated time frame, incorporating features such as
opening price, high price, low price, closing price,
and trading volume. This methodology obviates the
necessity for manual data entry, and the retrieved data
was successfully stored as SP500.csv.
The objective of this paper is to implement a
Feature Selection Method to identify critical figures
604
Xia, X.
Multi-Time Scale Prediction of US Stock Index: A Feature Selection Based Approach Using LSTM and Random Forest.
DOI: 10.5220/0013702700004670
Paper published under CC license (CC BY-NC-ND 4.0)
In Proceedings of the 2nd International Conference on Data Science and Engineering (ICDSE 2025), pages 604-611
ISBN: 978-989-758-765-8
Proceedings Copyright © 2025 by SCITEPRESS – Science and Technology Publications, Lda.

from a set of 35 original technical indicators.
Utilizing the optimal feature set, the Random Forest
(RF) and Long Short-Term Memory (LSTM)
machine learning algorithms were applied to forecast
the average closing values over 1-week, 5-week, and
30-week horizons. A comparative analysis of the
error rates of these two algorithms reveals that RF
demonstrates superior performance in short-term
predictions, whereas LSTM is more adept at
capturing long-term trends.
The primary contributions of this research include
the development of a data preprocessing pipeline, a
comparative analysis of the two algorithms, and the
practical implications of the findings in real-world
scenarios. Initially, daily prices were aggregated into
weekly average prices to mitigate redundancy. Three
methodologies for addressing missing values —
deletion, mean imputation, and median imputation—
were evaluated based on their respective error rates.
Subsequently, normalization was applied to scale the
data into an appropriate range for machine learning
algorithms. The Feature Selection method was
employed to identify key technical indicators, thereby
enhancing predictive performance by excluding
irrelevant variables.
Furthermore, by contrasting the performance of
the RF and LSTM algorithms, this paper forecasts the
average closing value of the S&P 500 index,
elucidating the distinct advantages of each algorithm
in terms of error rates. Lastly, the proposed workflow
aims to assist investors in making more informed
decisions by leveraging automated feature selection
and prediction techniques, ultimately contributing to
enhanced profitability.
2 LITERATURE REVIEW
The research conducted by Htun et al. underscores the
significance of identifying essential features that can
impact the efficacy of machine learning algorithms
(Htun, Biehl, & Petkov, 2023). Venkatesh et al.
examined two principal methodologies for
Dimensionality Reduction (DR), specifically Feature
Selection (FS) and Feature Extraction (FE). The
authors concluded that the FS approach presents
advantages in managing static datasets, decreasing
model complexity, and alleviating the risk of model
overfitting (Venkatesh & Anuradha, 2019).
Ji et al. implemented wavelet denoising to
enhance technical indicators and proposed a two-
stage feature selection technique aimed at adaptively
optimizing 18 original technical indicators (Ji et al.,
2022). By integrating this methodology with the RF
model, their findings indicated an improvement in F1
scores while simultaneously reducing redundant
features. A comparable approach was utilized by
Peng et al., who employed three feature selection
algorithms: Sequential Forward Floating Selection
(SFFS), Tabu Search (TS), and Least Absolute
Shrinkage and Selection Operator (LASSO) (Peng et
al., 2021).
Bhuriya et al. formulated a linear regression
model utilizing a set of inputs derived from
mathematical equations for predictive analysis. Their
model incorporated open price, high price, low price,
and volume as independent variables, with the closing
price designated as the dependent variable. A
comparative analysis of the linear regression model
against polynomial regression and Radial Basis
Function (RBF) methods demonstrated that linear
regression yielded superior results (Bhuriya et al.,
2017).
Pawar et al. introduced the application of
recurrent neural network (RNN) and LSTM
algorithms for portfolio management. The results
indicated that the RNN-LSTM model achieved
greater accuracy in comparison to traditional machine
learning algorithms (Pawar, Jalem, & Tiwari, 2019).
Ghosh et al. conducted a comparative analysis of
stock price directional movements utilizing LSTM
and Reinforcement Learning (RL). They proposed a
multi-feature framework that incorporated returns
associated with closing prices, opening prices, and
intraday prices. The findings revealed that LSTM
outperformed RF in terms of daily return calculations
(Ghosh, Neufeld, & Sahoo, 2022).
Nonlinear methodologies, including tree-based
algorithms and neural network paradigms, have been
demonstrated to be effective in predicting stock prices
(Tan, Yan, & Zhu, 2019). RF is a versatile technology
applicable to both regression and classification tasks
(Vijh et al., 2020). Yin et al. proposed the D-RF-RS
method to optimize RF, achieving significant
enhancements in average accuracy and illustrating the
advantages of RF in medium- and long-term trend
forecasting (Yin et al., 2023). Additionally, Chen et
al. investigated a combination of a Genetic Algorithm
(GA) for feature selection and an LSTM neural
network, with the GA-LSTM model exhibiting robust
performance in time series prediction tasks (Chen &
Zhou, 2020). This paper employs RF and LSTM
methodologies for comparative analysis, capitalizing
on their respective strengths in stock market
prediction.
Multi-Time Scale Prediction of US Stock Index: A Feature Selection Based Approach Using LSTM and Random Forest
605

3 METHODOLOGY
3.1 Data Description
The S&P500 is a representative index in the US stock
market. The dataset used in this study spans from
January 2, 2020, to December 31, 2024. The dataset
consists of 6 columns, they are Date, Open, Close,
High, Low, and Volume. Table 1 demonstrates an
overview of the S&P500 dataset. These features
collectively provide a comprehensive view of market
dynamics and are used as input for the subsequent
analysis and modeling.
Table 1: Part of the dataset for the stock of S&P500.
DATE OPEN HIGH LOW CLOSE VOLUME
2020/1/2 3244.67 3258.14 3235.53 3257.85 3459930000
2020/1/3 3226.36 3246.15 3222.34 3234.85 3484700000
2020/1/6 3217.55 3246.84 3214.64 3246.28 3702460000
2020/1/7 3241.86 3244.91 3232.43 3237.18 3435910000
2020/1/8 3238.59 3267.07 3236.67 3253.05 3726840000
3.2 Data Pre-processing
The United States stock market is characterized by
the lack of regular trading activities during weekends
and holidays. A time series is defined as a sequence
of data points organized in chronological order at
consistent intervals, allowing for the analysis and
processing of the data as discrete-time data. By
utilizing weekly average statistics and calculating the
mean price and volume, fluctuations in daily data can
be mitigated, thereby yielding a more stable trend
signal. The formulation for calculating the average
weekly closing price is presented in Equation (1).
Weekly Average = P
1
n represents the actual trading days in one week
excluding holidays, represents the price on the i-th
trading day. If the number of trading days in a week
is less than 5 days, the formula calculates the average
based only on the price data of the actual trading days.
The following Figure 1 illustrates the Weekly
Average Candlestick Chart of the same dataset.
Table 2: 35 Technical Indicators Used in This Study.
Category Indicators
Trend-Following EMA_12, SMA_20, MACD, Signal Line, MACD Histogram, TEMA, DEMA,
LINEARREG, SAR, APO, HT_TRENDLINE, ADX, PSAR
Momentum RSI,KDJ_K,KDJD,STOCHK,STOCHD,Momentum,ROC,CMO, PPO,CCI,ULTOSC
Volatility ATR, BOLL Middle, BOLL_Upper, BOLLLower, WILLR, TRANGE, MIDPRICE
Volume-Based OBV, MFI, ADOSC
Average Typical Price TYPPRICE
ICDSE 2025 - The International Conference on Data Science and Engineering
606
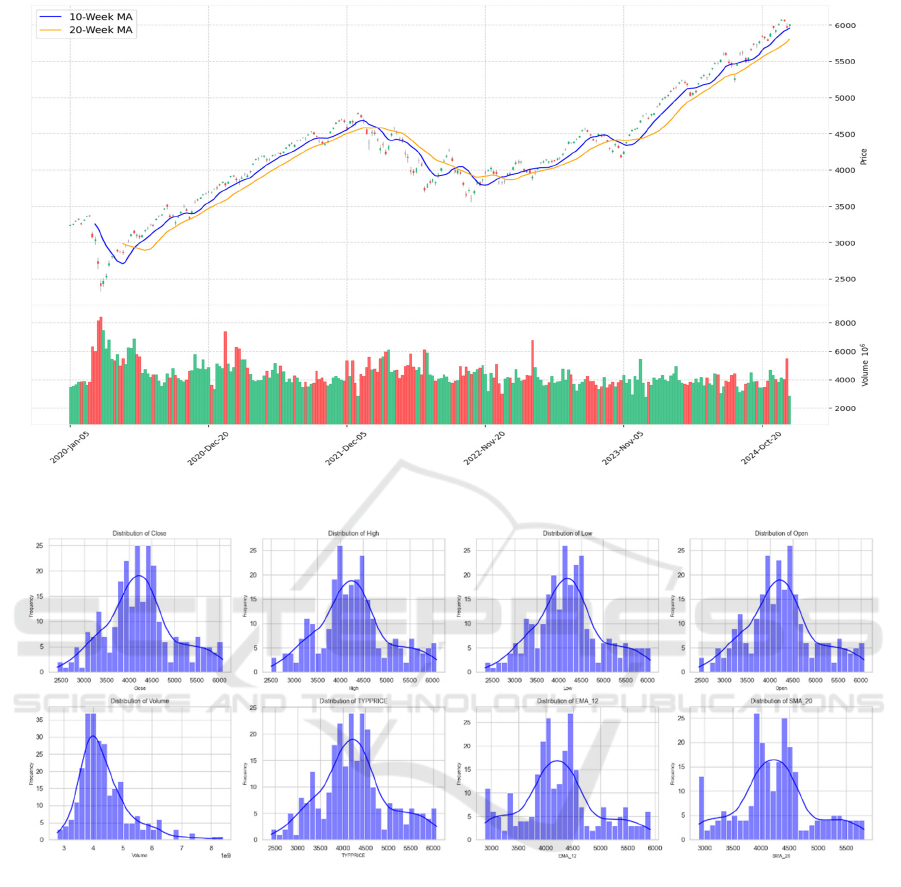
Figure 1: Weekly Average Candlestick Chart (2020-2024). (Picture credit: Original).
Figure 2: Distribution of Some Technical Indicators. (Picture credit: Original).
In the field of financial technical analysis,
technical indicators contain mathematical
calculations based on historical price and total
volume (Murphy, 1999). To predict stock index price,
35 indicators were introduced as shown in Table 2.
As the diagram shows in Figure 2, the indicators
follow the normal distribution.
Then for missing values inside the dataset, there
are three ways to deal with missing values. One is
calculating the average value, one is using the median
to fill in the missing part, and one is deleting all the
missing values. To determine which missing value
processing method performs the best, two evaluation
methods are applied. Observing normal distribution is
one method, the other method calculates the mean
square error (MSE), accuracy, and cross-validation.
After that, in this paper, the linear transformation
of the dataset is carried out by the normalization
method, and the original data is mapped to the range
of 0 to 1.
Furthermore, this study performs a feature
correlation analysis on the dataset through p-value
verification. By examining the correlation between
the selected features and the target feature (closing
price), the p-value serves as a statistically derived
measure of significance, acting as a threshold to
determine whether the observed relationships are due
to chance. A p-value below 0.05 indicates a
Multi-Time Scale Prediction of US Stock Index: A Feature Selection Based Approach Using LSTM and Random Forest
607

significant correlation, while features with p-values
exceeding 0.05 are considered spurious and are
subsequently excluded. The specific results of this
analysis are detailed in Table 3, which illustrates that
the features employed in this study are significantly
correlated with the target features.
The Pearson Correlation Coefficient (r) shows the
strength of linear correlation, where the value ranges
from 0 to 1. Table 3 below summarizes the features
selected based on their correlation strength and
statistical significance.
Table 3: Selected Features Based on Correlation Strength and P-value.
Correlation Stren
g
th Selected Features
Strong Correlation:
|
𝑟
|
≥0.9, 𝑝<0.05
P-TYPPRICE, EMA_12, SMA20, BOLLMiddle, BOLL_Upper, BOLLLower, TEMA,
DEMA, LINEARREG, MIDPRICE, HT_TRENDLINE, OBV
Moderate Correlation:
0.9 >
|
𝑟
|
≥ 0.7, 𝑝 < 0.05
MACD, Signal Line, SAR, PSAR
3.3 Cross-Validation
In this research, the cross-validation method utilized
is referred to as Holdout Validation, which is
executed using the 'train-test split' technique. The
dataset was partitioned into a training set and a testing
set, with 80% of the data designated for training and
the remaining 20% for testing. Both RF and LSTM
models were trained on the training set, and the test
set was subsequently employed to evaluate the
models' performance. The following metrics were
calculated to assess the models: the coefficient of
determination (R²), which evaluates the goodness of
fit between the predicted and actual values, with a
score closer to 1 indicating superior model
performance; Mean Absolute Error (MAE), which
measures the average absolute difference between
predicted and actual values; and Root Mean Squared
Error (RMSE), which assesses prediction error by
calculating the square root of the Mean Squared Error
(MSE) to revert the error to its original scale.
4 RESULTS
4.1 Missing Value Analysis
The average of MSE calculated by Cross-Validation
(CV) is used to evaluate the generalization ability, the
smaller the CV Mean MSE value the better
performance. As shown in Table 4, different methods
show various results. Removing missing values
performs the best in terms of cross-validation mean
squared error. However, its performance on the test
set is weaker than mean imputation and median
imputation, with a test MSE of 0.2926.
Table 4: Comparison of Missing Value Processing Methods.
Metho
d
MSE CV Mean MSE CV Mean F1-Score
Mean Im
p
utation 0.2630 0.2892 0.5230
Median Im
p
utation 0.2653 0.2890 0.5258
Removing Missing Values 0.2926 0.2881 0.5390
In this paper removing missing values method is
used. Both CV Mean MSE and CV Mean F1-Score
show better generalization ability. This method is a
straight forward and efficient approach as the
proportion of missing data is small. It avoids the
potential biases introduced by imputation techniques
compared to mean or median imputation. In addition,
it simplifies the preprocessing workflow, making it
more robust and less prone to errors during the
analysis process.
4.2 Performance Comparison RF and
LSTM Models
The results are presented in Tables 5 and 6, which
illustrate the predictive performance of the RF and
LSTM models in forecasting future values over 1-
week, 5-week, and 30-week horizons.
The results are presented in Tables 5 and 6, which
illustrate the predictive performance of the RF and
LSTM models in forecasting future values over 1-
week, 5-week, and 30-week horizons. These metrics,
ICDSE 2025 - The International Conference on Data Science and Engineering
608
including 𝑅
, MAE, and RMSE, provide a
comprehensive evaluation of the accuracy and
reliability of each model. As demonstrated in Tables
5 and 6, it is evident that the RF model outperforms
in predicting future data over a 1-week horizon.
However, its performance declines as the
prediction horizon lengthens, with an 𝑅
of 0.7923
for the 30-week prediction. In contrast, LSTM
outperforms RF in 5 weeks and 30 weeks forecasts,
achieving an 𝑅
of 0.9535 for 5 weeks and 0.9003 for
30 weeks.
Table 5: RF Performance Comparison.
Target
𝑅
MAE RMSE
1 Wee
k
0.948776 0.028975 0.039593
5 Weeks 0.917610 0.035706 0.052539
30 Weeks 0.792345 0.046047 0.075173
Table 6: LSTM Performance Comparison.
Target
𝑅
MAE RMSE
1 Wee
k
0.929212 0.036475 0.046543
5 Weeks 0.953484 0.032979 0.039477
30 Weeks 0.900300 0.043782 0.052088
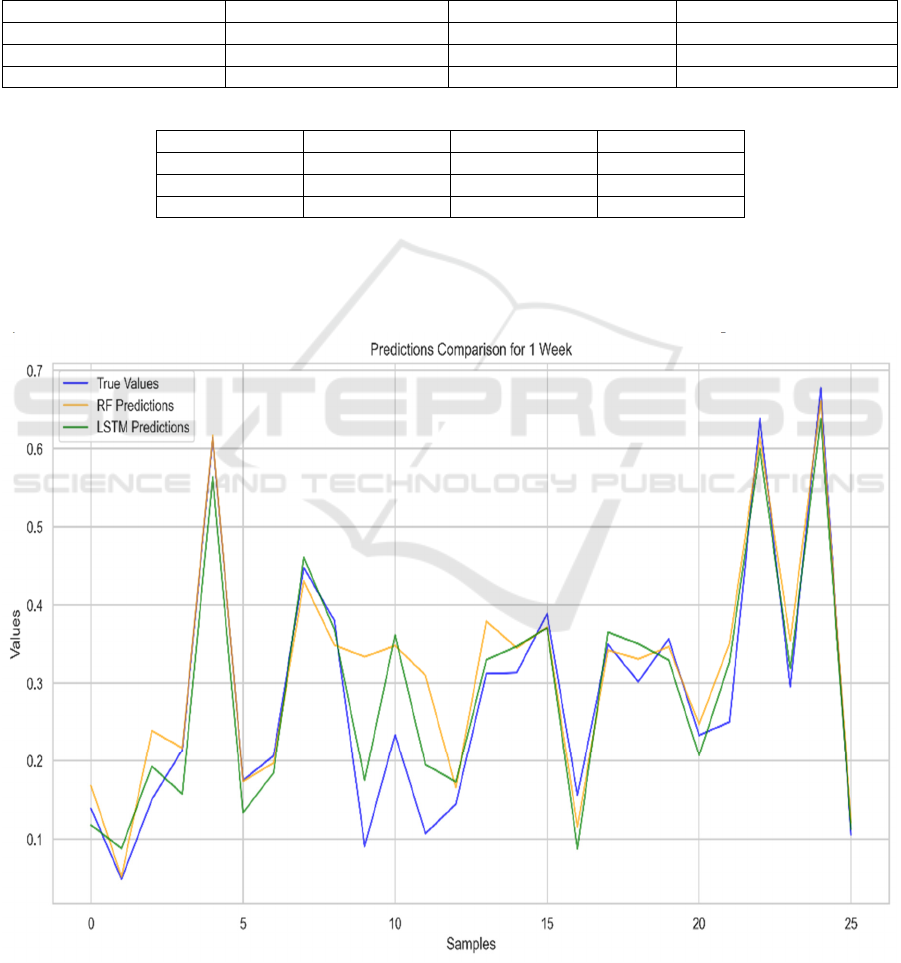
The predictive performance of both models is
further illustrated in Figures 3, 4, and 5, which
compare the true values against the predictions made
by the RF and LSTM models for the 1-week, 5-week,
and 30-week horizons, respectively. These figures
provide a visual representation of how well the
models capture the underlying trends and fluctuations
in the data across different temporal scales.
Figure 3: Comparison of Model Predictions and True Values for 1-week.(Picture credit: Original).
Multi-Time Scale Prediction of US Stock Index: A Feature Selection Based Approach Using LSTM and Random Forest
609
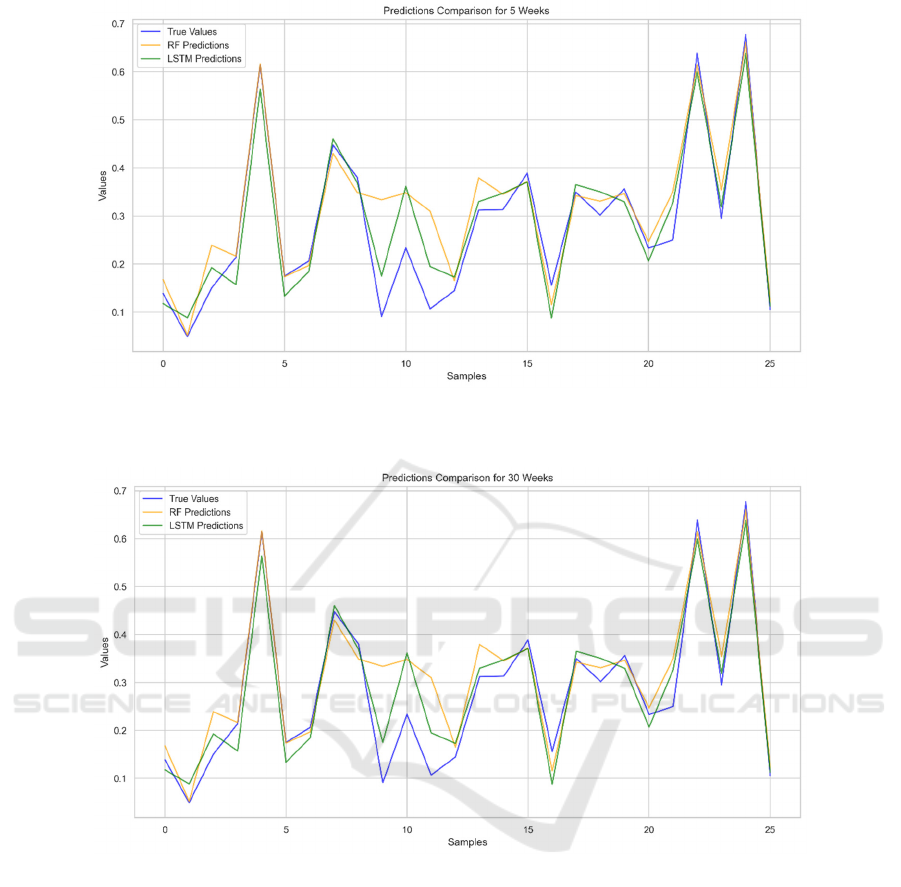
Figure 4: Comparison of Model Predictions and True Values for 5-weeks. (Picture credit: Original).
Figure 5: Comparison of Model Predictions and True Values for 30-weeks. (Picture credit: Original).
LSTM is good in dealing with problems that are
highly related to time series, this model is very good
for prediction on time series. LSTM is a type of RNN
due to its ability to capture long-term dependencies
and temporal patterns in sequential data. The
advantages of LSTM compared to other artificial
neural network models include its ability to preserve
past information for a longer period of time, to be
resistant to vanishing gradient problems, and to
model temporal dependencies better.
Random Forests is a collection of classification and
regression trees, it offers an intuitive method for
predicting outcomes. However, RF often provides
poor accuracy for complex variables.
RF is an ensemble learning method based on decision
trees, commonly used for structured data. It is
characterized by its robustness and high training
efficiency. The model handles noisy data by
averaging the outputs of multiple decision trees,
therefore reducing the risk of overfitting.
LSTM is a variant of RNN designed for time-series
data and captures long-term dependencies effectively.
Hence, for short-term forecasting, RF is preferred due
to its computational efficiency and robustness. For
mid- or long-term predictions, LSTM is more
suitable. It is effective at capturing temporal
dependencies in time-series data. In addition, LSTM
can model the nonlinear dynamics.
ICDSE 2025 - The International Conference on Data Science and Engineering
610

5 CONCLUSIONS
This paper evaluates the predictive performance of
RF and LSTM models for short, mid, and long-term
forecasting tasks. The results show that both models
have distinct strengths and are suitable for different
time series. RF is better at short-term predictions due
to its simplicity and speed, while LSTM is better
suited for mid- and long-term. Future work could
explore hybrid approaches that combine the strengths
of both models to further enhance forecasting
performance.
In the future, advanced hybrid modeling
approaches that integrate the strength of both RF and
LSTM are expected to emerge as a promising
direction. Such models could leverage RF's efficiency
and robustness in handling noisy, structured data and
can be utilized by LSTM with its ability to capture
complete temporal dependencies and nonlinear
dynamics. In addition, there may be a chance to have
various combination machine learning algorithms
integrated together to perform a better prediction task.
Moreover, with the advancement of deep learning
techniques, the rapid growth of large-scale datasets
presents both opportunities and challenges, such as
sensitivity to noise and high training costs. These
challenges may be addressed in the near future
through the implementation of automated feature
engineering techniques in conjunction with artificial
intelligence frameworks, which could significantly
enhance the adaptability of predictive models.
REFERENCES
Bhuriya, D., Kaushal, G., Sharma, A., & Singh, U., 2017.
Stock market predication using a linear regression. In
2017 International Conference of Electronics,
Communication and Aerospace Technology (ICECA),
Vol. 2, pp. 510-513. IEEE.
Chen, S., & Zhou, C., 2020. Stock prediction based on
genetic algorithm feature selection and long short-term
memory neural network. IEEE Access, 9, 9066-9072.
Ghosh, P., Neufeld, A., & Sahoo, J. K., 2022. Forecasting
directional movements of stock prices for intraday
trading using LSTM and random forests. Finance
Research Letters, 46, 102280.
Hao, Y., 2023. Research on Optimization of Stock Index
Prediction Model Based on Random Forest and LSTM
Network. (Master's thesis, Harbin Commercial
University).
Htun, H. H., Biehl, M., & Petkov, N., 2023. Survey of
feature selection and extraction techniques for stock
market prediction. Financial Innovation, 9(1), 26.
James, G., Witten, D., Hastie, T., & Tibshirani, R., 2013.
An introduction to statistical learning. Vol. 112, No. 1.
Springer, New York.
Ji, G., Yu, J., Hu, K., Xie, J., & Ji, X., 2022. An adaptive
feature selection schema using improved technical
indicators for predicting stock price movements. Expert
Systems with Applications, 200, 116941.
Murphy, J. J., 1999. Technical analysis of the financial
markets: A comprehensive guide to trading methods
and applications. Penguin.
Pawar, K., Jalem, R. S., & Tiwari, V., 2019. Stock market
price prediction using LSTM RNN. In Emerging
Trends in Expert Applications and Security:
Proceedings of ICETEAS 2018, pp. 493-503. Springer
Singapore.
Peng, Y., Albuquerque, P. H. M., Kimura, H., & Saavedra,
C. A. P. B., 2021. Feature selection and deep neural
networks for stock price direction forecasting using
technical analysis indicators. Machine Learning with
Applications, 5, 100060.
Tan, Z., Yan, Z., & Zhu, G., 2019. Stock selection with
random forest: An exploitation of excess return in the
Chinese stock market. Heliyon, 5(8).
Venkatesh, B., & Anuradha, J., 2019. A review of feature
selection and its methods. Cybernetics and Information
Technologies, 19(1), 3-26.
Vijh, M., Chandola, D., Tikkiwal, V. A., & Kumar, A.,
2020. Stock closing price prediction using machine
learning techniques. Procedia Computer Science, 167,
599-606.
Yin, L., Li, B., Li, P., & Zhang, R., 2023. Research on stock
trend prediction method based on optimized random
forest. CAAI Transactions on Intelligence Technology,
8(1), 274-284.
Multi-Time Scale Prediction of US Stock Index: A Feature Selection Based Approach Using LSTM and Random Forest
611
