
Refining Medical Insurance Cost Predictions with Advanced Machine
Learning Models
Sheying Shen
a
School of Business, Nanjing University, Nanjing, Jiangsu, China
Keywords: Medical Cost, Insurance Prediction, Algorithms, Machine Learning.
Abstract: This paper employs diverse machine learning algorithms to enhance the accuracy of medical insurance cost
predictions. With the increasing complexity of healthcare costs and the need for fair and sustainable pricing
strategies, improving predictive accuracy is essential for both insurers and policyholders. Traditional methods
often fail to capture the intricate relationships between various factors and medical costs, leading to
suboptimal pricing. To address this, this paper leverages advanced machine learning techniques, including
ensemble methods like XGBoost and Random Forest, to analyse real-world data. These methods not only
improve prediction accuracy but also provide valuable insights into the key drivers of medical costs, such as
lifestyle behaviours and health indicators. Results show ensemble methods like XGBoost and so on excel in
predictive accuracy and generalization as well as offer insights into feature impacts, highlighting the
substantial influence of behavioural and health indicators on pricing. The research concludes that these
advanced techniques can significantly improve prediction precision, aiding insurers in refining their pricing
strategies. It also underscores the role of model interpretability in financial risk management.
1 INTRODUCTION
Predicting medical insurance costs is very important
for creating fair pricing strategies. In the past,
insurance companies mostly used simple linear
models or basic rules to estimate costs. These
methods were easy to use but often missed important
patterns in the data. As a result, insurers sometimes
had trouble finding the right balance between keeping
costs low for customers and making sure they could
cover their expenses. This could lead to pricing that
wasn't as accurate or effective as it could be.
Machine learning has changed this situation.
Unlike traditional methods, machine learning can
handle a lot of different variables and find
connections that were hard to see before. This helps
insurers understand what drives medical costs better,
so they can set prices more accurately and manage
risks more effectively. This not only helps insurance
companies stay financially stable but also makes
healthcare more accessible for everyone.
Recent studies have explored various machine
learning algorithms to make relevant predictions. For
instance, Orji and Ukwandu (2024) implemented
a
https://orcid.org/0009-0004-2936-8535
ensemble models like Extreme Gradient Boosting
(XGBoost), Gradient Boosting Machine (GBM), and
Random Forest (RF) to forecast medical insurance
expenses. Their findings indicated that XGBoost
achieved superior performance, while RF balanced
accuracy and computational efficiency. Similarly,
Cenita et al. (2023) evaluated Linear Regression,
Gradient Boosting, and Support Vector Machine
(SVM) models. Their results demonstrated that
Gradient Boosting outperformed the other models,
achieving an R² of 0.892 and the lowest Root Mean
Square Error (RMSE) of 1336.594. Billa and Nagpal
(2024) conducted a comparative analysis of different
machine learning algorithms for medical insurance
price prediction. Their study highlighted the
effectiveness of ensemble methods over traditional
regression models, suggesting that ensemble
approaches provide better predictive performance.
Effective feature selection is crucial for enhancing
the performance of machine learning models in
healthcare cost prediction. Panay and Baloian (2020)
developed a method using Weighted k-Nearest
Neighbours (k-NN) and Evidential Regression to
select relevant features for predicting healthcare
Shen, S.
Refining Medical Insurance Cost Predictions with Advanced Machine Learning Models.
DOI: 10.5220/0013702200004670
Paper published under CC license (CC BY-NC-ND 4.0)
In Proceedings of the 2nd International Conference on Data Science and Engineering (ICDSE 2025), pages 573-580
ISBN: 978-989-758-765-8
Proceedings Copyright © 2025 by SCITEPRESS – Science and Technology Publications, Lda.
573
costs. Their transparent model performed comparably
to Artificial Neural Networks and Gradient Boosting,
achieving an R² of 0.44. Additionally, Singh et al.
(2022) reviewed various feature selection methods
and their impact on machine learning algorithms in
healthcare applications. They emphasized the
importance of selecting appropriate features to
improve model accuracy and generalization.
While existing studies have applied various
machine learning models and feature selection
methods to make prediction, there is a lack of
research focusing on the interpretability of these
models. Understanding the influence of individual
features on predictions is essential for stakeholders to
make informed decisions.
This paper explores how machine learning can
help predict costs more accurately. It looks at the
problems with older methods and shows how
machine learning can be a better solution. By
analyzing real data and using advanced algorithms,
this paper aims to provide useful insights for insurers
to develop better pricing strategies in the future.
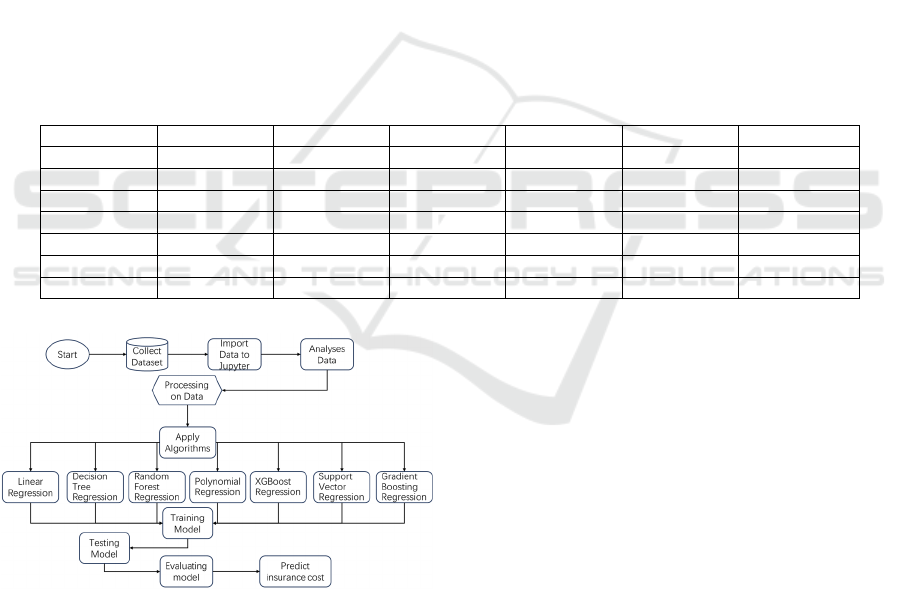
2 METHODOLOGIES
This paper collects medical insurance data from
Kaggle. The data includes 7 features, 4 of which are
numerical and 3 categorical. The focus is on
predicting the exact price of medical insurance based
on these 7 features (Table 1). This section briefly
describes the research process depicted in Figure 1.
The study followed five main stages: data
preprocessing, exploratory data analysis (EDA),
model training and evaluation, overfitting analysis,
and feature contribution analysis. The dataset was
cleaned and prepared, followed by EDA to
understand data distributions. Multiple machine
learning models were then trained and evaluated
using key metrics such as R² and RMSE. Overfitting
was assessed, and feature contributions were analysed
using SHAP values.
Table 1: Part of dataset
Age Sex Bmi Children Smoker Region Charges
19 Female 27.900 0 yes Southwest 16884.92400
18 Male 33.700 1 No Southeast 1725.55230
28 Male 33.000 3 No Southeast 4449.46200
33 Male 22.705 0 No Northwest 21984.47061
32 Male 28.880 0 No Northwest 3866.85520
31 Female 25.740 0 No Southeast 3756.62160
46 Female 33.440 1 No Southeast 8240.58960
Figure 1. Detailed Flowchart for Predicting Medical
Insurance Costs (Picture credit: Original)
2.1 Data Preprocessing
The data preprocessing stage focused on preparing
the dataset for analysis and modeling. Firstly, the
dataset used in this study had no missing values.
Categorical variables, including gender, smoking
status, and region, were encoded into numerical
representations using mapping dictionaries. This
transformation was essential to enable machine
learning models to process these features effectively.
Initially, numerical features such as age, BMI, and
charges were not standardized. These features were
first examined in their raw form and utilized in the
initial phase of algorithm development. It was only
during subsequent stages of algorithm optimization
that these features underwent standardization to
ensure that differences in feature scales would not
bias the model training process. These preprocessing
steps collectively ensured the dataset was clean,
consistent, and ready for further analysis.
2.2 Exploratory Data Analysis (EDA)
To gain insights into the dataset, Exploratory Data
Analysis (EDA) was performed using visualization
techniques and summary statistics. The distribution
of numerical features was explored through
histograms and kernel density estimation (KDE)
plots. For example, Figure 2 illustrates the
ICDSE 2025 - The International Conference on Data Science and Engineering
574
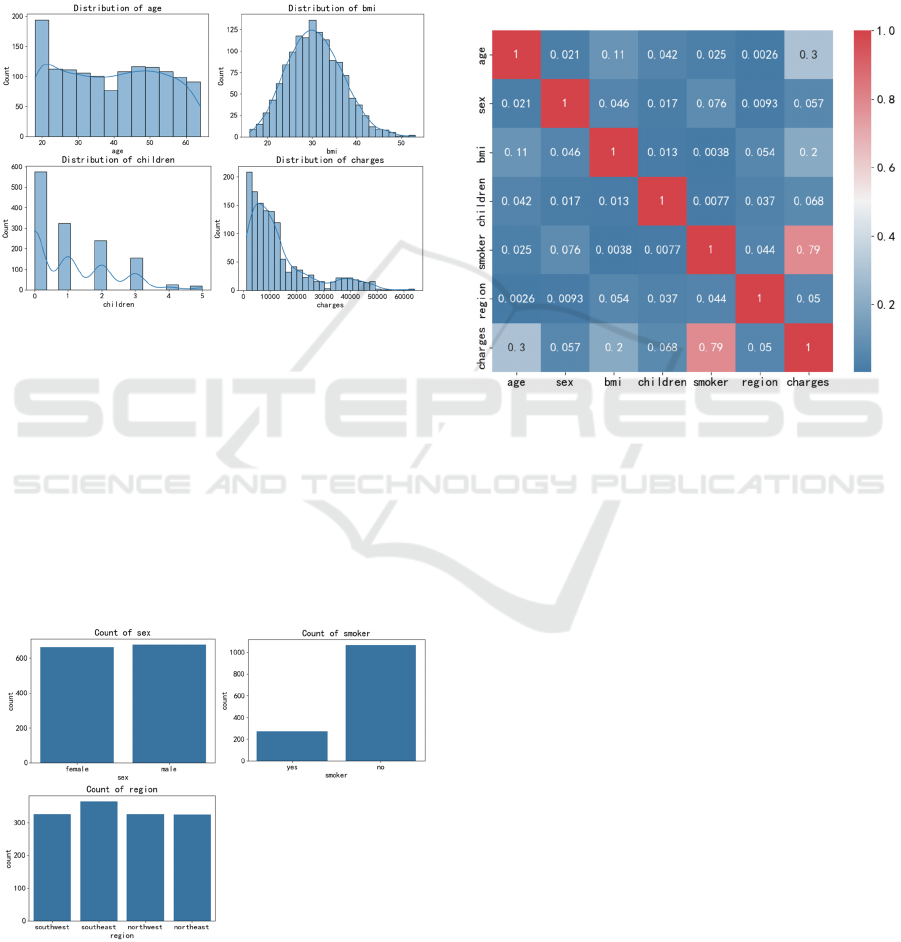
distribution of numerical variables such as Age, BMI,
and Charges. The x-axis represents the value range of
each feature, while the y-axis indicates the frequency
or density of occurrences. The plot reveals that BMI
exhibits a right-skewed distribution, with most values
concentrated in the lower range. Medical charges, on
the other hand, show a wide variability, indicating
significant differences in insurance costs among
individuals.
Figure 2: Distribution of Numerical variables (Picture
credit: Original)
Figure 3 examines the distribution of categorical
variables, including Gender, Smoker, and Region.
Count plots were used to visualize the frequency of
each category. The x-axis denotes the categories (e.g.,
Male/Female, Yes/No for smoker status, and different
regions), while the y-axis shows the number of
occurrences. The analysis confirms a balanced
representation of genders and smoking statuses in the
dataset, with a relatively even distribution across
different regions.
Figure 3: Distribution of Categorical variables (Picture
credit: Original)
Figure 4 presents a heatmap of Pearson
correlation coefficients, visualizing the strength of
relationships between features. The x-axis and y-axis
both represent the features in the dataset, while the
color intensity indicates the magnitude of correlation.
The heatmap reveals strong positive correlations
between smoking status and medical charges, as well
as between BMI and medical charges. These findings
highlight the potential of smoking status and BMI as
significant predictors of insurance costs.
Figure 4: Pearson Correlation Heatmap (Picture credit:
Original)
Overall, this phase of EDA provided a solid
understanding of the dataset, setting the foundation
for model development. The visualizations and
statistical summaries helped identify key patterns and
relationships that would inform the selection and
training of machine learning models.
3 RESULTS
3.1 Model Training and Evaluation
Multiple machine learning models were trained to
predict insurance costs. The selected models included
Linear Regression, Decision Tree Regression,
Random Forest Regression, XGBoost Regression,
Support Vector Regression (SVR), Gradient Boosting
Regression, Polynomial Regression (degree=2) and
Polynomial Regression (degree=3). These models
were chosen to cover a spectrum of capabilities, from
simple linear predictors to complex ensemble
methods. The models were trained and tested on an
80-20 split of the dataset, and their performance was
evaluated using metrics such as R², mean squared
Refining Medical Insurance Cost Predictions with Advanced Machine Learning Models
575
error (MSE), and root mean squared error (RMSE).
Also, after the first stage of algorithm training, some
models had poor prediction performance, so the
algorithm was optimized in the second stage. The
final results are shown in the Table 2. XGBoost,
Gradient Boosting, and Random Forest emerged as
the top-performing models, delivering high predictive
accuracy and robust generalization.
Table 2: Result of all the algorithms
Re
g
ression Models R s
q
uared MSE RMSE MAE
Linear Regression 0.78 34,011,470.00 5831.94 4211.92
Decision Tree Regression 0.76 37,916,750.00 6157.66 2798.95
Random Forest Regression 0.88 19,145,080.00 4375.51 2430.58
XGBoost Re
g
ression 0.88 18,013,380.00 4244.22 2383.64
SVR
(
Su
pp
ort Vector Re
g
ression
)
0.66 53,519,900.00 7315.73 3588.89
Gradient Boosting Regression 0.88 18,874,540.00 4344.48 2392.89
Polynomial Regression (degree=2) 0.87 20,558,010.00 4534.09 2722.62
Polynomial Regression (degree=3) 0.85 22,646,870.00 4758.87 2844.96
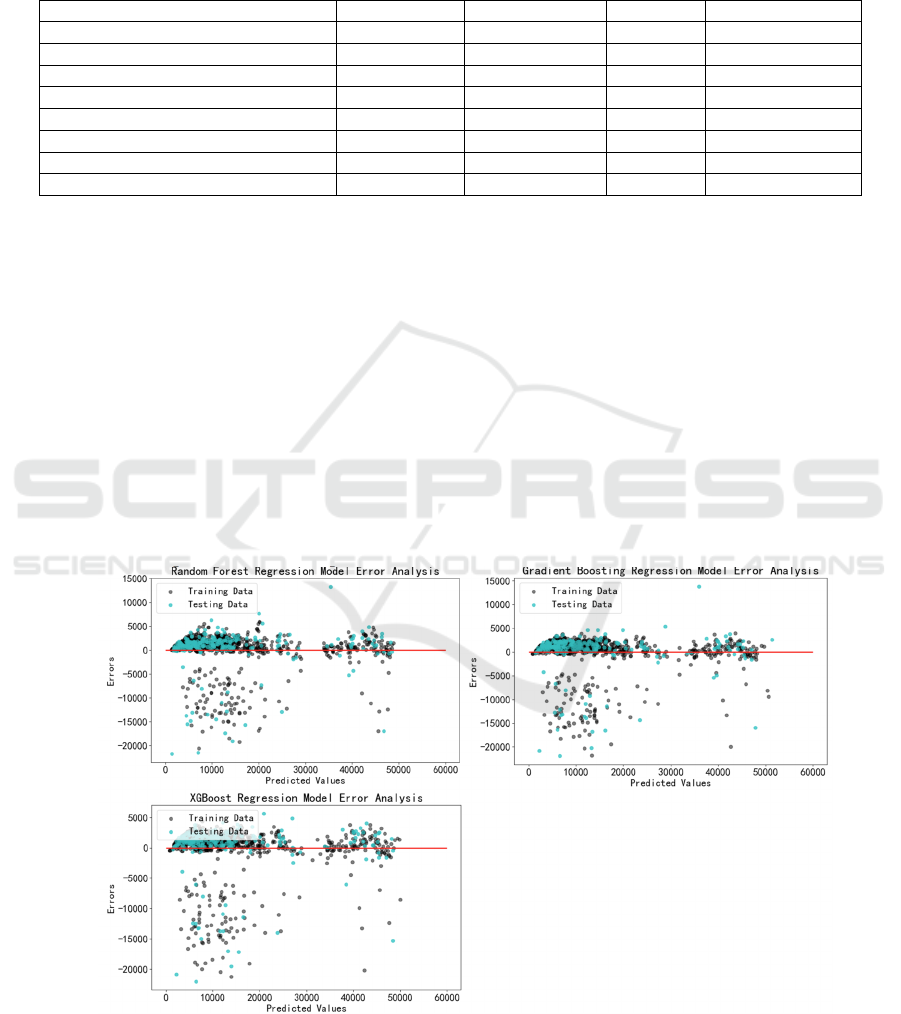
3.2 Model Training and Evaluation
In the realm of predictive modelling, overfitting is a
prevalent concern that can undermine the reliability
of a model's predictions on unseen data. To address
this, the paper conducted an analysis focusing on
three ensemble methods that demonstrated superior
performance in previous assessments: Random Forest
Regression, XGBoost Regression, and Gradient
Boosting Regression.
Figure 5 illustrates the residual plots for each of
the three models, showing how prediction errors are
distributed. In these plots, the x-axis represents the
predicted values, while the y-axis shows the residuals
(the difference between actual and predicted values).
Ideally, residuals should be randomly scattered
around zero without any discernible pattern. For
Random Forest Regression, the residuals exhibit
some clustering but are generally well-distributed.
XGBoost Regression shows an even more uniform
distribution of residuals, indicating minimal bias in
predictions. Gradient Boosting Regression also
displays a favourable pattern, with residuals closely
clustered around zero. These visual assessments
suggest that all three models generalize well to
unseen data.
Figure 5: Residual Plots of 3 Regression Models (Picture credit: Original)
To further validate these observations, we
employed cross-validation, a technique that provides
a quantitative measure of model performance across
different subsets of data. Figure 6 presents the cross-
ICDSE 2025 - The International Conference on Data Science and Engineering
576
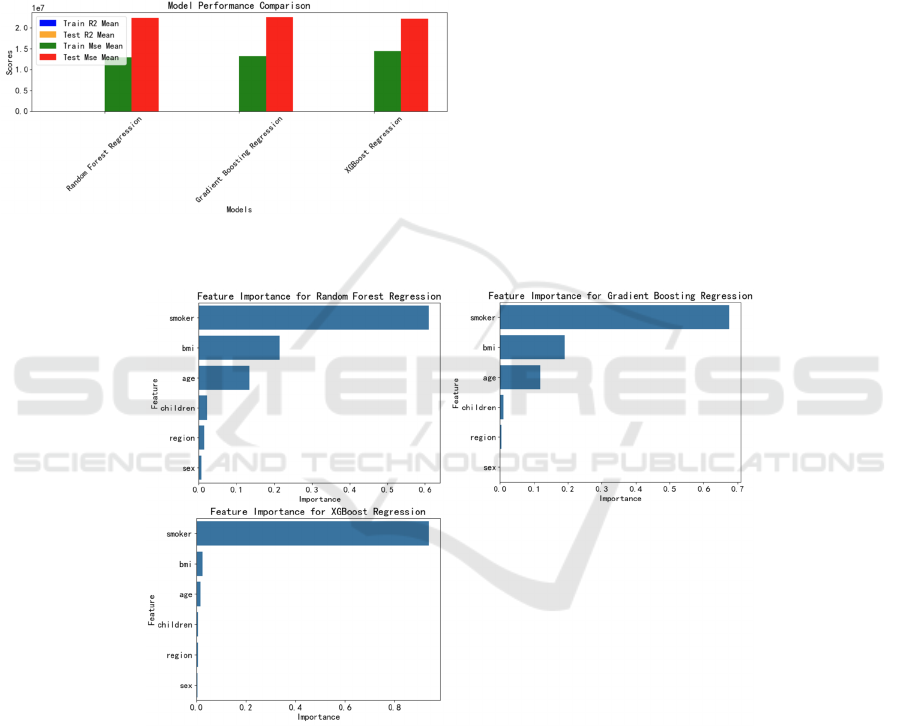
validated performance metrics for the three models.
The x-axis denotes the models, while the y-axis
shows the average R² score and Mean Squared Error
(MSE) from cross-validation. The results confirm that
all three models achieve high R² scores and low MSE
values, indicating strong predictive accuracy and
robust generalization. XGBoost Regression slightly
outperforms the others, with the highest R² score and
the lowest MSE, reinforcing its effectiveness in
capturing complex patterns in the data.
Figure 6: Cross-Validated Performance of 3 Regression
Models (Picture credit: Original)
3.3 Feature Contribution Analysis
This paper assesses the influence of various features
on predictive outcomes by computing feature
importance scores for tree-based models. This
method ranks variables based on their impact on
predictions, identifying the most influential features
in the model's decision-making process. The analysis
also includes SHAP values to provide a detailed
examination of each feature's contribution to
individual predictions, thereby enhancing model
interpretability.
Figure 7 displays the feature importance plots for
the three regression models. The x-axis represents the
feature importance scores, while the y-axis lists the
features. For all models, 'smoker' status and 'BMI' are
identified as the most influential features, followed by
'age' and 'number of children'. This ranking
underscores the significant impact of lifestyle and
health indicators on insurance costs.
Figure 7: Feature Importance Plot of 3 Regression Models (Picture credit: Original)
Figure 8 presents the SHAP summary plots for the
same models, offering a granular view of each
feature's contribution to individual predictions. The
x-axis shows the SHAP values, indicating the impact
of each feature on the model output, while the y-axis
lists the features, with the most important ones at the
top. The plots reveal that 'smoker' status has a
substantial positive impact on predicted charges,
while 'BMI' and 'age' also contribute significantly.
These findings align with the results from the
exploratory data analysis, highlighting the critical
role of these features in determining costs.
Refining Medical Insurance Cost Predictions with Advanced Machine Learning Models
577
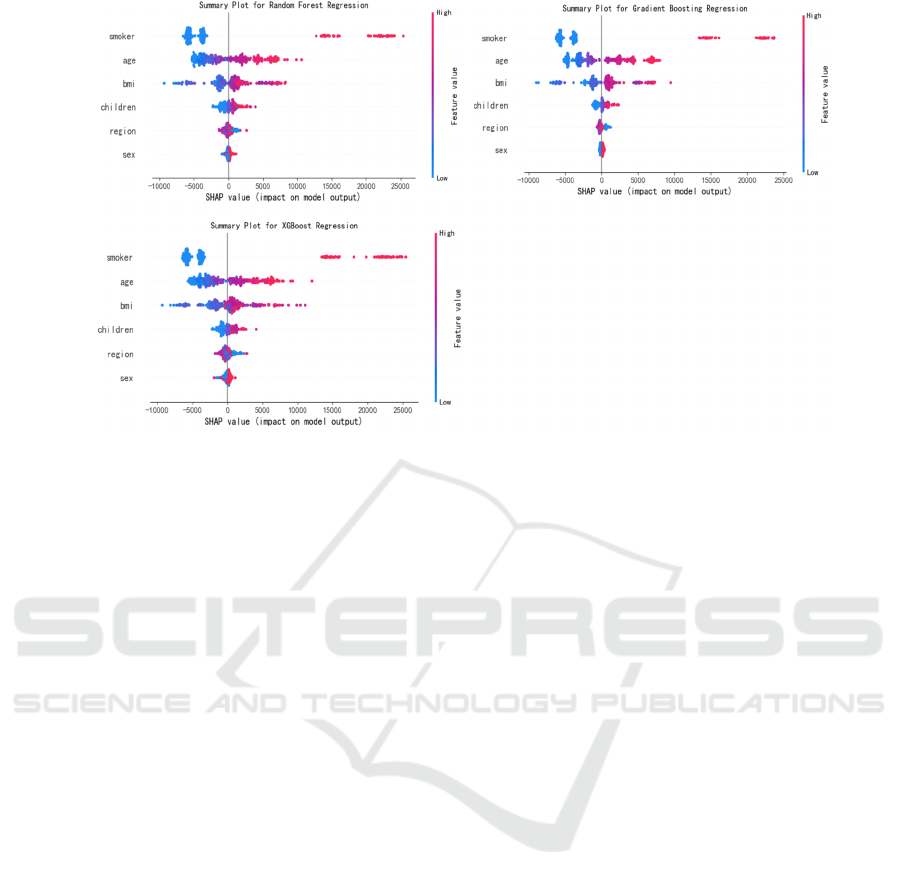
Figure 8: SHAP Summary Plot of 3 Regression Models (Picture credit: Original)
Overall, the combination of feature importance
scores and SHAP values provides a comprehensive
view of feature contributions, confirming the
dominant influence of 'smoker' status, 'BMI', and 'age'
on insurance pricing. This analysis offers
transparency into the models' decision-making
processes and provides a clear basis for further
discussions on model implications.
4 DISCUSSION OF RESULTS
This study systematically evaluates the performance
of diverse machine learning algorithms in predicting
medical insurance costs and elucidates the underlying
factors driving these predictions. The following
sections provide an in-depth discussion of model
performance disparities, interpretability insights from
residual and SHAP analyses, limitations of the
current approach, and future research directions.
4.1 Model Performance and
Algorithmic Disparities
The superior performance of XGBoost and Random
Forest regression models (R² = 0.88) compared to
simpler methods like Linear Regression (R² = 0.78)
highlights the critical role of ensemble techniques in
capturing non-linear relationships and complex
feature interactions. XGBoost’s gradient-boosting
framework, which iteratively corrects errors from
previous trees, enables it to model intricate patterns in
healthcare data more effectively than shallow models
(Chen & Guestrin, 2016). In contrast, Linear
Regression, while computationally efficient, assumes
linearity and homoscedasticity — assumptions often
violated in healthcare cost datasets characterized by
skewed distributions and heteroscedasticity (Cenita et
al., 2023). Decision Tree Regression’s tendency to
overfit (training RMSE: 2798.95 vs. test RMSE:
6157.66) underscores the limitations of single-tree
models in generalizing to unseen data, a weakness
mitigated by ensemble methods through aggregation
and regularization (Biau & Scornet, 2016).
The robust generalization of ensemble methods is
further validated by residual analysis (Figure 5),
where errors for XGBoost and Random Forest are
symmetrically distributed around zero, indicating
minimal bias. In contrast, Linear Regression exhibits
systematic underestimation of high-cost cases
(residuals > 10,000), likely due to its inability to
account for multiplicative effects between variables
such as smoking and age. This aligns with findings by
Orji and Ukwandu (2024), who noted that linear
models often fail to capture interactions critical to
healthcare cost prediction.
Future improvements could explore hybrid
approaches, such as stacking ensemble models with
deep learning architectures (e.g., neural networks) to
further enhance predictive accuracy. Additionally,
incorporating domain-specific constraints (e.g.,
actuarial fairness principles) into model training
could address potential biases in risk assessment
(Sharma & Jeya, 2024).
ICDSE 2025 - The International Conference on Data Science and Engineering
578

4.2 Interpretability Insights: Smoking,
BMI, and Residual Patterns
The SHAP analysis (Figures 7–8) identifies smoking
status and BMI as the most influential predictors,
consistent with prior studies linking these variables to
chronic diseases and elevated healthcare utilization
(Panay et al., 2020). Smoking’s outsized impact
(SHAP value range: +5,000 to +20,000) reflects its
association with conditions such as lung cancer and
cardiovascular diseases, which incur high treatment
costs (Boodhun & Jayabalan, 2018). The positive
correlation between BMI and charges (SHAP range:
+1,000 to +8,000) may stem from obesity-related
comorbidities like diabetes and hypertension, which
drive long-term medical expenses (Jain & Singh,
2018). Notably, the interaction between smoking and
BMI—though not explicitly modeled—could amplify
risks, as smoking exacerbates metabolic dysfunction
in obese individuals (Vijayalakshmi et al., 2023).
Future work should incorporate interaction terms or
employ interpretable models like Generalized
Additive Models (GAMs) to disentangle these
effects.
Residual patterns further reveal that ensemble
methods minimize systematic errors for high-cost
cases, whereas simpler models struggle with outliers.
This aligns with the findings of Jain and Singh
(2018), who emphasized that tree-based models
inherently handle skewed distributions through
hierarchical partitioning, unlike linear models reliant
on Gaussian assumptions.
4.3 Limitations and Future Direction
While this study advances medical insurance cost
prediction, several limitations warrant attention. First,
the dataset (n=1,338) is relatively small and lacks
granular clinical variables (e.g., pre-existing
conditions, medication history), limiting the model’
s ability to capture nuanced health risks. Expanding
data sources to include electronic health records
(EHRs) or claims histories could improve predictive
granularity (Panda et al., 2022). Second, the study
focuses on tree-based models and polynomial
regression; alternative approaches like Bayesian
networks or transformer-based architectures remain
unexplored. Recent work by Ejiyi et al. (2022)
suggests that Bayesian methods excel in uncertainty
quantification, a valuable feature for risk-sensitive
applications like insurance pricing.
Finally, the ethical implications of using
behavioral features (e.g., smoking) for pricing require
careful consideration. While these variables improve
accuracy, they risk penalizing individuals for lifestyle
choices influenced by socioeconomic factors. Future
research should integrate fairness-aware machine
learning techniques to ensure equitable premium
calculations (Billa & Nagpal, 2024).
By addressing these limitations and building on
the interpretability frameworks established here,
subsequent studies can further bridge the gap between
predictive accuracy and ethical, transparent insurance
pricing.
5 CONCLUSION
This paper establishes a robust framework for make
predictions in medical insurance by harmonizing
advanced machine learning techniques with model
interpretability tools. Through systematic
comparisons of algorithms including XGBoost,
Random Forest, and polynomial regression, the
research demonstrates that ensemble methods
outperform traditional linear models in capturing
complex feature interactions, achieving an R² of 0.88.
Crucially, the integration of SHAP values provides
granular insights into the drivers of insurance costs—
notably smoking status and BMI—while residual
analysis validates the generalizability of these
models. By bridging predictive accuracy with
transparency, this work addresses a critical gap in
actuarial science, where interpretability is essential
for ethical pricing strategies and stakeholder trust.
This research validates the utility of machine
learning approaches, particularly ensemble methods
like XGBoost and Random Forest, in accurately
predicting insurance costs. By integrating SHAP
values, the study identifies significant predictors and
explains their impact on individual predictions
transparently. The findings highlight the importance
of behavioral factors, such as smoking status, in
determining insurance premiums, offering insights
into the complex interplay of health-related variables
and financial risk.
Financially, these findings have several
implications. Firstly, recognizing smoking status as a
critical cost driver underscores the need for insurers
to develop risk-adjusted premium structures that
reflect behavioral health risks adequately. This could
encourage healthier lifestyles among policyholders,
potentially reducing overall claims and enhancing the
financial sustainability of insurance portfolios.
Secondly, the study underscores the value of
advanced machine learning techniques in risk
assessment, offering insurers a tool to improve the
accuracy of their pricing strategies. Accurate cost
Refining Medical Insurance Cost Predictions with Advanced Machine Learning Models
579

predictions enable more competitive pricing,
allowing insurers to maintain market share while
minimizing financial risk.
Moreover, the use of SHAP values introduces a
level of interpretability crucial in the financial sector,
where decision-making often requires transparency to
gain stakeholder trust. By elucidating the contribution
of each feature, this research provides insurers with
actionable insights, enabling them to communicate
pricing decisions more effectively to customers and
regulators. For instance, the significant impact of
BMI and smoking status on premiums could serve as
evidence for targeted wellness programs or
differential pricing based on modifiable health
behaviors.
Additionally, this study contributes to the broader
discourse on financial risk management by
demonstrating how data-driven approaches can
optimize pricing strategies while maintaining fairness
and equity. The negligible influence of regional
factors in this dataset suggests that geographic pricing
discrimination may not be justified in certain
contexts, reinforcing the importance of evidence-
based decision-making in financial services.
In summary, this research bridges the gap between
advanced predictive modeling and practical financial
applications, offering a roadmap for insurers to
leverage machine learning for improved pricing
accuracy and risk assessment. It highlights the
potential for data-driven insights to drive innovation
in financial product design, ultimately contributing to
a more efficient and equitable insurance market.
REFERENCES
Billa, M.M., Nagpal, T., 2024. Medical insurance price
prediction using machine learning. Journal of
Electrical Systems, 20(7s), 2270-2279.
Boodhun, N., Jayabalan, M., 2018. Risk prediction in life
insurance industry using supervised learning
algorithms. Complex & Intelligent Systems, 4(2), 145-
154.
Cenita, J.A.S., Asuncion, P.R.F., Victoriano, J.M., 2023.
Performance evaluation of regression models in
predicting the cost of medical insurance. arXiv preprint
arXiv: 2304.12605.
Ejiyi, C.J., Qin, Z., Salako, A.A., et al., 2022. Comparative
analysis of building insurance prediction using some
machine learning algorithms.
Orji, U., Ukwandu, E., 2024. Machine learning for an
explainable cost prediction of medical insurance.
Machine Learning with Applications, 15, 100516.
Panay, B., Baloian, N., Pino, J.A., et al., 2020. Feature
selection for health care costs prediction using weighted
evidential regression. Sensors, 20(16), 4392.
Panda, S., Purkayastha, B., Das, D., et al., 2022. Health
insurance cost prediction using regression models. In:
2022 International Conference on Machine Learning,
Big Data, Cloud and Parallel Computing (COM-IT-
CON). IEEE, 1, 168-173.
Pudjihartono, N., Fadason, T., Kempa-Liehr, A.W., et al.,
2022. A review of feature selection methods for
machine learning-based disease risk prediction.
Frontiers in Bioinformatics, 2, 927312.
Sharma, A., Jeya, R., 2024. Prediction of insurance cost
through ML structured algorithm. In: 2024 IEEE
International Conference on Computing, Power and
Communication Technologies (IC2PCT). IEEE, 5, 495-
500.
Vijayalakshmi, V., Selvakumar, A., Panimalar, K., 2023.
Implementation of medical insurance price prediction
system using regression algorithms. In: 2023 5th
International Conference on Smart Systems and
Inventive Technology (ICSSIT). IEEE, 1529-1534.
Medical Cost Personal Datasets,
https://www.kaggle.com/datasets/mirichoi0218/insura
nce.
Biau, G., Scornet, E., 2016. A random forest guided tour.
Test, 25, 197-227.
Chen, T., Guestrin, C., 2016. XGBoost: A scalable tree
boosting system. In: Proceedings of the 22nd ACM
SIGKDD International Conference on Knowledge
Discovery and Data Mining, 785-794.
Jain, D., Singh, V., 2018. Feature selection and
classification systems for chronic disease prediction: A
review. Egyptian Informatics Journal, 19(3), 179-189.
ICDSE 2025 - The International Conference on Data Science and Engineering
580
