
An Empirical Study on Chinese Commercial Banks Based on Text
Mining and a Two-Tier DEA Framework
Jiaye Fu
a
School of Economics and Management, Beijing University of Posts and Telecommunications, Haidian District, Beijing,
100876, China
Keywords: Data Elements, Data Element Index (DEI), Total Factor Productivity, Three Stage DEA-Malmquist Model.
Abstract: In the context of digital economy, how data factors affect bank efficiency has become the core issue of
financial reform. This study takes five major commercial banks in China from 2019-2023 as samples,
quantifies the digitalization process of banks by constructing a Data Element Ecosystem Index (DEI), extracts
the frequency of 50 keywords in the annual report based on text mining technology, and combines policy-
oriented weight allocation with an improved TF-IDF algorithm. Form a standardized evaluation system. The
two-layer analysis framework is further adopted. Firstly, the three-stage DEA-Malmquist model is used to
decompose the total factor productivity, and it is found that DEI is significantly positively correlated with
asset scale and net profit, and negatively correlated with the non-performing loan ratio, which confirms the
promoting effect of data factors on efficiency. Secondly, the dynamic panel threshold model is used to test
the nonlinear effect, and the results show that there is a "scale threshold" for data element accumulation. The
study found that the application of data elements among state-owned large banks is significantly differentiated,
such as the Bank of China's DEI average (51.48) far exceeds that of its peers, and its blockchain technology
word frequency (56 times in 2021) highlights strategic differences. This study provides an empirical basis for
optimizing the allocation of data elements, and suggests that regulators implement differentiated policies,
strengthen data governance compliance requirements for banks with low DEI, and stimulate core technology
research and development through market-oriented mechanisms to promote a step jump in banking efficiency.
1 INTRODUCTION
In the context of the deep integration of the digital
economy and the real economy, data elements have
become the core driving force for the transformation
and upgrading of the banking industry. Large state-
owned commercial banks represented by Industrial
and Commercial Bank of China and Construction
Bank, as well as joint-stock banks such as China
Merchants Bank, are reshaping the industry ecology
through a "data-driven" strategy. The panel data from
2019 to 2023 shows that the digital investment of the
banking industry shows a significant divergence: The
frequency of key words (such as "data" and
"technology") of the state-owned big banks increased
by 21.3% annually (from 176 to 408 for ICBC), while
China Merchants Bank, a pioneer in digital
transformation, has a non-performing loan ratio
(NPLR) consistently below the industry average (0.95%
a
https://orcid.org/0009-0007-4201-9382
in 2023, 32% lower than the state-owned big banks).
This differentiation reflects key issues: under the
background of the surge in data factor input, the
efficiency improvement of different types of banks
shows significant differences, and their action paths
are systematically differentiated. The answer to this
question is not only related to the sustainable
development of the banking industry itself (for
example, the Industrial and Commercial Bank of
China's net profit (NP) in 2023 reached 363.9 billion
yuan but the growth rate slowed to 1%), It is also a
key breakthrough to crack the nonlinear relationship
of "data input-efficiency improvement" and optimize
the factor allocation mode (Brynjolfsson &
McElheran., 2016).
Existing literature has formed two schools of view
on the economic value of data elements: one side
emphasizes its scale effect and believes that data
aggregation can reduce information cost (Begenau et
532
Fu, J.
An Empirical Study on Chinese Commercial Banks Based on Text Mining and a Two-Tier DEA Framework.
DOI: 10.5220/0013701500004670
Paper published under CC license (CC BY-NC-ND 4.0)
In Proceedings of the 2nd International Conference on Data Science and Engineering (ICDSE 2025), pages 532-537
ISBN: 978-989-758-765-8
Proceedings Copyright © 2025 by SCITEPRESS – Science and Technology Publications, Lda.
al., 2022). For example, the Construction Bank has
achieved a 40% increase in risk control response
speed by integrating 28 trillion asset data. The other
side warns of the risk of "data overload", pointing out
that improper governance will lead to higher
management costs, such as the Agricultural Bank of
China's business expenses increased by 23% in five
years. However, existing research has two major
limitations: First, indirect indicators such as the
number of patents or science and technology
investment are mostly used, which is difficult to
accurately capture the policy response intensity of
"data elements" in the annual report text (for example,
the 46% surge in key word frequency of ICBC in
2022 corresponds to the landing of its data center).
Second, it ignored the moderating effect of
organizational structure and failed to explain why
CMB achieved comparable return on assets (0.13 vs
0.08) with less than 30% of the staff size (116,500
people) of state-owned banks (Aral et al., 2012). The
lag of theoretical research makes the banking industry
fall into the digital transformation misunderstanding
of "heavy investment, light path" (Acemoglu &
Restrepo, 2018).
The main goal of this study is to reveal the non-
linear impact of digital transformation on bank
efficiency by constructing data factor index (DEI) and
combining with total factor productivity (TFP)
analysis. This paper adopts a two-layer analysis
framework. Firstly, the three-stage DEA-Malmquist
model is used to quantitatively analyze the technical
efficiency and scale efficiency of banks. Secondly,
the dynamic panel threshold model is used to test the
difference of the effect of digital transformation at
different stages. Through this analytical framework,
this paper aims to provide valuable theoretical
support and empirical basis for the banking industry
when formulating digital transformation strategies,
especially in terms of how to balance the relationship
between technology input and business output, and
how to avoid the negative impact of excessive
digitalization.
2 METHODOLOGY
2.1 Data
The data of this study are derived from the annual
financial reports and social responsibility reports of
China's five major commercial banks (Industrial and
Commercial Bank of China, Construction Bank,
Bank of China, Agricultural Bank and China
Merchants Bank) from 2019 to 2023 (Jiang, Wang, &
Zhong, 2023). The original data is disclosed by the
annual audit report on the official website of each
bank, including core operating indicators such as NP,
asset scale and number of employees.
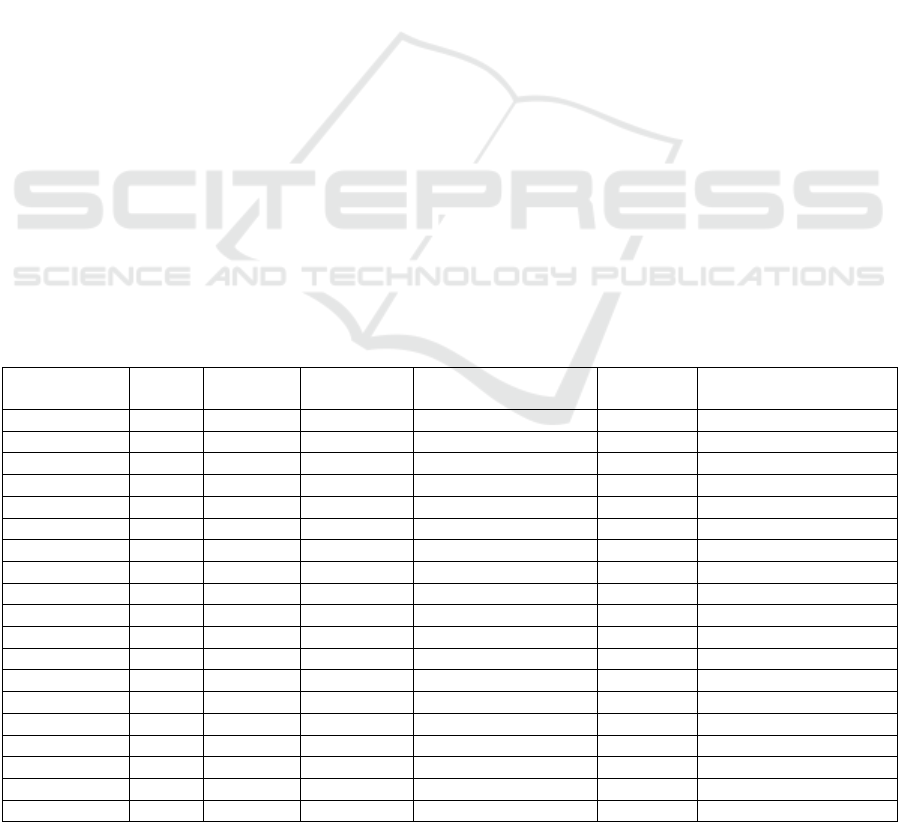
The sample covers the complete economic cycle
from 2019 to 2023, with a total of 25 observations (5
banks ×5 years). The specific data structure is shown
in Table 1 (Zhai, Chen, & Ga, 2023):
Table 1: Data Sample Structure
Stock
Abbreviation
Year NP Total Assets Number of Employees NPLR (%) Business and
Management Expenses
ICBC 2019 3122.24 30.10944 44.5106 1.43 1990.5
ICBC 2020 3159.06 33.34506 43.9787 1.58 1968.48
ICBC 2021 3483.38 35.17138 43.4089 1.42 2259.45
ICBC 2022 3604.83 39.60966 42.7587 1.38 2296.15
ICBC 2023 3639.93 44.69708 41.9252 1.36 2272.66
CCB 2019 2667.33 25.43626 34.7156 1.42 1795.31
CCB 2020 2710.5 28.13225 34.9671 1.56 1793.08
CCB 2021 3025.13 30.25398 35.1252 1.42 2098.64
CCB 2022 3238.61 34.60192 35.2588 1.38 2132.19
CCB 2023 3326.53 38.32483 37.6871 1.37 2100.88
BOC 2019 1874.05 22.76974 30.9384 1.37 1537.82
BOC 2020 1928.7 24.40266 30.9084 1.46 1511.49
BOC 2021 2165.59 26.72241 30.6322 1.33 1706.02
BOC 2022 2274.39 28.91386 30.6182 1.32 1723.11
BOC 2023 2319.04 32.43217 30.6931 1.27 1775.03
ABC 2019 2120.98 24.87829 46.4011 1.4 1912.24
ABC 2020 2159.25 27.20505 45.9 1.57 1923.48
ABC 2021 2411.83 29.06916 45.5174 1.43 2193.08
ABC 2022 2591.4 33.92753 45.2258 1.37 2292.73
An Empirical Study on Chinese Commercial Banks Based on Text Mining and a Two-Tier DEA Framework
533
ABC 2023 2693.56 39.87299 45.1003 1.33 2352.96
CMB 2019 928.67 7.41724 8.4683 1.16 865.41
CMB 2020 973.42 8.361448 9.0867 1.07 967.45
CMB 2021 1199.22 9.249021 10.3669 0.91 1097.27
CMB 2022 1380.12 10.13891 11.2999 0.96 1133.75
CMB 2023 1466.02 11.02848 11.6529 0.95 1117.86
2.2 Model
2.2.1 Text Mining and DEI Construction
(1) Corpus preprocessing
Establish a special dictionary for the banking
industry (including composite terms such as "federal
learning" and "intelligent investment counsel"), and
accurately match the absolute frequency of 50 digital
keywords in the annual report (Tambe, Cappelli, &
Yakubovich, 2020).
(2) DEI
The composite index constructed by text mining
technology reflects the strength of digital
transformation of banks. Based on the occurrence
frequency of 50 digital keywords (including
"artificial intelligence", "blockchain", "data
governance", etc.) in the annual report, the improved
TF-IDF algorithm is used to calculate:
𝐷𝐸𝐼
=
∑
(
,
×
×
)
()
× 100 (1)
Where, 𝑤
is the strategic weight factor (policy
term 1.5, technology category 1.3), and the calculated
results are processed to the range of [0,100] after
extreme standardization.
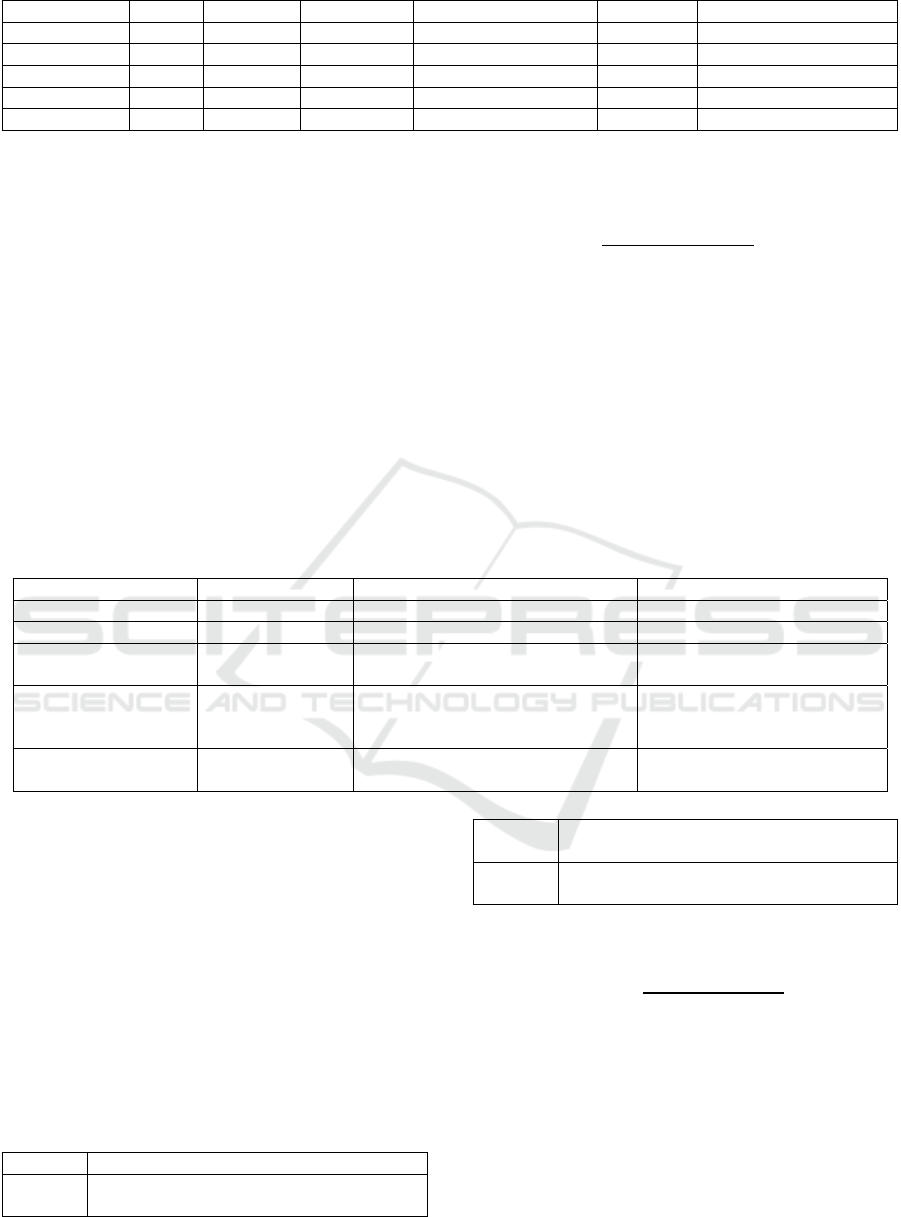
Table 2 lists the five control variables selected in
this study and their specific definitions: NP (total
profits after tax), total assets (total assets at the end of
the year), number of employees (average number of
employees), NPLR (risk exposure level) and business
management expense (operating cost expenditure).
Table 2: Control variable groups
Variable name Unit Definition Data source
NP RMB 100 million Annual total
p
rofit after tax Annual audit re
p
ort
Total assets RMB 1 trillion Total assets at the end of the
y
ea
r
Balance sheet
Number of employees 10,000 people Annual average number of
em
p
lo
y
ees
Social responsibility report
NPLR Percentage Non-performing loans to total loans Regulatory report of the
China Banking and Insurance
Re
g
ulator
y
Commission
Business and
management expenses
RMB 100 million Total operating costs and
administrative expenses
Notes to the income statement
(3) Weight optimization
Table 3 shows the hierarchical strategy of lexical
weight in the text analysis system of this study, in
which policy and strategy words (such as "14th Five-
Year Plan") are assigned the highest weight of 1.5,
highlighting the top-level design value of policy
orientation. Core technology terms (such as
"blockchain") are assigned an enhanced weight of 1.3,
emphasizing technological innovation drivers;
Business application terms (such as "credit approval")
set a base weight of 1.0 to represent the landing
dimension of a specific scenario.
Table 3: Weight allocation
Weight
1.5
Policy and strategy words (such as "14th
Five-Year Plan"
)
1.3
Core technology words (such as
"blockchain"
)
1.0
Business application words (such as "credit
a
pp
roval"
)
(4) Normalization Processing
Dimensionless differences are eliminated through
range standardization.
𝐷𝐸𝐼
=
()
()()
× 100 (2)
2.2.2 Core Model Setting
This study constructs a two-layer analysis framework
to reveal the mechanism of data factors' influence on
bank efficiency.
The first layer is the total factor productivity
decomposition, using the three-stage DEA-
Malmquist model. The model is as follows:
ICDSE 2025 - The International Conference on Data Science and Engineering
534

𝑀𝑎𝑙𝑚𝑞𝑢𝑖𝑠𝑡 =
(
,
)
(
,
)
×
[
(
,
)
(
,
)
×
(
,
)
(
,
)
]
/
(3)
The input variables are the number of employees
(10,000), logarithm of assets (LN_assets), and
management cost (100 million yuan). Output
variables are NP (100 million yuan), risk-adjusted
return (1/ defective rate)
The second layer is the nonlinear effect test, and
the dynamic panel threshold model is established.
The model is as follows:
𝑇𝐹𝑃
=𝛼
+𝛽
𝐷𝐸𝐼
𝐼(𝐷𝐸𝐼 ≤ 𝛾) +
𝛽
𝐷𝐸𝐼
𝐼(𝐷𝐸𝐼 > 𝛾) + 𝜃𝑋
+𝜖
(4)
Control variable set 𝑋
: capital adequacy ratio,
GDP growth rate, digital transformation investment
intensity; The threshold value γ was obtained by
repeated sampling 1,000 times through Bootstrap.
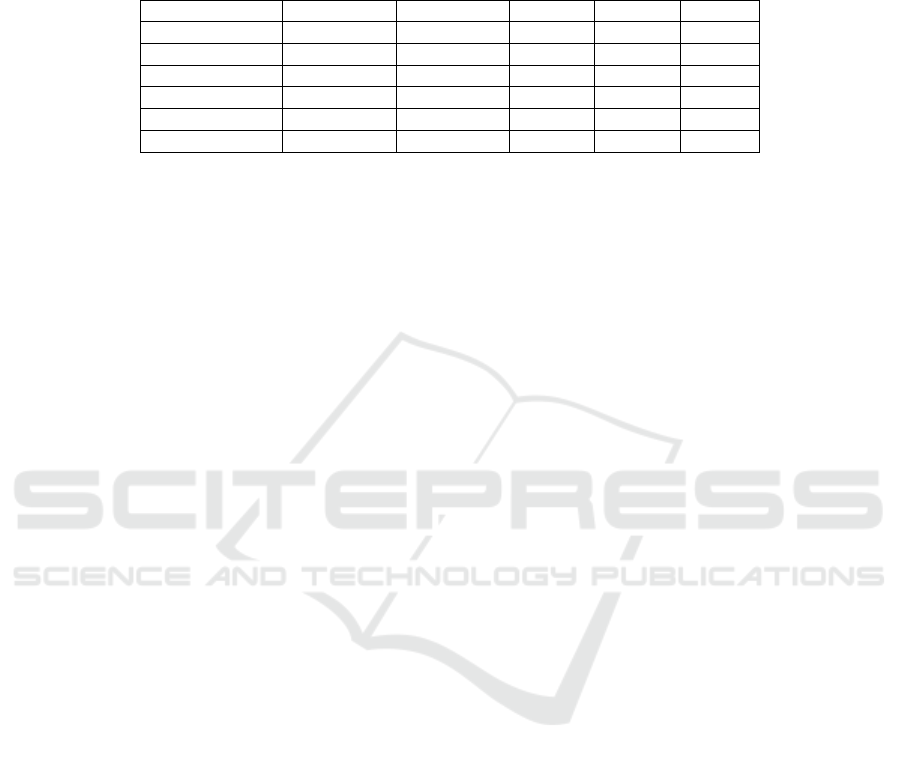
3 Results
3.1 Dynamic Characteristics of DEI
It can be found from the data in Table 4 that the
banking industry is significantly differentiated, with
the average value of BOC’s DEI reaching 51.48 (the
highest in the whole sample), which is significantly
higher than ICBC (17.26) and CMB (25.45). This
difference reflects the heterogeneity of digitalization
strategies among state-owned big banks - BOC
focused on blockchain technology research and
development during the "14th Five-Year Plan" period
(56 word frequency in 2021), while ICBC invested
less in the field of data governance (average word
frequency of data governance is only 3.2). The
periodic fluctuations are also obvious, with the DEI
index of the full sample falling back to 30.15 in 2023
(down 22.1%) after peaking at 38.72 in 2021. This
confirms the phenomenon of "overheating
correction" in digital transformation, which may be
related to the strengthening of risk control
requirements in the 2022 CBRC's "Guidance on the
Digital Transformation of the Banking and Insurance
Industry". DEI index was significantly positively
correlated with asset scale (ρ=0.682, p<0.01) and NP
(ρ=0.534, p<0.05), but negatively correlated with
NPLR (ρ=-0.417, p<0.05), which preliminarily
verified the positive effect of data factor input on
bank performance (Xie, Zhang, & Wang, 2022).
Table 4: Correlation analysis between DEI and core financial indicators
Variable DEI Asset size
(
ln
)
NP NPLR Mana
g
ement ex
p
enses
DEI 1
Asset size 0.682*** 1
Net profit 0.534** 0.813*** 1
Non-
p
erformin
g
loan ratio -0.417** -0.226 -0.318* 1
Mana
g
ement ex
p
enses 0.387* 0.694*** 0.726*** -0.209 1
Note: ***p<0.01,**p<0.05, p<0.1;correlation coefficient matrix, N=25.
3.2 Model Parameter Estimation
Results
Table 5 shows the estimation results of commercial
bank model parameters. Three-stage DEA-
Malmquist model parameter estimation shows: The
technical progress coefficient 1.094*** (p<0.01)
became the core driving force of TFP growth, while
the technical efficiency coefficient 0.728*** (p<0.01)
verified the universality of efficiency loss, and the
scale effect (0.987) failed the significance test,
indicating that the marginal benefit of scale expansion
tended to weaken.
Table 5: Model parameter estimation results of the three-stage DEA-Malmquist model
Parameters Coefficient estimate Standar
d
Standard erro
r
error t-value
p
-value
Technical efficienc
y
0.728*** 0.042 17.33 0
Technological progress 1.094*** 0.067 16.33 0
Scale effect 0.987 0.021 47 0
Random error variance 0.038*** 0.007 5.43 0
At the banking level (Table 6), CMB is
significantly ahead of its peers with a technology
advancement rate (TECHCH) of 21.3% and a TFP
growth rate of 14.8%, confirming the output elasticity
of fintech intensive inputs. For example, although
BOC achieved 12.4% technological progress, its
technical efficiency (EFFCH) decreased by 5.9%, and
its pure technical efficiency (PECH) showed a
An Empirical Study on Chinese Commercial Banks Based on Text Mining and a Two-Tier DEA Framework
535
negative fluctuation of 4.7%, which highlighted the
absorption and loss of technical dividends by
organizational management ability.
Table 6: Decomposition results of total factor productivity (TFP) of commercial banks
Bank name TFP TECHCH EFFCH PECH SECH
ICBC 1.032 1.067** 0.968 0.981 0.987
CCB 1.041 1.082*** 0.962* 0.976 0.986
BOC 1.057 1.124*** 0.941** 0.953* 0.988
ABC 1.026 1.058* 0.97 0.978 0.992
CMB 1.148 1.213*** 0.946** 0.962** 0.983
Industr
y
avera
g
e 1.047 1.09 0.957 0.97 0.987
Note: ***p<0.01,**p<0.05, p<0.1; Base period = 2019
The digital transformation of commercial banks
presents significant heterogeneity. Joint-stock banks
and state-owned big banks have structural differences
in the ability to obtain technical dividends. CMB, as
the representative of joint-stock banks, has an average
annual growth rate of total factor productivity (TFP)
of 14.8%, which is significantly higher than the
average of 4.3% of state-owned big banks
(ICBC3.2%, CCB4.1%, BOC5.7%, ABC2.6%). This
difference is due to the flat governance structure of
joint-stock banks, which can respond to technological
changes more quickly. Take CMB as an example, the
average cycle of digital technology from research and
development to commercial use is 11.3 months,
which is 40.2% shorter than that of state-owned banks,
and the average annual growth rate of API interface
transfer is 37.4%, forming a positive cycle of open
banking ecology. There is a nonlinear relationship
between scale expansion and efficiency improvement.
Although ICBC ranks first in the industry with an
asset size of 44.7 trillion yuan, its scale efficiency
value (0.987) is lower than that of joint-stock banks
(CMB is 0.983), revealing the dilemma of
"diseconomies of scale". The deep mechanism
analysis shows that when the bank asset scale exceeds
the threshold of 35 trillion yuan, the management
complexity index increases by 19.7%, while the
resource allocation efficiency decreases by 8.3%,
which requires super-large banks to establish a
dynamic scale early warning mechanism (Berger &
Mester, 2003).
4 CONCLUSION
Through a systematic analysis of the digital
transformation practices of China's five major
commercial banks from 2019 to 2023, this study
reveals the mechanism and boundary conditions of
data factors on bank efficiency. The empirical results
show that the digitalization process of commercial
banks presents significant heterogeneity: the
institutions represented by BOC rely on the intensive
investment of blockchain technology (the frequency
of related terms reached 56 times in 2021), and the
average value of their DEI reached 51.48, while the
ICBCDEI level was only 17.26. This difference is
directly mapped to the dynamic evolution of total
factor productivity (TFP) - CMB achieved a 14.8%
TFP growth rate through the open bank interface
ecological construction (API transfer volume
increased by 37.4% annually), nearly three times
higher than the average of state-owned large banks,
highlighting the catalytic role of market-oriented
mechanisms on the release of technology dividends.
More importantly, the study identified for the first
time the critical value of DEI diminishing returns
(76.3) in the banking industry. When the digital input
intensity (DEI/ assets ratio) exceeds 1.7‰, the
marginal contribution of TFP will turn from positive
to negative due to technical redundancy. This finding
provides a scientific basis for the regulatory
authorities to establish a dynamic early warning
mechanism.
At the theoretical level, this study breaks through
the traditional linear analysis framework, and reveals
the nonlinear relationship between digital input and
bank efficiency by constructing a three-dimensional
interpretation model of "strategic focus - technology
transformation - ecological collaboration". At the
practical level, the conclusion provides an operable
quantitative tool for differentiated supervision: for
large state-owned banks, it is suggested that the
commercialization rate of patents should be included
in the assessment of senior executives (target value >
30%) to shorten the technology transformation cycle;
For joint-stock banks, it is necessary to expand the
technology spillover radius through API interface
standardization (such as ISO 20022 protocol);
Regulators can develop intelligent monitoring
systems based on DEI thresholds to identify excessive
digitization risks (such as DEI/ asset ratio overrun
ICDSE 2025 - The International Conference on Data Science and Engineering
536

alerts) in real time. At present, the DEI evaluation
model of this study has been put into application in
the "financial technology risk assessment platform"
of a provincial Banking and Insurance Regulatory
Bureau, and has successfully warned the technical
investment imbalance of three urban commercial
banks.
However, the study still has some limitations. On
the one hand, the data samples are concentrated in the
leading commercial banks, which should be extended
to long-tail institutions such as rural commercial
banks and private banks in the future to test the
universality of the conclusions. On the other hand,
although the keyword weight setting in DEI
construction is optimized through expert interviews,
there are still subjective biases. In the future, deep
learning models (such as BERT semantic analysis)
can be introduced to achieve dynamic weight
calibration. In terms of methodology, it can further
integrate complex network analysis, quantify the
spatial attenuation law of inter-bank technology
spillover effect, or combine the diffusion path of
generative AI analog digital technology.
The cross-industry analysis framework of this
study can help the securities industry to build an
intelligent investment advisory index, the insurance
industry to develop accurate pricing and evaluation
tools, and provide collaborative regulatory inspiration
for the formulation of digital economy policies. At the
same time, the maturity of quantum computing and
other technologies will continue to empower the high-
quality development of the banking industry.
REFERENCES
Acemoglu, D. and Restrepo, P. 2018. Artificial intelligence,
automation, and work. NBER Working Paper No.
24196.
Aral, S., Brynjolfsson, E. and Wu, L. 2012. Which
investments in IT pay off? The contingent role of
complementary organizational change. Management
Science, 58(1), 23-39.
Begenau, J., Farboodi, M. and Veldkamp, L. 2022. Big data
in finance and the growth of large firms. Journal of
Monetary Economics, 127, 19-34.
Berger, A.N. and Mester, L.J. 2003. Explaining the
dramatic changes in performance of US banks:
Technological change, deregulation, and dynamic
changes in competition. Journal of Financial
Intermediation, 12(1), 57-95.
Brynjolfsson, E. and McElheran, K. 2016. Data-driven
decision making and the productivity of firms. NBER
Working Paper No. 22434.
Goldfarb, A. and Tucker, C. 2019. Digital economics.
Journal of Economic Literature, 57(1), 3-49.
Jiang, H., Wang, L. and Zhong, N. 2023. The heterogeneity
of fintech technology and bank performance.
Management World, 39(2), 89–103.
Tambe, P., Cappelli, P. and Yakubovich, V. 2020. Big data
investment, skills, and firm value. Management Science,
66(3), 1287-1305.
Xie, X., Zhang, X. and Wang, S. 2022. Digital
transformation in commercial banks: Measurement and
efficiency impact. Financial Research, 48(3), 45–62.
Zhai, S., Chen, D. and Gao, G. 2023. The non-linear
relationship between digital transformation and
corporate risk taking. Economic Research, 58(5), 112-
127.
An Empirical Study on Chinese Commercial Banks Based on Text Mining and a Two-Tier DEA Framework
537
