
Vehicle Detection and Tracking Based on YOLOv11
Haoran Gao
a
Intelligence Science and Technology, School of Information Science and Engineering, Shenyang Ligong University,
Shenyang Liaoning Province China
Keywords: YOLOv11, Vehicle Detection, Tracking Algorithms.
Abstract: Since its initial proposal in 2015, the You Only Look Once (YOLO) series of object detection algorithms has
rapidly become a popular research direction in real-time object detection due to its efficient single-inference
mechanism. YOLO divides the image into grids and simultaneously predicts bounding boxes and class
probabilities in a single forward pass, achieving rapid detection. The series has continuously optimized from
YOLOv1 to the latest YOLOv11, enhancing feature extraction capabilities, multi-scale perception abilities,
and detection accuracy. This paper explores the application of the YOLOv11 algorithm and advanced tracking
models (ByteTrack and BoTSORT) in traffic monitoring systems. Ultimately, YOLOv11 achieved a mAP50
of 0.806 and a mAP50-95 of 0.501; precision reached 1.0 under a confidence level of 0.988 and a recall rate
of 68.8% when the confidence threshold was 0, with a final frame rate of 63fps. The ByteTrack and BoTSORT
tracking algorithms ensured stability and accuracy in tracking through multi-stage data association and
trajectory management.
1 INTRODUCTION
Traffic monitoring systems play a crucial role in
modern urban management and traffic planning, with
accurate and real-time vehicle detection and tracking
key to efficient traffic management. In recent years,
the rapid development of deep learning technology,
especially breakthroughs in object detection and
tracking, has brought greater convenience to traffic
systems. With its efficient single-stage detection
framework, the You Only Look Once (YOLO) series
algorithm has become essential in computer vision.
This study is dedicated to the application of
YOLOv11 in vehicle detection for traffic monitoring
systems (Khanam & Hussain, 2024). As the latest
version of the YOLO series, YOLOv11 has
significantly improved detection speed and accuracy
compared to its predecessors through improved
network structures and training strategies. Its
introduction of attention mechanisms and fine-
grained feature extraction capabilities make it
perform well in dynamic traffic environments,
especially in terms of robustness to small object
detection and complex backgrounds (Wang et al.,
2022).
a
https://orcid.org/0009-0006-8772-4969
To further improve the stability and reliability of
vehicle tracking, this study integrates advanced
tracking algorithms ByteTrack(Wang & Mariano,
2024) and BoTSORT (Aharon et al., 2022).
ByteTrack is a tracking-by-detection algorithm that
predicts bounding boxes and uses Intersection over
Union (IoU) and confidence scores for target
matching. It is particularly good at handling occlusion
issues. BoTSORT combines ReID technology and
uses a two-stage data association strategy to
effectively reduce the problem of target loss and false
matches, especially in dense target scenarios (Yang et
al., 2024).
The main objective of this study is to evaluate the
performance of YOLOv11 in detecting vehicles
under different road conditions and compare the
effectiveness of ByteTrack and BoTSORT in
maintaining accurate and stable tracking.
The experimental results indicate that YOLOv11
is superior to its predecessors in terms of detection
speed and accuracy and can process traffic
monitoring video streams in real-time. ByteTrack and
BoTSORT each have advantages in tracking
performance: ByteTrack excels in handling low-score
frames and occlusion scenarios, while BoTSORT
Gao, H.
Vehicle Detection and Tracking Based on YOLOv11.
DOI: 10.5220/0013699700004670
Paper published under CC license (CC BY-NC-ND 4.0)
In Proceedings of the 2nd International Conference on Data Science and Engineering (ICDSE 2025), pages 481-486
ISBN: 978-989-758-765-8
Proceedings Copyright © 2025 by SCITEPRESS – Science and Technology Publications, Lda.
481

significantly reduces ID switching through its ReID
module, enhancing tracking accuracy.
This study's findings provide crucial insights for
the development of more efficient traffic monitoring
systems. By leveraging YOLOv11's powerful
detection capabilities and advanced tracking
algorithms, traffic monitoring systems can better
achieve traffic flow analysis, accident prevention, and
intelligent traffic management.
2 DATASET AND MODELS
2.1 Page Setup
To assess the performance of YOLOv11 and tracking
algorithms, this paper collects data from various
highway and urban roads. The dataset used in this
paper includes 10,870 images of the target objects.
There are four categories of objects: "car," "bus,"
"van," and "others." Each image includes at least two
categories, which can increase the model's accuracy.
This paper sets 80% of all images as the training
set and 20% as the test set. The model training
parameters set the batch value to 4, the total number
of training rounds to 100, the image size to 640,
disabled multi-thread loading, and enabled image
caching.
2.2 Model
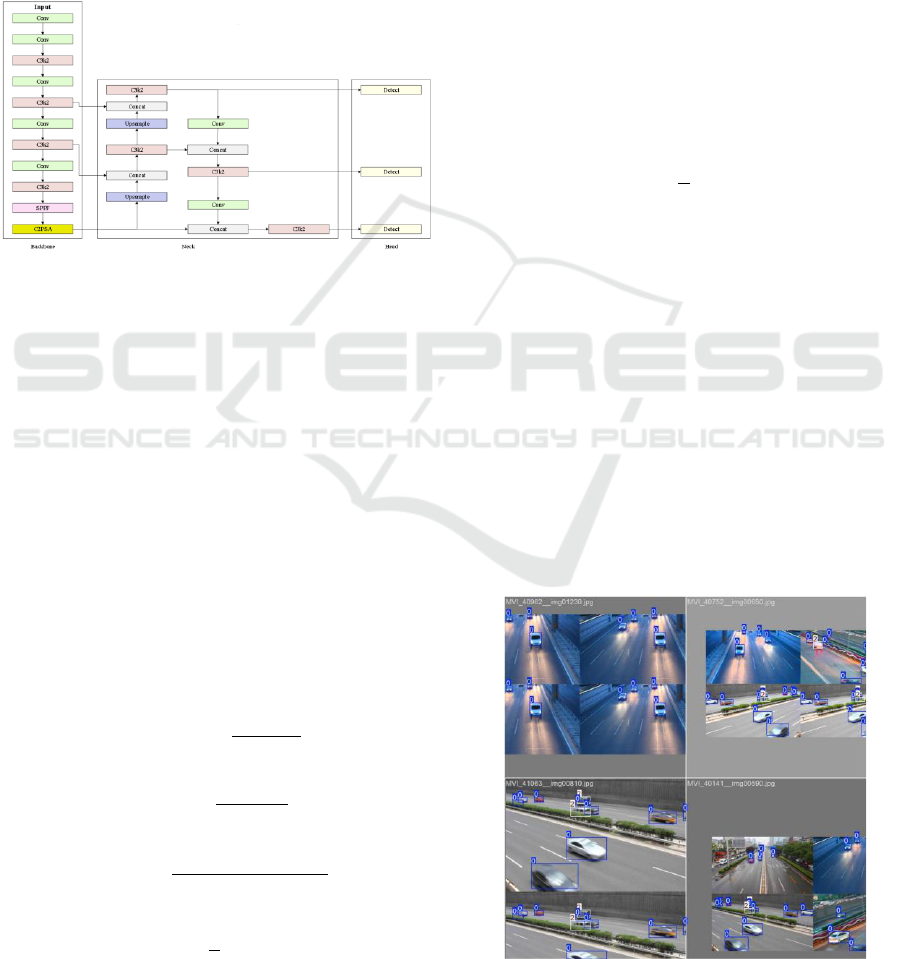
The network architecture of YOLO11 (as shown
in Figure 1) fully reflects the balance of efficiency
and accuracy. Its core components include the basic
leading trunk network (Backbone), the connection
layer network (Neck), and the detection module
(Head). First, the input image is processed by the
Backbone (leading trunk network) through a series of
convolutional layers (Conv) and C3k2 modules to
extract image features (Alif, 2024). The C3k2 module,
as an efficient convolutional block, can effectively
extract multi-scale features while reducing
computational redundancy. This is different from the
main trunk network design of YOLOv5 (Zhang et al.,
2022) and YOLOv8(Talaat & ZainEldin, 2023):
YOLOv5 uses CSPDarknet53 (Mahasin & Dewi,
2022) as the leading trunk network, and the core
module is the C3 module, while YOLOv8 introduces
the C2f module to further lightweight the network
structure. YOLO11 optimizes on this basis, using the
C3k2 module instead of C2f to further improve
computational efficiency.
Next, the feature map enters the Convolutional
Block with the Spatial Attention (CBSA) module,
which integrates the spatial attention mechanism and
can dynamically adjust the importance of different
regions in the feature map, thereby enhancing the
feature representation capability. This design does not
explicitly appear in YOLOv5 and YOLOv8;
YOLOv5 mainly relies on the Focus module for
feature extraction, while YOLOv8 introduces
depthwise separable convolution and dilated
convolution to optimize feature extraction efficiency.
YOLO11 further strengthens feature representation
capabilities through the CBSA module, giving it an
advantage in complex scenarios.
Then, the feature map enters the Neck, whose
main task is to process further and fuse the features
extracted by the Backbone to detect targets of
different scales better. In the Neck stage, the feature
map is processed through multiple C3k2 modules and
convolutional layers, and the resolution is increased
through Upsample operations to restore detailed
information. In addition, the feature maps are fused
between different levels through Concat operations,
which can effectively combine low-level detail
information and high-level semantic information.
Compared with YOLOv5 and YOLOv8, YOLOv5
uses PANET (Hussain, 2024) for feature fusion. At
the same time, YOLOv8 optimizes the PANet
structure, removes the convolutional structure in the
upsampling stage, and introduces the SPPF module
for multi-scale feature fusion. YOLO11 adds the
C2PSA module behind the SPPF module to further
enhance feature extraction capabilities, making it
perform better in multi-scale target detection (Jooshin
et al., 2024).
Finally, the feature map processed by the Neck is
sent to the Head (detection module), responsible for
outputting the final detection results. The detection
module includes multiple parallel detection layers,
each responsible for detecting targets of different
scales to adapt to diverse targets in complex scenarios.
Each detection layer contains a C3k2 module to
process the feature map further and then outputs the
detection results through the Detect layer, including
the category and location of the target. Compared
with YOLOv5 and YOLOv8, YOLOv5 adopts an
Anchor-Based design, while YOLOv8 introduces an
Anchor-Free design and uses a Decoupled Head to
handle classification and regression tasks separately.
YOLO11 further optimizes the detection head,
introduces depthwise separable convolution to reduce
redundant calculations, and significantly improves
accuracy.
The entire network architecture is designed to
extract rich features through the Backbone, fuse
multi-scale features through the Neck, and perform
ICDSE 2025 - The International Conference on Data Science and Engineering
482
accurate target detection through the Head, thereby
achieving efficient and accurate target detection. This
layered design improves detection efficiency and
enhances the model's adaptability to complex
scenarios, enabling it to meet better the dual
requirements of real-time and accuracy in practical
applications. Compared with YOLOv5 and YOLOv8,
YOLO11 has reached new heights in detection
accuracy, computational efficiency, and multi-task
support capabilities, providing a more powerful tool
for real-time target detection tasks.
Figure 1: Model structure. (Picture credit: Original)
3 EXPERIMENTAL RESULTS
The experiments were conducted on the Win11
system, using Pytorch: 1.10.0 and Python 3.8.5 as
environments. While testing the effectiveness of
YOLO11 detection, the tracking function was also
evaluated
3.1 Evaluation indicators
The evaluation indicators used in this experiment
include precision, recall, and F1 score mean average
precision(MAP). The calculation formulas for
accuracy, recall, and F1 indicators are shown in
formulas (1), (2), (3), and (4).
TP represents a correct detection: the number of
correctly classified bounding box coordinates in the
predicted result box. FP stands for error detection,
which refers to the number of classification errors or
incorrect bounding box coordinates in the predicted
bounding box, that is, the number of incorrectly
predicted bounding boxes. The recall rate is the
ability of a model to find all relevant targets, that is,
how many real targets can be covered by the predicted
results. When the F1 score is imbalanced between
accuracy and recall, it can be used as a comprehensive
evaluation indicator. When it is between 0 and 1, the
closer the value is to 1, the better the model
performance. MAP refers to the mean of the highest
accuracy at different recall rates, where n is the
number of categories and is the average accuracy of
the i-th category.
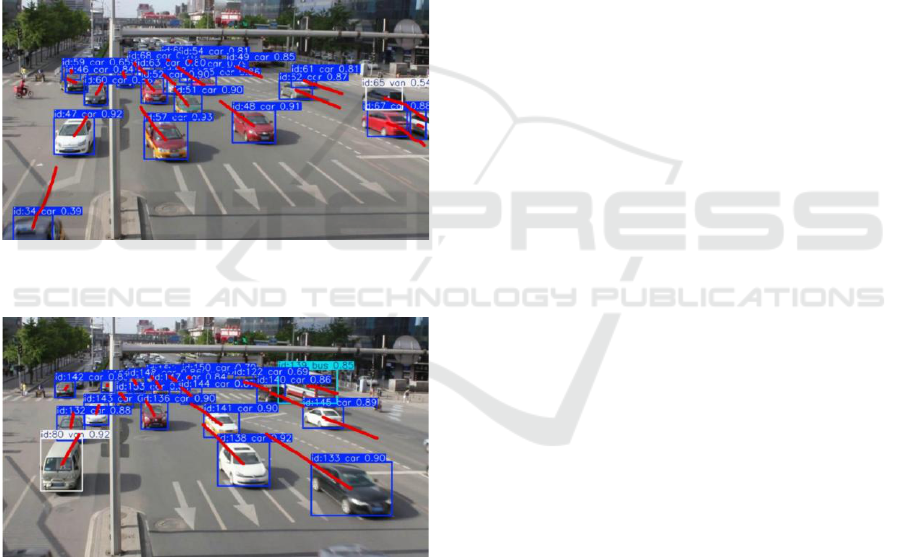
3.2 Data Enhancement
Figure 2 illustrates how the dataset undergoes data
augmentation. For example, in the image
demonstrated below, mosaic data stitching was
performed, which significantly increased the
diversity of the dataset by stitching four different
pictures into a new image. This method enables the
model to learn features of multiple scenes and targets
from a single training sample, thereby improving the
model's understanding of complex scenes. Along
with color changes and random image flipping, the
model's adaptability to directional changes and
robustness to color changes have been improved,
thereby achieving data augmentation.
Figure 2: Data enhancement. (Picture credit: Original)
Vehicle Detection and Tracking Based on YOLOv11
483
3.3 Tracking Algorithms
Regarding vehicle target tracking, ByteTrack and
BoTSORT have characteristics and advantages (as
shown in Figures 3 and 4). The ByteTrack algorithm
is favored for its fast processing speed, which enables
it to run in near real-time, which is crucial for vehicle
tracking applications that require rapid response.
However, BoTSORT performs better in accuracy,
especially in scenarios involving REID (Re-
identification) and new tracker associations, where
BoTSORT's effectiveness is higher. In addition,
BoTSORT adopts the selection of appearance feature
extractors in its feature fusion strategy, using the
ResNeSt50 backbone model, which makes it more
effective in capturing subtle differences between
vehicles in multi-target tracking (MOT) tasks.
Figure 3: Bytetrack tracking configuration. (Picture credit:
Original)
Figure 4: Bot-Sort tracking configuration. (Picture credit:
Original)
3.4 Results
Figures 5, 6, and 7 show several key indicators of the
YOLO training process that can be used to evaluate
the model's performance during the training period.
In the analysis of loss functions and performance
metrics for YOLOv5, YOLOv8, and YOLOv11
models, it can be observed that each version has been
optimized and improved during the training process.
In terms of training loss, all models showed a gradual
decrease in bounding box loss (box-loss) with
increasing training epochs, indicating that the models
are learning more accurate bounding box predictions.
YOLOv11 has a smoother downward trend, making
its optimization algorithm more stable. In
classification loss (cls_loss), all three versions have
reduced losses, but YOLOv8 has a faster decline rate
than YOLOv5, while YOLOv11 further improves
this metric. In addition, the unique distributed
aggregation loss (dfl_loss) of YOLOv11 suggests that
it may have better optimization in bounding box
localization, which YOLOv5 and YOLOv8 do not
possess.
In terms of Validation Loss, although all models
have some fluctuations, YOLOv11 has more minor
fluctuations, which may indicate an improvement in
its generalization ability. Performance metric analysis
shows that the precision and recall of all models
improve with training, but YOLOv11 shows a more
significant improvement with more minor
fluctuations, indicating better performance in
detection accuracy and coverage. Regarding average
accuracy (MAP), whether MAP@0.5 or MAP@0.5-
0.95, YOLOv11 shows a better improvement trend,
indicating better adaptability under different IoU
thresholds.
From the perspective of model optimization and
improvement, YOLOv11, as the latest version, has
innovated in the design of the loss function by
introducing dfl_loss to optimize bounding box
localization. At the same time, it has shown better
performance in accuracy, recall, and average
accuracy, indicating that YOLOv11 has effectively
optimized the model structure and training strategy.
In contrast, although YOLOv8 has been optimized in
some aspects, such as improving the speed of
reducing classification loss, there is still room for
improvement in verifying the loss volatility, and
further adjustments may be needed to enhance
stability. As an earlier version, YOLOv5 has
relatively weak performance in various indicators,
especially in terms of the fluctuation of validation
loss and the improvement of average accuracy,
reflecting the model's limitations in generalization
ability and detection accuracy. YOLOv11 has
demonstrated significant advantages in model
performance thanks to its continuous improvement
and innovation in model design and training strategies.
By analyzing the chart, it can also be inferred that
the current model may be overfitting, as the validation
loss no longer decreases after a certain number of
rounds, possibly due to the uneven distribution of
vehicle types in the dataset.
ICDSE 2025 - The International Conference on Data Science and Engineering
484
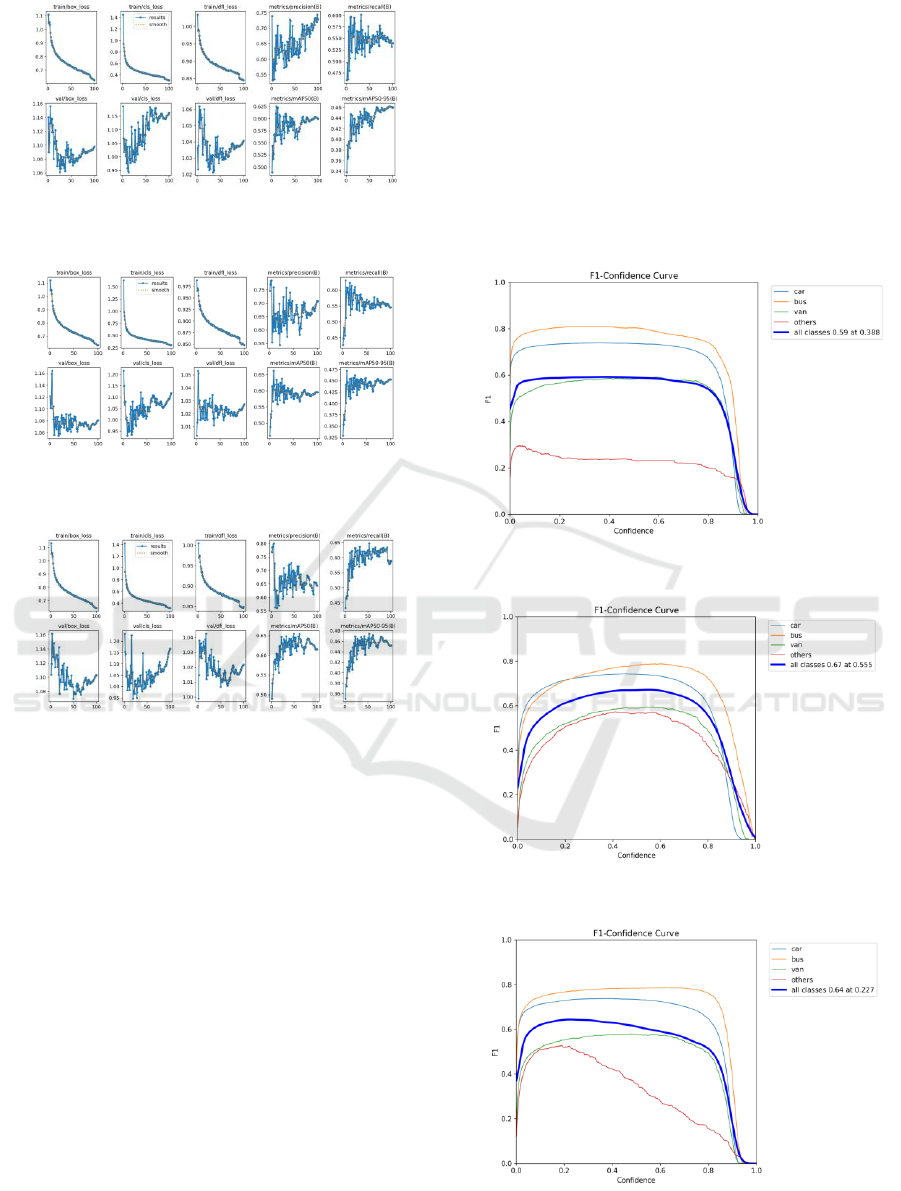
Figure 5: YOLO11 Model performance evaluation. (Picture
credit: Original)
Fugure 6: YOLOv8 Model performance evaluation.
(Picture credit: Original)
Figure 7: YOLOv5 Model performance evaluation. (Picture
credit: Original)
By comparing the F1 Confidence curves of
YOLOv5, YOLOv8, and YOLOv11 (as shown in
Figures 8, 9, and 10), the following conclusion can be
drawn: in terms of overall performance, YOLOv8
leads with an average F1 score of 0.67, YOLOv5
closely follows with 0.64, and YOLOv11 ranks third
with a score of 0.59. The comparison of various
categories shows that the bus category performs well
in all models, with YOLOv8 particularly outstanding.
In contrast, the truck category performs well in the
medium confidence range but decreases slightly at
high confidence levels. For the "other" category, all
models have higher F1 scores at low confidence but
rapidly decrease as confidence increases, indicating
poor recognition performance of the models for these
categories at high confidence. Regarding confidence
threshold selection, YOLOv8 achieves the best
average F1 score at higher confidence thresholds,
while YOLOv5 and YOLOv11 achieve the best
scores at lower confidence thresholds. Future
improvement directions can focus on improving the
model's generalization ability, reducing performance
differences between categories, and optimizing the
selection of confidence thresholds further to enhance
the practical application effectiveness of the model.
Although YOLOv8 performs the best in overall
average F1 scores, YOLOv11 still performs well in
specific categories, while YOLOv5 performs slightly
better than the other two models. These analysis
results provide valuable references for further
optimization of the model.
Figure 8: YOLO11 F1score. (Picture credit: Original)
Figure 9: YOLOv8 F1score. (Picture credit: Original)
Figure10: YOLOv5 F1score. (Picture credit: Original)
Vehicle Detection and Tracking Based on YOLOv11
485

4 CONCLUSIONS
We hope you find the information in this template
useful in the preparation of your submission.This
article delves into applying the YOLOv11 algorithm
and advanced tracking models ByteTrack and
BoTSORT in traffic monitoring systems, focusing on
vehicle detection and tracking performance. Through
experimental comparison, we evaluated the
performance of YOLOv11 in detecting vehicles
under different road conditions and compared the
effectiveness of ByteTrack and BoTSORT in
maintaining accurate and stable tracking.
The experimental results show that YOLOv11 is
superior to its predecessor in terms of detection speed
and accuracy and can process traffic monitoring video
streams in real time. Regarding tracking performance,
ByteTrack and BoTSORT each have advantages:
ByteTrack performs well in low frame processing and
occlusion scenes, while BoTSORT significantly
reduces ID switching and improves tracking accuracy
through the ReID module. This indicates that by
combining YOLOv11's powerful detection
capabilities and advanced tracking algorithms, traffic
monitoring systems can better achieve traffic flow
analysis, accident prevention, and intelligent traffic
management.
In addition, by analyzing the F1 Confidence
curves of YOLOv5, YOLOv8, and YOLOv11, we
can conclude that YOLOv8 performs the best overall,
followed by YOLOv5, while YOLOv11 performs
better in certain categories. These analysis results
provide valuable references for further optimization
of the model, pointing out the importance of
improving the model's generalization ability,
reducing performance differences between categories,
and optimizing the selection of confidence thresholds.
This study not only demonstrates the potential
application of YOLOv11 and its tracking algorithm in
traffic monitoring but also provides important
technical support for the development of future
intelligent transportation systems. Through
continuous model optimization and algorithm
innovation, we can expect further improvements in
the accuracy, real-time performance, and stability of
traffic monitoring systems, making greater
contributions to modern urban management and
traffic planning.
REFERENCES
Aharon, N., Orfaig, R., & Bobrovsky, B. Z. (2022). Bot-
sort: Robust associations multi-pedestrian tracking.
arXiv preprint arXiv:2206.14651.
Alif, M. A. R. (2024). Yolov11 for vehicle detection:
Advancements, performance, and applications in
intelligent transportation systems. arXiv preprint
arXiv:2410.22898.
Hussain, M. (2024). Yolov5, yolov8 and yolov10: The go-
to detectors for real-time vision. arXiv preprint
arXiv:2407.02988.
Jooshin, H. K., Nangir, M., & Seyedarabi, H. (2024).
Inception‐YOLO: Computational cost and accuracy
improvement of the YOLOv5 model based on
employing modified CSP, SPPF, and inception
modules. IET Image Processing, 18(8), 1985-1999.
Khanam, R., & Hussain, M. (2024). Yolov11: An overview
of the key architectural enhancements. arXiv preprint
arXiv:2410.17725.
Mahasin, M., & Dewi, I. A. (2022). Comparison of
CSPDarkNet53, CSPResNeXt-50, and EfficientNet-B0
backbones on YOLO v4 as object detector.
International Journal of Engineering, Science and
Information Technology, 2(3), 64-72.
Talaat, F. M., & ZainEldin, H. (2023). An improved fire
detection approach based on YOLO-v8 for smart cities.
Neural Computing and Applications, 35(28), 20939-
20954.
Wang Lingmin, Duan Jun, & Xin Liwei. (2022). YOLOv5
helmet wearing detection method with attention
mechanism. Journal of Computer Engineering &
Applications, 58(9).
Wang, Y., & Mariano, V. Y. (2024). A Multi Object
Tracking Framework Based on YOLOv8s and
Bytetrack Algorithm. IEEE Access.
Yang, M., Huang, J., & Huang, R. (2024). Cross-Camera
Multi-Target Vehicle Tracking.
Zhang, Y., Guo, Z., Wu, J., Tian, Y., Tang, H., & Guo, X.
(2022). Real-time vehicle detection based on improved
YOLOv5. Sustainability, 14(19), 12274.
ICDSE 2025 - The International Conference on Data Science and Engineering
486
