
Evaluating Machine Learning Strategies for Credit Risk Anomaly
Detection
Chenxi Hu
a
Shenzhen Audencia Financial Technology Institute, Shenzhen University, Shenzhen, China
Keywords: Credit Risk Classification, Class imbalance, PCA, Cost-Sensitive Learning, Machine Learning Model.
Abstract: This study addresses class imbalance in credit risk classification and optimizes model performance. One-hot
encoding was applied during data preprocessing, followed by an attempt at dimensionality reduction using
Principal Component Analysis (PCA), although PCA led to poorer results. Cost-Sensitive Learning (CSL)
was used to handle class imbalance. Five machine learning models were evaluated, and results showed that
Support Vector Classifier (SVC) and Logistic Regression performed best in ROC-AUC and F1-Score,
effectively balancing precision and recall. XGBoost achieved the highest recall but had lower precision,
resulting in a lower F1-Score. Random Forest and Neural Networks displayed balanced performance but did
not outperform SVC and Logistic Regression, making SVC and Logistic Regression the recommended models
for credit risk classification. Regarding PCA, the results showed it did not significantly improve model
performance. While some models, such as Neural Networks, showed slight improvements in ROC-AUC and
F1-Score, PCA generally led to a decrease in precision and recall, failing to enhance performance. CSL
improved recall significantly but reduced precision and accuracy. The study mitigated this by optimizing
feature weights, achieving higher recall with minimal precision loss, offering a balanced solution for high-
recall scenarios.
1 INTRODUCTION
Anomaly detection is a critical application in machine
learning, aiming to identify potential abnormal
behaviors from predominantly normal data (Guyon &
Elisseeff, 2003). With advancements in technology
and the exponential growth of data, anomaly
detection has become indispensable across various
industries, particularly in finance, where it plays a
pivotal role in mitigating risks (Hild & Torkkola,
2006). According to a report by the World Bank, the
prevalence of credit anomalies has remained
alarmingly high globally since the 21st century, with
developing countries experiencing disproportionately
higher rates compared to developed nations (Song &
Mei, 2010). This persistent issue undermines
economic stability, underscoring the urgency of
effective credit risk anomaly detection systems in
contemporary society.
However, credit risk anomaly detection faces
significant challenges. First, traditional anomaly
detection methods predominantly rely on binary
a
https://orcid.org/0009-0003-3960-0548
classification models that assume balanced datasets
(Uğuz, 2011). In reality, credit risks are often
concentrated within minority groups, leading to a
severe class imbalance where "bad" credit cases (e.g.,
defaults) are vastly outnumbered by "good" cases
(Rousseeuw & Van Driessen, 1999). This imbalance
hinders traditional models from accurately
identifying high-risk samples, resulting in suboptimal
recall rates. Second, conventional evaluation metrics,
such as overall accuracy, are ill-suited for imbalanced
credit risk tasks. As highlighted by (Chandola,
Banerjee, & Kumar, 2009), standard metrics fail to
prioritize the detection of truly risky minority-class
samples, which is the primary objective in practical
scenarios. Finally, the era of big data demands
scalable and precise methods to process massive
financial datasets efficiently (World Bank, 2021).
Existing approaches often struggle to balance
computational efficiency with detection accuracy,
necessitating innovative solutions.
The contributions of this study are summarized as
follows: First, this study explores the effectiveness of
436
Hu, C.
Evaluating Machine Learning Strategies for Credit Risk Anomaly Detection.
DOI: 10.5220/0013699000004670
Paper published under CC license (CC BY-NC-ND 4.0)
In Proceedings of the 2nd International Conference on Data Science and Engineering (ICDSE 2025), pages 436-441
ISBN: 978-989-758-765-8
Proceedings Copyright © 2025 by SCITEPRESS – Science and Technology Publications, Lda.

Cost-Sensitive Learning (CSL) in handling
imbalanced datasets. Second, it investigates high-
performance models suitable for this task, focusing
on identifying those that provide the best results.
Third, the study attempts to reduce feature
dimensionality through PCA, although the results
show that PCA did not optimize the outcome. Finally,
the study optimizes the model by focusing on the
most important features, mitigating the issues caused
by CSL (which significantly improves recall but
usually lowers precision). Through detailed
experiments and research, this work aims to provide
more accurate, efficient, and reliable solutions for
credit risk anomaly detection, offering robust
technical support for risk management in the financial
industry.
2 LITERATURE REVIEW
As a core topic in financial risk management, the
development of credit risk anomaly detection
demonstrates a trend of integrating traditional
statistical methods with modern machine learning
innovations (He & Garcia, 2009). Early credit risk
modeling relied on logistic regression (Mandour &
Chi, 2024), while subsequent advancements
introduced support vector machines (SVM) (Almajid,
2021), random forests (Alam, Shaukat, & Hussain,
2020), and gradient boosting (Fernández et al., 2018).
Despite these advancements, challenges persist in
handling high-dimensional data and mitigating
overfitting, driving innovations in feature engineering
and model optimization.
Feature selection techniques have evolved
significantly. Early work by references (Arora &
Kaur, 2020) emphasized statistical correlation
analysis for dimensionality reduction, later extended
by references (Meinshausen & Bühlmann, 2010)
through domain knowledge integration.
Dimensionality reduction methods such as principal
component analysis (PCA) (Lundberg & Lee, 2017)
address multicollinearity by reconstructing features,
while mutual information and SHAP values ()
optimize feature weighting by quantifying variable
contributions (Altman, 1968; Brown & Mues, 2012).
Traditional statistical approaches, including the
Mahalanobis distance, coexist with machine learning
models like one-class SVM, which expanded
anomaly detection capabilities. Hybrid frameworks
combining gradient boosting with statistical methods
further enhance risk identification reliability
(Fernández et al., 2018).
Recent research highlights system-level integration
of feature engineering, anomaly detection, and model
optimization. For instance, interpretable techniques
like SHAP values balance model performance with
transparency, enabling dynamic risk monitoring that
prioritizes both accuracy and interpretability. These
developments underscore the necessity of holistic
frameworks to overcome the limitations of isolated
methodologies.
3 DATASET AND
METHODOLOGY
3.1 Dataset
The Statlog German Credit Data set is a well-known
dataset in credit risk analysis, containing data from
1,000 individuals, with 20 features and a binary class
label indicating whether the individual is classified as
a "good" or "bad" credit risk. The dataset includes
both numerical and categorical features, such as
credit history, loan purpose, age, employment status,
and housing situation. The goal is to predict the credit
class label based on these features, assess credit risk,
and identify potential financial defaults. The class
distribution is imbalanced, with a ratio of
approximately 3:7 between bad and good credit risks,
presenting a challenge for machine learning models.
Preprocessing techniques, such as feature encoding
and balancing methods, are typically used to improve
model performance. The dataset is widely used in
research for anomaly detection, classification, and
model interpretability, providing a valuable
benchmark for evaluating and comparing different
machine learning algorithms.
3.2 Main Flowchart
Figure 1 shows the flowchart of this study. This work
will compare the performance of five models and
integrate these models to more reliably explore the
optimal features (the identified optimal features will
be used to mitigate the issues caused by CSL). In this
study, the data is processed using one-hot encoding,
resulting in a high-dimensional and sparse dataset.
Although dimensionality reduction through Principal
Component Analysis (PCA) could be intuitively
applied, its effectiveness may be limited. To improve
the model's practicality, specifically to increase
recall, CSL is introduced.
Evaluating Machine Learning Strategies for Credit Risk Anomaly Detection
437
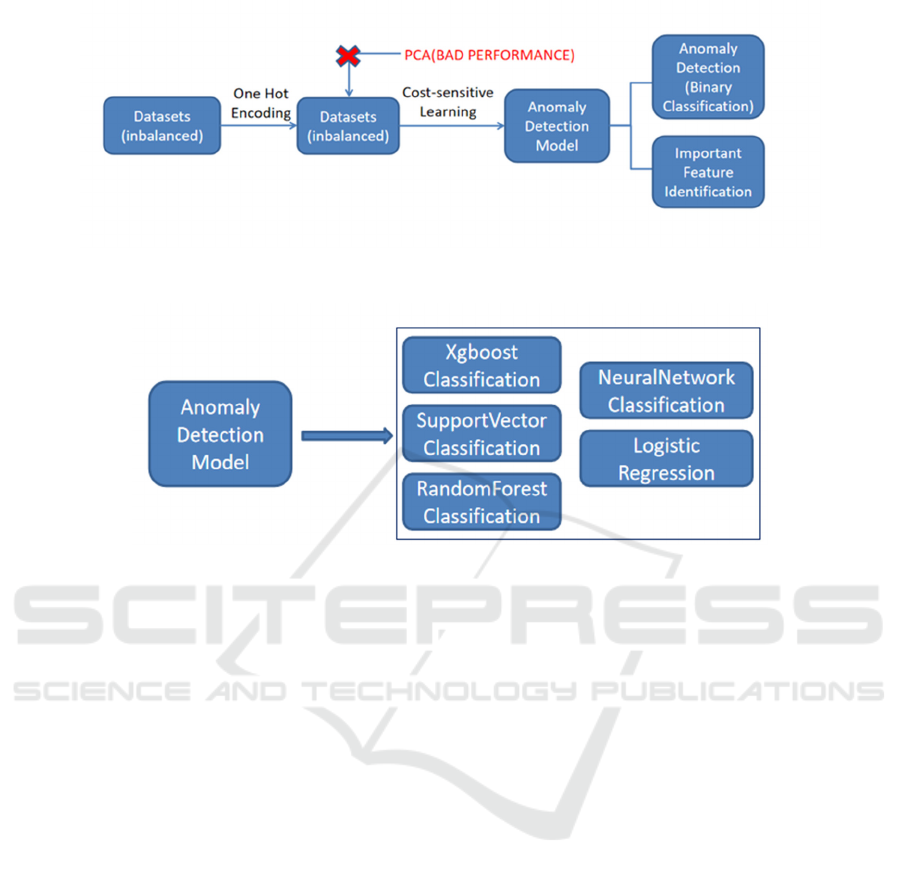
Figure1: CSL Model for Credit Risk Anomaly Detection and Key Feature Identification. (Picture credit: Original)
Figure 2: Multi-Model Analysis for Anomaly Detection: Performance Evaluation and Feature Identification. (Picture credit:
Original)
3.3 Important Feature Identification
Figure 2 displays the five machine learning models
used in this study. For integrating models to select
and weigh important features, the following method
is adopted: by training and evaluating multiple
machine learning models, the most important features
for credit risk prediction are identified. The
evaluation of feature importance relies not only on
model performance (such as AUC values) but also on
the frequency and weighted scores of features across
different models. The weighted score of a feature is
calculated based on its rank and weight in each
model, with the formula as follows:
Weight
RankWeight
1
Where Rank represents the importance order of
the feature within the model, and Weight reflects the
contribution of the model's performance (e.g., AUC
value) to the feature's importance. Using this method,
the people can identify features that frequently appear
in the top ranks across multiple models and have a
significant impact on prediction outcomes.
In this study, to enhance the impact of specific
features on model training, certain features deemed to
have significant predictive power in credit risk
prediction (boosted_features) were selected and
weighted. First, all features were standardized to
ensure they have the same scale, thus avoiding
unnecessary interference in model training due to
differences in feature scales. Next, the weighting was
applied based on the weights calculated in Equation
(1). By doing so, these boosted features take on a
larger proportion in the training process, encouraging
the model to place more emphasis on their role in the
prediction.
4 RESULT
4.1 Performance of Different Models
From Table 1, in the credit risk classification task,
each model has its own advantages in other
evaluation indicators. Among them, SVC and
Logistic Regression performed well in ROC-AUC
and F1-Score, reaching ROC-AUC of 0.8074 and
0.8015 respectively, indicating that they have a strong
ability to distinguish positive and negative samples.
At the same time, the F1-Score of Logistic Regression
is 0.662, while that of SVC is 0.6569, indicating that
ICDSE 2025 - The International Conference on Data Science and Engineering
438

these two models have good performance in
balancing precision and recall.
Table 1: Performance comparison of various models on different metrics.
Model Accurac
y
ROC-AUC F1-Score Precision Recall
XGBoost 0.725 0.7557 0.6605 0.5213 0.8305
SVC 0.765 0.8074 0.6569 0.5844 0.75
Random Forest 0.75 0.7961 0.6154 0.5714 0.6667
Neural Networ
k
0.72 0.7762 0.6316 0.5217 0.8
Logistic Regression 0.76 0.8015 0.662 0.5732 0.7833
Table 2: Feature importance analysis based on frequency, average rank, and weighted score.
Feature Frequenc
y
Average Ran
k
Weighted Score (Rank × Weight)
A14 1.0 1.25 4.5
A21 0.5 2.0 4.6
A51 0.5 3.0 7.5
A11 0.5 4.0 10.0
A35 0.5 5.0 11.5
Table 3: Comparison of Logistic Regression performance with and without feature importance.
Model Accurac
y
ROC-AUC F1 Precision Recall
Logistic Regression
Logistic Regression (Feature Importance)
0.7600
0.7550
0.8015
0.8079
0.6620
0.6629
0.5732
0.5679
0.7833
0.8333
XGBoost performs best in the recall, which is
0.8305 and is suitable for scenarios that pay more
attention to recall in abnormal sample detection, but
its precision is relatively low (0.5213), resulting in a
low F1-Score (0.6605). The comprehensive
performance of random forest and neural network is
relatively balanced, but neither exceeds SVC and
Logistic Regression in any indicator. Therefore, in
this experiment, SVC and Logistic Regression have
more advantages in comprehensive performance and
are recommended choices for credit risk classification
problems.
4.2 Identification and Optimization of
Important Features
4.2.1 Identification of Important Features
The analysis of feature importance revealed that both
qualitative and numerical attributes play a significant
role in credit risk classification. From Table 2, A14
(No Checking Account) emerged as the most
influential, highlighting the importance of a
customer’s existing financial account status.
Additionally, A21 (Duration in Months) and A51
(Credit Amount) demonstrated the relevance of
numerical attributes in assessing creditworthiness.
Furthermore, qualitative features such as A11
(Status of Existing Checking Account) and A35
(Purpose) were identified as key contributors,
indicating that both financial history and the purpose
of credit requests significantly impact model
predictions. These findings underscore the necessity
of incorporating a diverse set of features to effectively
predict credit risk and provide meaningful insights
into customer behavior.
4.2.1 Optimization Based on Important
Features
The optimization results in Table 3 show that by
assigning higher weights to important features, the
problem of a sharp drop in precision when improving
recall is successfully alleviated. In the optimized
model, the recall rate is significantly increased from
0.7833 to 0.8333, while the precision rate only
slightly decreases from 0.5732 to 0.5679, which is a
small drop. This shows that although increasing the
recall rate usually leads to a significant drop in
precision, by optimizing the weight distribution of
important features, the loss of precision can be
controlled within a lower range while ensuring the
increase in recall, thereby better balancing the two.
Evaluating Machine Learning Strategies for Credit Risk Anomaly Detection
439

Table 4: Model Performance Without PCA.
Model Accurac
y
ROC-AUC F1-Score Precision Recall
XGBoost 0.7800 0.7109 0.5926 0.7447 0.5932
SVC 0.7850 0.7930 0.5981 0.6667 0.5424
Random Forest 0.7950 0.8175 0.5591 0.7647 0.4407
Neural Networ
k
0.8150 0.8051 0.6838 0.6897 0.6780
Logistic Regression 0.8000 0.8180 0.6364 0.6863 0.5932
Table 5: Model Performance With PCA.
Model Accurac
y
ROC-AUC F1-Score Precision Recall
XGBoost 0.7350↓ 0.6839↓ 0.5546↓ 0.5500↓ 0.6093↑
SVC 0.7200↓ 0.7595↓ 0.4167↓ 0.5405↓ 0.3390↓
Random Forest 0.7050↓ 0.7285↓ 0.4486↓ 0.5000↓ 0.4068↓
Neural Networ
k
0.7650↓ 0.8115↑ 0.6843↑ 0.6207↓ 0.6102↓
Lo
g
istic Re
g
ression 0.7100↓ 0.7763↓ 0.4630↓ 0.5102↓ 0.4237↓
Table 6: Model Performance Without CSL.
Model Accurac
y
ROC-AUC F1-Score Precision Recall
XGBoost 0.7800 0.7109 0.5926 0.7447 0.5932
SVC 0.7850 0.7930 0.5981 0.6667 0.5424
Random Forest 0.7950 0.8175 0.5591 0.7647 0.4407
Neural Networ
k
0.8150 0.8051 0.6838 0.6897 0.6780
Lo
g
istic Re
g
ression 0.8000 0.8180 0.6364 0.6863 0.5932
Table 7: Model Performance With CSL.
Model Accurac
y
ROC-AUC F1-Score Precision Recall
XGBoost 0.7250↓ 0.7557↑ 0.6605↑ 0.5213↓ 0.8305↑
SVC 0.7650↓ 0.8074↑ 0.6569↑ 0.5844↓ 0.7500↑
Random Forest 0.7500↓ 0.7961↓ 0.6154↑ 0.5714↓ 0.6667↑
Neural Networ
k
0.7200↓ 0.7762↓ 0.6316↓ 0.5217↓ 0.8000↑
Logistic Regression 0.7600↓ 0.8015↓ 0.6620↑ 0.5732↓ 0.7833↑
4.3 Ablation Experiment
4.3.1 Ablation of PCA
The application of PCA had a notable impact on
model performance (see Table 4,5). Across all
models, there was a general decline in accuracy,
precision, and F1-Score. However, some models,
such as Neural Networks, demonstrated a slight
improvement in ROC-AUC (0.8051 to 0.8115) and
F1-Score (0.6838 to 0.6843). Despite these minor
gains, the overall results indicate that PCA may not
be effective in enhancing model performance for this
specific task, as it often leads to reduced precision and
recall, which are critical metrics in credit risk
anomaly detection.
4.3.2 Ablation of CSL
The application of CSL significantly improved the
recall across all models, demonstrating its
effectiveness in addressing the class imbalance in the
credit risk anomaly detection task (Table 6,7). For
example, XGBoost achieved a recall improvement
from 0.5932 to 0.8305, and SVC saw a similar
increase from 0.5424 to 0.7500. However, this
improvement in recall often came at the expense of
precision and accuracy. The trade-off highlights the
importance of using CSL in scenarios where
identifying the minority class is critical, even if it
means accepting a slight reduction in precision.
5 CONCLUSIONS
Evaluation of the various models revealed distinct
strengths and weaknesses. Logistic Regression and
SVC demonstrated strong overall performance with
high ROC-AUC and a good balance of precision and
recall, making them suitable for general classification
tasks. XGBoost excelled in recall, effectively
identifying high-risk cases, but at the cost of lower
ICDSE 2025 - The International Conference on Data Science and Engineering
440

precision, leading to more false positives. Random
Forest performed well in feature importance analysis
but had lower recall, while Neural Networks provided
balanced performance across metrics, slightly inferior
to SVC and Logistic Regression in maintaining
precision-recall trade-offs.
The application of PCA in credit risk anomaly
detection caused significant information loss,
compromising critical feature relationships and
leading to declines in accuracy, F1-Score, and
precision. Although PCA aims to reduce
dimensionality and enhance efficiency, its use in this
context resulted in sub-optimal performance, failing
to achieve the desired optimization. In contrast, CSL
significantly improved recall across all models,
addressing the need to detect minority-class cases, but
at the expense of precision, resulting in increased
false positives.
A promising solution to these challenges lies in
optimizing the most important features identified
through multi-model integration. By leveraging the
strengths of various models to pinpoint key attributes,
this approach retains essential information and
reduces redundancy, enabling models to achieve a
better balance between recall and precision. This
strategy addresses the practical need for high recall
while mitigating the limitations posed by PCA and
CSL, offering a robust pathway for credit risk
anomaly detection.
REFERENCES
Alam, T. M., Shaukat, K., & Hussain, A. 2020. An
investigation of credit card default prediction in the
imbalanced datasets. IEEE Access, 8, 201270–201283.
Almajid, A. S. 2021. Multilayer perceptron optimization on
imbalanced data using SVM-SMOTE and one-hot
encoding for credit card default prediction. Expert
Systems with Applications, 185, 115642.
Altman, E. I. 1968. Financial ratios, discriminant analysis
and the prediction of corporate bankruptcy. The Journal
of Finance, 23(4), 589–609.
Arora, N., & Kaur, P. D. 2020. A Bolasso-based consistent
feature selection enabled random forest classification
algorithm: An application to credit risk assessment.
Applied Soft Computing, 86, 105936.
Brown, I., & Mues, C. 2012. An experimental comparison
of classification algorithms for imbalanced credit
scoring data sets. Expert Systems with Applications,
39(3), 3446–3453.
Chandola, V., Banerjee, A., & Kumar, V. 2009. Anomaly
detection: A survey. ACM Computing Surveys, 41(3),
1–58.
Fernández, A., García, S., Galar, M., Prati, R. C.,
Krawczyk, B., & Herrera, F. 2018. Learning from
imbalanced data sets (Vol. 10, No. 2018). Cham:
Springer.
Guyon, I., & Elisseeff, A. 2003. An introduction to variable
and feature selection. Journal of Machine Learning
Research, 3, 1157–1182.
He, H., & Garcia, E. A. 2009. Learning from imbalanced
data. IEEE Transactions on Knowledge and Data
Engineering, 21(9), 1263–1284.
Hild, K. E., Erdogmus, D., & Torkkola, K. 2006. Feature
extraction using information-theoretic learning. IEEE
Transactions on Neural Networks, 17(5), 1224–1235.
Lundberg, S. M., & Lee, S. I. 2017. A unified approach to
interpreting model predictions, Nov. arXiv preprint
arXiv:1705.07874.
Mandour, M. A., & Chi, G. 2024. A review study of AI
methods for credit default prediction. Journal of
Artificial Intelligence in Finance, 12(3), 45–67.
Meinshausen, N., & Bühlmann, P. 2010. Stability selection.
Journal of the Royal Statistical Society: Series B, 72(4),
417–473.
Rousseeuw, P. J., & Van Driessen, K. 1999. A fast
algorithm for the minimum covariance determinant
estimator. Technometrics, 41(3), 212–223.
Song, F., Guo, Z., & Mei, D. 2010. Feature selection using
principal component analysis. IEEE Transactions on
Pattern Analysis and Machine Intelligence, 32(3), 547–
561.
Uğuz, H. 2011. A two-stage feature selection method for
text categorization by using information gain, principal
component analysis and genetic algorithm. Expert
Systems with Applications, 38(7), 8747–8753.
World Bank. 2021. Global Financial Development Report
2021: Credit anomalies and economic stability. World
Bank Publications. Retrieved from
https://openknowledge.worldbank.org/handle/10986/3
5430
Evaluating Machine Learning Strategies for Credit Risk Anomaly Detection
441
