
Comparison of Feature Combinations on Simultaneous Prediction of
Stock Price and Volatility
Wenhan Lu
a
School of Management, Zhejiang University, Hangzhou, Zhejiang, China
Keywords: Multi-Target Prediction, Feature Combination, Random Forest, Lasso Regression, Mutual Information.
Abstract: Accurate prediction of stock prices and volatility is crucial for informed financial decision-making. However,
traditional models often focus on single-target forecasts, neglecting the connection between price movements
and volatility, which can limit predictive accuracy. Therefore, there is a need for more effective approaches
that can simultaneously predict both stock prices and volatility. This study proposes an innovative method to
address these challenges by using two target variables: the 5-day-ahead closing price and the 5-day high-low
price difference as a measure of volatility. Besides, the study applies three feature selection techniques—
Random Forest, Lasso Regression, and Mutual Information to identify the best features for predicting closing
prices, which are then used to forecast volatility. The results of this study, based on data from Amazon, Google,
and Microsoft over a 10-year period (2015-2025), show that Lasso Regression outperforms the other methods.
It achieved the lowest mean squared error (MSE) across all three companies (Amazon: 0.2485; Google:
0.0323; Microsoft: 5.1805) while maintaining high R² values (above 0.78). The findings highlight Lasso
Regression's ability to balance prediction accuracy and generalizability, offering a computationally efficient
method for multi-target prediction, which improves the practicality of multi-target models for financial
applications.
1 INTRODUCTION
Accurate prediction of stock prices and volatility
remains a critical challenge in financial markets, as
precise forecasting supports investment decisions,
risk management, and portfolio optimization (Shah,
Isah, & Zulkernine, 2019). Previous studies
demonstrate that stock price movements and
volatility are influenced by multiple factors, where
diverse feature characteristics create challenges for
achieving high prediction accuracy (Htun, Biehl, &
Petkov, 2023). Traditional models typically focus on
single-target predictions, often neglecting the
interconnected nature of price changes and volatility.
However, multi-target learning has shown the
potential to enhance accuracy through simultaneous
prediction of related variables. For example,
constrained random forest models have exhibited
robust performance across diverse datasets (Blitsi,
2024).
To address feature selection challenges impacting
prediction accuracy, researchers have developed
a
https://orcid.org/0009-0007-3434-7706
various effective methods. Random Forest has
emerged as a prominent technique due to its error
estimation capabilities, correlation analysis, and
feature importance scoring (Kursa et al., 2011;
Iranzad et al., 2024). Lasso regression demonstrates
superior performance through exact coefficient
shrinkage to zero (Jovi, Brki, & Bogunovi, 2015;
Muthukrishnan & Rohini, 2016). Mutual Information
(MI), an information theory-based method, measures
nonlinear dependencies between variables and
effectively identifies features with complex
relationships to targets, and examples of these
methods include the forward selection minimal-
redundancy-maximal-relevance (FSMRMR) and
conditional mutual information maximization
(CMIM) methods (Nguyen et al., 2014; Sun et al.,
2019) .
Comparative studies by Nabipour et al. evaluating
nine machine learning models and two deep learning
approaches confirm LSTM's effectiveness in
processing sequential financial data (Nabipour et al.,
2020; Ye, 2024).
430
Lu, W.
Comparison of Feature Combinations on Simultaneous Prediction of Stock Price and Volatility.
DOI: 10.5220/0013698900004670
Paper published under CC license (CC BY-NC-ND 4.0)
In Proceedings of the 2nd International Conference on Data Science and Engineering (ICDSE 2025), pages 430-435
ISBN: 978-989-758-765-8
Proceedings Copyright © 2025 by SCITEPRESS – Science and Technology Publications, Lda.

This study addresses these challenges by
proposing feature combinations for multi-target
prediction. This study analyzed ten years of stock data
(January 2015 - January 2025) for Amazon, Google,
and Microsoft from Yahoo Finance. Two target
variables are defined: 5-day-ahead closing price and
5-day high-low price differential (volatility proxy).
The methodology follows a sequential process:
Feature Selection for Price Prediction: Three methods
(Random Forest, Lasso Regression, Mutual
Information) identify optimal features for closing
price forecasting. Volatility Prediction: Selected
features from Step 1 are used as inputs for volatility
modeling. The objective of this research is to evaluate
4 different feature combinations for their
effectiveness in simultaneously predicting stock
prices and volatility five days into the future. The
ultimate goal is to identify the optimal feature
combination that yields the most accurate predictions.
2 METHODOLOGY
2.1 Data Description
In this study, stock data was collected from Yahoo for
3 companies including Amazon, Google, and
Microsoft. The time ranges for Amazon, Google and
Microsoft were from 2015.01.01 to 2025.01.01. Table
1 shows part of the dataset for the stock of Google.
Table 1: Part of the dataset for the stock of Google.
Date Open High Low Close Volume
2015/1/2 26.07496452 26.39592813 26.03968897 26.28363971 28951268
2015/1/5 25.53141403 26.05111498 25.49117052 25.99795174 41196796
2015/1/6 24.93967056 25.64593795 24.8944591 25.58755778 57998800
2015/1/7 24.89694405 25.20220556 24.82490104 25.19008214 41301082
2.2 Target Variables
In this study, two target variables were selected for
simultaneous prediction. The first target variable was
the stock closing price five days later, as it reflects the
final outcome of trading activity and provides a
clearer indication of market sentiment. The second
target variable was the price difference between the
highest and lowest prices observed over the same 5-
day period.
Traditional approaches to volatility prediction
typically use the standard deviation of the closing
price over a 5-day period as the target variable.
However, in this study, it was found that the standard
deviation of the closing price over a 5-day period
exhibits a high correlation with the closing price five
days later, which could lead to redundancy in a multi-
target prediction framework. Furthermore, while the
standard deviation is commonly used to measure
market volatility, it is a statistical measure with
relatively limited interpretability. In contrast, the
difference between the highest and lowest prices
offers a more intuitive and direct reflection of price
fluctuation. Therefore, the price difference between
the highest and lowest prices 5 days later was chosen
as the second target variable.
2.3 Feature Engineering
The features included fundamental stock attributes
and technical indicators. The fundamental stock
attributes included Open, Close, High, Low, Volume.
And technical indicators included Simple Moving
Average (SMA), Relative Strength Index (RSI),
Moving Average Convergence Divergence (MACD),
Average True Range (ATR), Chaikin Money Flow
(CMF), Rate of Change (ROC). A table is listed
below to show the calculation of indicators.
In Table 2, the abbreviations used are as follows:
Ct means the day close stock price at time t. Avg
(Gain) means the average day gain in period of 14
days. Avg (Loss) means the average day loss in the
period of 14 days.
Comparison of Feature Combinations on Simultaneous Prediction of Stock Price and Volatility
431

Table 2: Technical indicators and its formulas.
Technical Indicators Calculation and Descri
p
tion
Simple Moving Average (SMA5)
SMA
=
C
+C
+C
+C
+C
5
(
The avera
g
e of the closin
g
p
rices over the last 5 da
y
s
)
Relative Strength Index (RSI)
RSI = 100 −
100
1+
Avg(Gain)
Avg(Loss)
(
Measures the s
p
eed and ma
g
nitude of recent
p
rice chan
g
es over 14 da
y
s
)
Moving Average Convergence Diver-
gence (MACD)
MACD = EMA
−EMA
(Difference between the 12-day and 26-day exponential moving averages)
Average True Range (ATR)
ATR = Rolling Mean (14) (max (High-Low, High-Close, Low-Close))
(
Measures the volatilit
y
based on recent hi
g
h-low-close
p
rices over 14 da
y
s
)
Chaikin Money Flow (CMF)
CMF =
∑
(Money Flow Multiplier Volume)
Rolling Sum of Volume(30)
(
Indicates the bu
y
in
g
and sellin
g
p
ressure over 30 da
y
s
)
Rate of Change (ROC)
ROC =
C
−C
C
(
Measures the
p
ercenta
g
e chan
g
e in
p
rice over a 12-da
y
p
eriod
)
2.4 Feature Selection Methods
Since the closing price of a stock after 5 days was
generally of greater interest compared to its price
volatility over the same period, 3 feature selection
methods were applied to identify the most influential
feature sets for predicting the closing price in 5 days.
The selected feature combinations were then used to
forecast the stock's price volatility 5 days later.
In this study, 3 feature selection methods were
used to help choose feature combinations: Random
Forest, Lasso Regression, Mutual Information.
Random Forest was used to assess the importance
of each feature in predicting the stock price. The
features were then ranked in descending order
according to their importance, and the top 5 most
important features were selected.
Lasso Regression is a regularized linear regression
method that applies L1 regularization to penalize
large coefficients, driving some of them to zero,
thereby performing automatic feature selection. In
this study, Lasso Regression was used to select the
features most relevant for predicting stock price.
Features with non-zero coefficients were identified
and combined into a unified feature set.
Mutual Information was used to evaluate the
dependence between each feature and the stock price.
The features were then ranked in descending order
based on their mutual information scores, and the top
5 most relevant features were selected.
2.5 Test Method
The model’s performance is evaluated using Mean
Squared Error (MSE) and coefficient of
determination (R-squared value). In this study, the R-
squared value was required to exceed 0.65.
2.6 Training and Testing Data
Preparation
The entire dataset was standardized to ensure that all
features and target variables had a mean of 0 and a
standard deviation of 1. Subsequently, the dataset was
split into training and testing sets, with 80% of the
data used for training the model and the remaining
20% reserved for testing the model’s performance.
2.7 Prediction Model
Long Short-Term Memory (LSTM) is a specialized
recurrent neural network designed for processing time
series data. In this study, LSTM was employed as the
predictive model for stock volatility. The input to the
model was a time series tensor with a shape of
(number of samples, 10, number of features), where
each sample consisted of feature data from 10
consecutive days arranged in chronological order.
Firstly, all fundamental stock attributes and technical
indicators were included as input features, and the
LSTM model was used to predict stock volatility,
yielding the MSE and R-squared value. Subsequently,
3 feature selection methods were applied to identify 3
sets of features that had a significant impact on the
stock closing price after 5 days. Each selected feature
set was then used to construct a time series tensor as
input, and the LSTM model was utilized again to make
predictions, obtaining the corresponding MSE and R-
squared value. Figure 1 shows the stock prediction
process using Amazon's stock as an example.
ICDSE 2025 - The International Conference on Data Science and Engineering
432
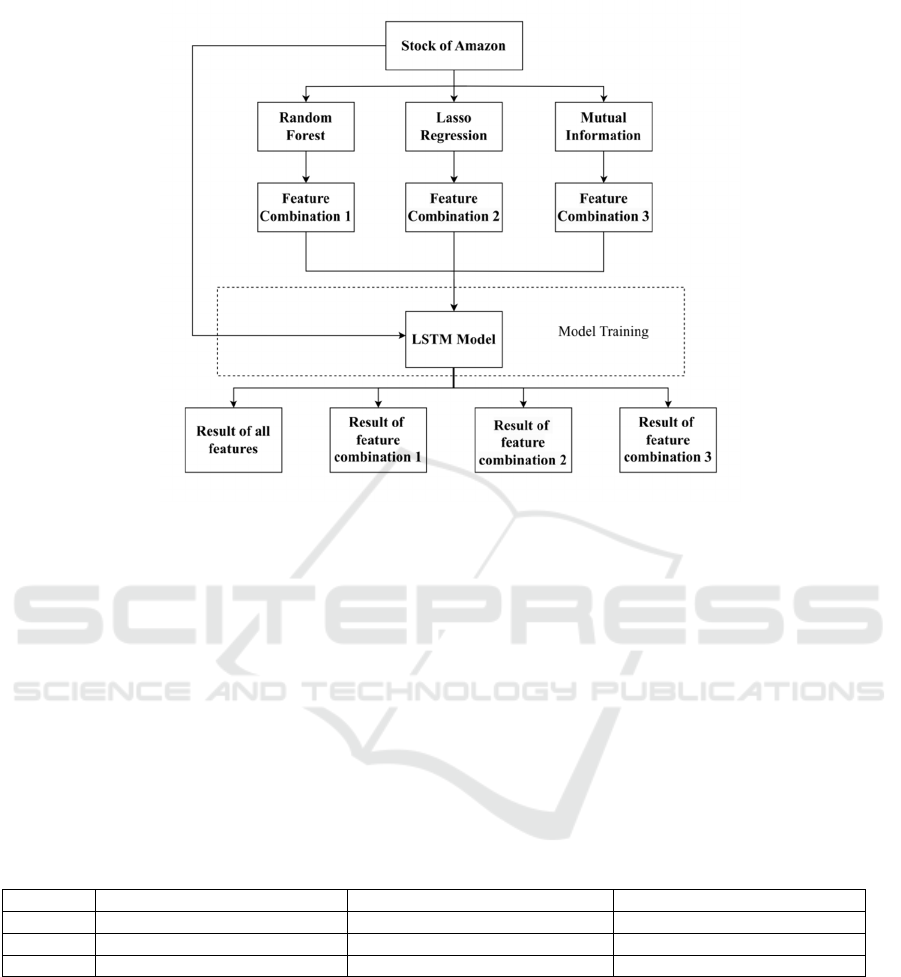
Figure 1: The Predictive Flowchart of Amazon Stock. (Picture credit: Original)
3 RESULT
Table 3 presents a clear comparison of the feature
combinations selected for Amazon, Google, and
Microsoft using different feature selection methods.
Both the Random Forest and Mutual Information
methods consistently identified the same set of
features for all 3 companies, namely Close, SMA5,
High, Low, and Open. In contrast, the Lasso
Regression method selected distinct feature sets
tailored to each company: Amazon was associated
with Open, Close, Volume, and MACD; Google with
Open, Close, RSI, MACD, ATR; and Microsoft with
Open, Close, MACD, CMF, and ROC. These findings
suggest that different feature selection techniques
exhibit notable variability in their selections. The
Random Forest and Mutual Information methods tend
to prioritize a consistent set of features across
different datasets, whereas the Lasso Regression
method appears to adapt feature selection based on the
specific characteristics and dynamics of each dataset.
Table 3: Feature Combinations for Different Companies.
Com
p
an
y
Random Forest Features Lasso Re
g
ression Features Mutual Information Features
Amazon Close, SMA
5
, High, Low, Open Open, Close, Volume, MACD Close, SMA
5
, High, Low, Open
Google Close, SMA
5
, High, Low, Open Open, Close, RSI, MACD, ATR Close, SMA
5
, High, Low, Open
Microsoft Close, SMA
5
, High, Low, Open Open, Close, MACD, CMF, ROC Close, SMA
5
, High, Low, Open
Since the Random Forest and Mutual Information
feature selection methods identified the exact same
set of features (Close, SMA5, High, Low, and Open)
across all 3 companies, their MSE and R
2
values were
identical, as shown in Table 4. In 3 companies, the
feature combinations chosen by Random Forest and
Mutual Information feature selection methods
achieved an R
2
value exceeding 0.98, indicating an
exceptionally high explanatory power. However, their
MSE values were significantly higher than those
obtained using other methods. In contrast, the the
feature combination chosen by Lasso Regression
feature selection method yielded the lowest MSE
values across all 3 companies (Amazon: 0.2485, R
2
=
0.9596; Google: 0.0323, R
2
= 0.9789; Microsoft:
5.1805, R
2
= 0.7833) Although the R
2
values of Lasso
Regression were slightly lower than those of the
Random Forest and Mutual Information methods,
they remained at a relatively high level. When all
features were included, the MSE and R
2
values fell
Comparison of Feature Combinations on Simultaneous Prediction of Stock Price and Volatility
433

between those of the two aforementioned methods
(Amazon: MSE = 7.3282, R
2
= 0.8589; Google: MSE
= 5.8935, R
2
= 0.8207; Microsoft: MSE = 5.2499, R
2
= 0.7804). In terms of predictive performance, while
the features chosen by Random Forest and Mutual
Information methods achieved the highest model fit,
their prediction errors were notably larger. In contrast,
Lasso Regression effectively maintained high
explanatory power while significantly reducing
prediction errors.
Table 4: MSE and R
2
of feature combinations for companies.
Company
All Features
Random Forest
Features
Lasso Regression
Features
Mutual Information
Features
MSE R
2
MSE R
2
MSE R
2
MSE R
2
Amazon 7.3282 0.8589 33.9151 0.9875 0.2485 0.9596 33.9151 0.9875
Google 5.8935 0.8207 14.7808 0.9913 0.0323 0.9789 14.7808 0.9913
Microsoft 5.2499 0.7804 55.9238 0.9960
5.1805
0.7833
55.9238
0.9960
4 CONCLUSIONS
The study evaluates the performance of 4 feature
combinations in the simultaneous prediction of stock
closing prices and volatility.A decade-long dataset of
stock market records from 3 companies (Amazon,
Google, and Microsoft) was analyzed. To address
redundancy issues inherent in multi-objective
forecasting frameworks, two distinct target variables
were established: 1) the closing price after 5 days, and
2) the difference between the highest and lowest
prices after 5 days. Given the relative importance of
closing price prediction compared to volatility
forecasting and to reduce parameter bias in multi-
target prediction models, conventional multi-output
approaches were abandoned in favor of a sequential
methodology. Instead, in the study, 3 feature selection
methods helped identify key features for closing price
prediction. Then these selected features were used as
inputs to predict price volatility.
Empirical results revealed company-specific
variations in optimal feature combinations for multi-
objective prediction. However, the feature
combination selected through Lasso Regression
consistently demonstrated superior predictive
performance across all companies compared to
alternative selection methods.
There are still some limitations of this paper. First,
the analytical scope was restricted to three established
feature selection techniques, potentially limiting
comprehensive exploration of the feature space.
Second, the Mutual Information and Random Forest
methods exhibited similar tendencies toward feature
selection, leading to repeated results in feature
combinations.
Future research can build upon this work in
several directions. First, more diverse feature
selection methods could be incorporated, particularly
those leveraging automatic feature extraction
techniques integrated with deep learning. Second,
alternative evaluation metrics, such as return-based
assessments, could be adopted to improve the
practical applicability and robustness of the model.
These avenues of research have the potential to
further enhance the precision of multi-target
prediction models, providing valuable support for
financial decision-making
REFERENCES
Blitsi, A. K. (2024). Multi-target learning with constraints
[Doctoral dissertation, Aristotle University of
Thessaloniki].
Htun, H. H., Biehl, M., & Petkov, N. (2023). Survey of
feature selection and extraction techniques for stock
market prediction. Financial Innovation, 9, 26.
Iranzad, R., & Liu, X. (2024). A review of random forest-
based feature selection methods for data science
education and applications. International Journal of
Data Science and Analytics, 1-15.
Jovi, A., Brki, K., & Bogunovi, N. (2015, May). A review
of feature selection methods with applications. In 2015
38th International Convention on Information and
Communication Technology, Electronics and
Microelectronics (MIPRO) (pp. 1200-1205). IEEE.
Kursa, M. B., & Rudnicki, W. R. (2011). The all relevant
feature selection using random forest. arXiv preprint
arXiv:1106.5112.
Muthukrishnan, R., & Rohini, R. (2016, October). LASSO:
A feature selection technique in predictive modeling for
machine learning. In 2016 IEEE International
Conference on Advances in Computer Applications
(ICACA) (pp. 18-20). IEEE.
Nabipour, M., Nayyeri, P., Jabani, H., Shahab, S., &
Mosavi, A. (2020). Predicting stock market trends using
machine learning and deep learning algorithms via
continuous and binary data; a comparative analysis.
IEEE Access, 8, 150199-150212.
Nguyen, X. V., Chan, J., Romano, S., & Bailey, J. (2014,
August). Effective global approaches for mutual
ICDSE 2025 - The International Conference on Data Science and Engineering
434

information-based feature selection. In Proceedings of
the 20th ACM SIGKDD International Conference on
Knowledge Discovery and Data Mining (pp. 512-521).
Shah, D., Isah, H., & Zulkernine, F. (2019). Stock market
analysis: A review and taxonomy of prediction
techniques. International Journal of Financial Studies,
7(2), 26.
Sun, J., Xiao, K., Liu, C., Zhou, W., & Xiong, H. (2019).
Exploiting intra-day patterns for market shock
prediction: A machine learning approach. Expert
Systems with Applications, 127, 272-281.
Ye, S. (2024). Applying ensemble learning to multiple stock
price predictions: A comparative study. Applied and
Computational Engineering, 50, 189-198.
Comparison of Feature Combinations on Simultaneous Prediction of Stock Price and Volatility
435
