
Research on a Random Forest Regression Model for Climate
Prediction in the Context of Wildfires
Junru Lou
a
Reading Academy, Nanjing University of Information Science and Technology, Ningliu street, Nanjing, China
Keywords: Wildfire, Random Forest Regression Algorithm, Climate Change, Global Warming.
Abstract: Until now, research has sometimes used the survivorship curves which is generated by statistics on tree age to
estimate the fire frequency. However, due to the infrequency of fires, it is hard to infer the existing woodland
studies about he relationship between fire occurrence and extent and short-term climate change. This paper
has an in-depth analysis of the quantitative relationship between fire size and greenhouse gas emissions with
the integrating global fire scale data, greenhouse gas emissions data and global temperature change data.
Random forest regression algorithm is used on this research and supports the analysis of the quantitative
relationship between fire size and greenhouse gas emissions. At last, the emission levels of greenhouse gases
will be analyzed, and the impact of greenhouse gas emissions on global warming will be discussed. This paper
has a goal of building a prediction model based on the wildfire burning scale. It will be used to predict the
level of impact on global warming. It is expected here to provide new insights into the mechanisms of global
climate change and provide a scientific basis for formulating effective environmental protection and fire
management policies.
1 INTRODUCTION
Recently, the wildfires raging through Los Angeles in
the United States have caught great attention of the
entire world. There are many extremely serious
consequences for local society, economic property
and many other areas with the widespread and
uncontrollable of wildfire. With those great threats,
the personal and property safety of local residents are
badly damaged. Besides that, Wildfire gives unique
challenges to conservation because it various greatly
in time and space indicating the randomness in nature
(McKenzzie et al.,2004). These fires cause massive
loss of vegetation and also destruction of wildlife
habitat showing the Fires destroy the stability of
ecosystem. Global environment also shows great
threat because of fires. What else, the spread of smoke
and hazardous substances from burning areas causes
much side effects on air quality. Human health and
life have been affected because of all those
shortcomings.
Establishing a national wildfire database has
become an important goal for research and disaster
a
https://orcid.org/0009-0005-7370-6551
prevention in various countries. America is a typical
example which faces many needs and challenges. The
core data elements of these databases include
locations, serial numbers, final locations and recorded
control date of the fire. This information is widely
used for geospatial fire analysis and risk assessment
(Short et al., 2014). To support this goal, many
models has been developed, which meant to capture
the multiple factors that influence the behavior as
completely as possible. The behaviors of individual
fires that can be described by existing data and
standard models. This may better weighting the
relationship between wildfire spread and ecosystem
response(Moritz et al., 2004). Besides of that, one
research shows that ability to accurately estimate the
occurrence of catastrophic events is particularly
critical when the distribution of extreme events is
clearly correlated and the frequency of abnormal
events exceeds expectations (Holmes et al., 2008).
One organization based on Google Earth Engine
(GEE) frame builds a large publicly available datasets
which is covering a wide range of observational
variables. These datasets not only contain many fire
events and their related variables, but also get the
392
Lou, J.
Research on a Random Forest Regression Model for Climate Prediction in the Context of Wildfires.
DOI: 10.5220/0013698100004670
Paper published under CC license (CC BY-NC-ND 4.0)
In Proceedings of the 2nd International Conference on Data Science and Engineering (ICDSE 2025), pages 392-399
ISBN: 978-989-758-765-8
Proceedings Copyright © 2025 by SCITEPRESS – Science and Technology Publications, Lda.

combination of the impact of human activities. It
provides a foundation for wildfire spread prediction,
which is widely used in machine learning and
computer vision analysis(Huot et al.,2022).
While wildfire raging in forests and other
vegetated areas, large range of greenhouse gases will
be release into the atmosphere, such as CO2.
Carbon
dioxide is one of greenhouse gases that causes
global warming. The rising concentrations of
carbon dioxide in the atmosphere pose enormous
environmental challenges to the earth(
Nunes et al.,
2023). Expect those gases, burning process will also
generate a lot of dust pollution, such as PM2.5.
Previous studies have shown that worsening air
quality due to climate warming will have a huge
impact on humans in terms of PM2.5
concentrations (
Liu et al.,2021). These two aspects
making an impact together to exacerbate global
warming. This phenomenon has long term influence
on earth's climate system. However, although great
effort are used to prevent the occurrence of wildfires.
Some wildfires may still occur because of some
natural or man-made causes. While these Inevitable
wildfires spreading, It is crucial to evaluate the
specific impact on global warming. These actions is
meant to release the side impact on environment.
What to do next is to minimize its impact on climate
change. With these steps, the adverse impact of
wildfires on the global climate can be reduced as
much as possible. Some targeted prevention efforts
could also be developed based on the burning level.
In this way, the balance of global ecosystem could be
maintained better.
Despite the progress made in fire management,
the key to addressing the challenge is to use mature
data processing methods such as machine learning to
understand complex wildfire phenomena and
mitigate their impacts (Bot et al.,2021). This paper
choose the random forest regression (RF) algorithm
to analysis the updated data. This model is meant to
fit existing training set data and evaluated the model's
fitting effect through the test set data. Through
building multiple decision trees and combining their
prediction results, this model can fit features and
trends to training set data. The model will evaluate on
the test set data in order to measure its prediction
accuracy and fitting effect. It shows strong anti-noise
and nonlinear fitting capabilities that is really suitable
to analysis the multidimensional features in complex
datasets. Through analyzing the model performance,
some references will be provided for the subsequent
optimization of pollution classification rules. The
burning scale is mainly represented by the global
burning area. At the same time, the main factors
affecting global warming include carbon emissions
and air pollution, which is represented by CO2 and
PM2.5 respectively. By fitting global land burnt area
and material emissions into a neural network model,
the corresponding models and fitting results are
supplied. The next step is to do classification on the
impact of wildfires on global warming. After the
above analysis, professionals could take appropriate
action according to the research impacts.
At the first part of this paper, the data sources, pre-
processing steps, and some detail descriptions of data
are elaborated carefully. Because of these data pre-
processing analysis, the following predictive models
and classification models could be selected targeting
fire emissions and pollution scale. The following part
shows the pollutants emissions prediction results
based on fire size. At the same time the classification
of the wildfire pollution scale is introduced. After all
the basic data and model descriptions, the research
results were analyzed in depth. There are several
contents that get detailed explanation, which are main
findings, study limitations, and directions for future
research. Through this structured research framework,
this paper gets a comprehensive discussion of fire
emissions and their classification.
2 METHOD
2.1 Data Source and Preprocessing
This research uses data resource from the Our World
in Data (OWID) platform. This platform is
established Oxford University research team and
provided with continuously updated data resources.
This team is an authority data providing organization
which is meant to do research on the global
development problems. As a world-known open data
resource library, OWID uses multidimensional data
visualization technology. It provides standardized
datasets which is covering a wide range of fields for
researchers. These data has a relatively high academic
value after strict quality control and verification.
Spatial autocovariates, derived from neighboring
estimates of the response variable, have improved the
accuracy of burned land maps using satellite data and
have improved the classification accuracy of large-
scale land cover maps (Koutsias et al., 2010).
In the research process, four key data-set are
chosen: annual-area-burnt-by-wildfires, annual-area-
burnt-by-wildfires-gwis, annual-carbon-dioxide-
emissions and annual-pm25-emissions-from-
wildfires. Through combining the first two databases,
Research on a Random Forest Regression Model for Climate Prediction in the Context of Wildfires
393

a complete interannual wildfire combustion area time
series was constructed from 2003 to 2024. At the
same time, the next two databases are used as the
independent observational indicators of the emission
of CO₂ and PM₂.₅.
In the data preprocessing link, the multi-source
datasets are performed with system integration. It is
used to ensure the unity of the temporal dimension
and integrity of the data structure. What's more, we
do restart sorting to three key variables, which are
burning area, CO₂ emission and PM₂.₅ emission, in
the time order. It lays foundation for the subsequent
timing analysis. Thanks to the strict data quality
control system of OWID platform, the original data
used in this research has the high quality in the
integrity and reliability. Therefore, there is no need to
conduct a routine data cleaning or do missing values
filling. These profits do strong basic guarantee to the
accuracy and credibility of this research.
2.2 Study Area and Timescale
In the study, six continents were selected as the
research objects: Asia, Africa, Europe, North
America, South America, Oceania and the global
level was included in the spatial coverage. There are
three criteria to select the area used in the study: the
diversity of geographical distribution, the differences
in climatic conditions, and the heterogeneity of
wildfire characteristics. With these three criteria, the
result will be possessed with full representativeness
and universality.
In terms of the temporal dimension, this research
adopts an annual time scale. Data from 2003 to 2024
are selected to analyze. There are some
considerations to decide the timeframe. First of all,the
year 2003, marking the widespread global attention
of wildfire, is a Key milestone of the significantly
rocketing climate change problem. Secondly, the data
of 2024 is the newest data that is available. This can
reflect the updated trends of the worldwide wildfire.
Through the Systematic analysis of this 22-year time
series of data. It can not only effectively capture the
spatiotemporal evolution of global wildfires, but also
improve the fitting accuracy and prediction ability of
the model. Besides of that, the annual timescale can
reflect both the Long-term trends in wildfire activity
and the periodicity characteristics. It can make
significant reduce the short-term fluctuations
interfere with research results. Because of these steps,
the scientific and reliability of data analysis can be
ensured successfully.
2.3 Model Building
2.3.1 A Prediction Model of Wildfire Size on
Emissions
In this study, the random forest regression algorithm
was used to construct the prediction model. The
random forest (RF) regression method is particularly
popular because of its broad applicability, tolerance
for nonlinearities in the data, and adaptability to high-
dimensional feature spaces (many predictors). It
bootstraps parts of the data, grows a decision tree on
each part, and then aggregates the predictions (Borup
et al., 2023). It is meant to analysis the relations
hip of
wildfire scale and pollutant emissions
quantitatively.
The model predicts the emissions of two major
pollutants, CO2 and PM2.5, respectively. Random
forest regression is an
ensemble learning algorithms,
which is chosen because of its advantage on
dealing with nonlinear relationships and high-
dimensional data aspects. This algorithm could not
only have the high forecast accuracy, but can also
exhibits good model stability.
In order to validate model performance, this
research takes the evaluate the predictions using a
visual approach. These Scatter distribution plot are
made by plotting the scatter distribution of the
actual observed values of pollutant emissions with
the predicted values of the model. Among which
the blue spots represent the actual observations. At
the same time the red spots represent the predicted
observations. Through comparing the analysis of
Spatial distribution characteristics of these two sets
of data points, it can be intuitively estimated the
accuracy of the model's predictions and how well
they agree with actual observations.
2.3.2 Wildfire Pollution Scale Classification
Model
In order to get further exploration of the
relationship between wildfire scale and pollutant
emissions, this research established a wildfire scale
classification mode based on the distribution of
CO2 and PM2.5 emissions. The model classifies
wildfire events into three pollution levels: Light,
Moderate, and Heavy, in order to quantitatively
assess the difference in environmental pollution
caused by wildfires of different scales.
While doing the design of the classification
criteria, the res
earch takes the quantile method to
ICDSE 2025 - The International Conference on Data Science and Engineering
394
dynamically determine the partition threshold.
Specifically speaking, the categorical boundaries
for CO2 and PM2.5 emissions were determined
based on the first quartile (33%) and second
quantile (66%) of their distribution.
Thereinto, the classification threshold for CO2
emissions is:
𝐶𝑂
𝑏𝑜𝑢𝑛𝑑𝑎𝑟𝑦1 = 2 × 10
(1)
𝐶𝑂
𝑏𝑜𝑢𝑛𝑑𝑎𝑟𝑦2 = 4 × 10
(2)
The classification thresholds for PM2.5
emissions are:
𝑃𝑀2.5𝑏𝑜𝑢𝑛𝑑𝑎𝑟𝑦1 = 7.8 × 10
(3)
𝑃𝑀2.5𝑏𝑜𝑢𝑛𝑑𝑎𝑟𝑦2 = 1.5 × 10
(4)
1. Light pollution: CO2 and PM2.5 emissions are
lower than the first quantile;
2. Moderate pollution: CO2 and PM2.5 emissions
are both below the second quartile;
3. Heavy pollution: CO2 or PM2.5 emissions are
higher than the second quartile.
By implementing a classification function,
classify_pollution_level, this research
labelled each
record in the data set with a pollution level. In order
to Presents the classification results directly, the
research uses scatter plot of CO2 and PM2.5
emissions based on pollution level colouring.
Through the visualized result, the classification
model can effectively distinguish the
environmental pollution degree of wildfires of
different scales and provide scientific support for
relevant decision-making in order to make
scientific support for the decisions. For example,
for severe pollution incidents, prevention and
control measures can be prioritised to reduce their
potential harm to ecosystems and public health.
2.4 Model evaluation and optimisation
In this study, the dataset was divided by stratified
random sampling. This can ensure the
representativeness of the sample and the reliability of
the experiment. Here, it is divided the original
datasets into a training set and a test set at a 7:3 ratio.
70 percent of data are used as the training model and
30 percent of data are used as testing model. To
prevent model bias that may result from uneven data
distribution or sequential effects, the random shuffle
function (shuffle = True) is enabled in the data
partitioning process. Random forest regression
prediction models for CO₂ and PM₂.₅ emissions were
constructed, respectively in this study. In terms of
model parameter settings, the main configurations are
as follows:
100=− estimatorsn
(the number of the tree
in the forest is 100)
42=− staterandom
(Random seeds are
fixed to ensure reproducibility of results.)
2.4.1 Model parameter settings
The parameters of the random forest regression
model are shown in table 1.
Table 1: Model Parameters of CO2 and PM2.5 Emissions
Paramete
r
Value
0
b
ootstrap True
1 ccp_alpha 0.0
2 criterion squa
r
ed
_
erro
r
3 Max_depth
N
one
4 max_features 1.0
5max
_
leaf
_
nodes
N
one
6max
_
samples
N
one
7min
_
impurit
y_
decrease 0.0
8min
_
samples
_
leaf 1
9 min_samples_spli
t
2
10 min_weight_fraction_le
af
0.0
11 monotonic_cs
t
N
one
12 n_estimators 100
13 n
_j
obs
N
one
14 oob
_
score False
15 random
_
state 42
16 verbose 0
17 warm star
t
False
2.4.2 Model evaluation metrics
In order to comprehensively evaluate the prediction
performance of the model, a multi-dimensional
evaluation index system was constructed in this
study. Five representative evaluation indicators
were selected:
Mean Square Error (MSE), Root
Mean Square Error (RMSE), Mean Absolute Error
(MAE), Mean Absolute Percentage Error (MAPE),
Coefficient of Determination (R²).
These indicators
quantitatively evaluate the model performance
from different dimensions such as error level,
relative error, and goodness-of-fit. Table 2 shows
the specific application results of the above
evaluation indicators in CO₂ and PM₂.₅ emission
prediction models:
Research on a Random Forest Regression Model for Climate Prediction in the Context of Wildfires
395
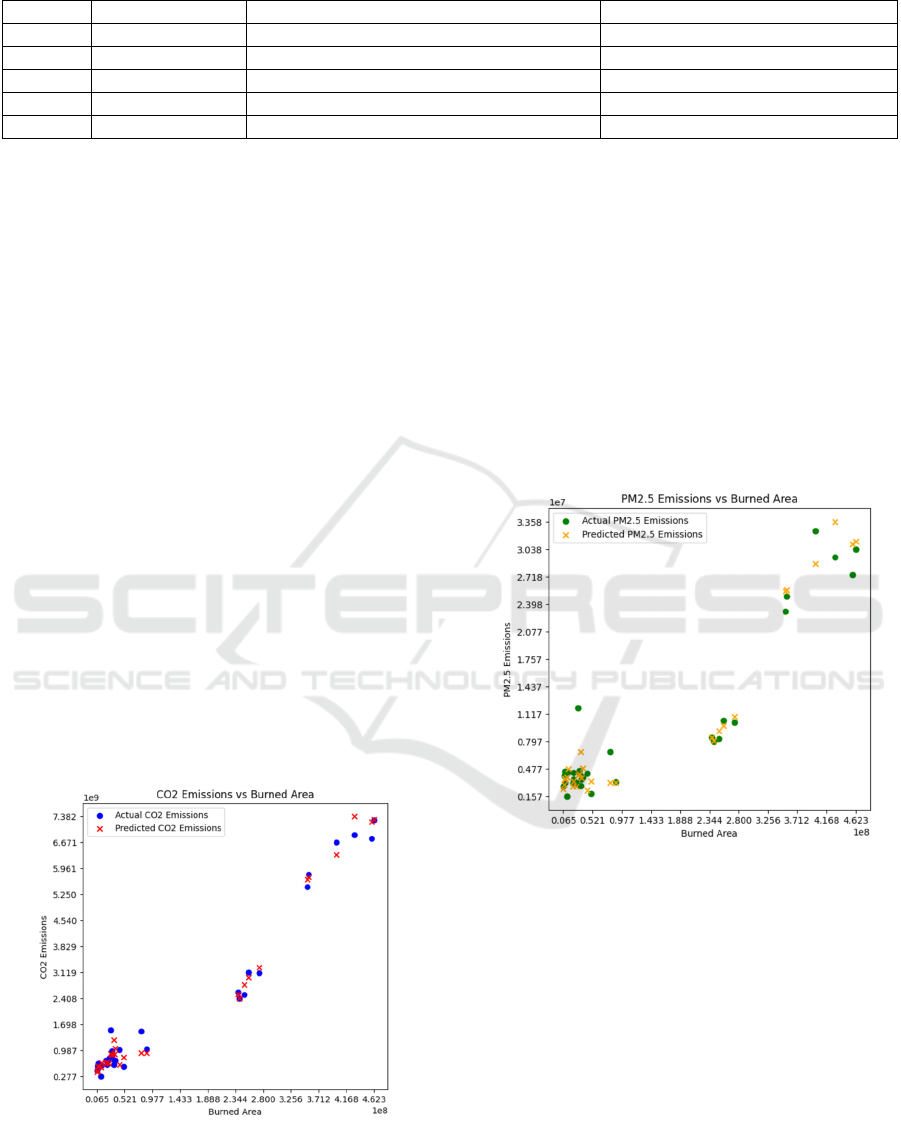
Table 2: Evaluation results of the emission model
Metric CO2 Emissions PM2.5 Emissions
0 MSE 80418906238585136.00 5111890742130.03
1 RMSE 283582274.20 2260949.08
2 MAE 205941023.96 1467302.85
3 MAPE 19.82% 25.40%
4 R² 0.9841 0.9433
3 RESULTS
3.1 Projections of Wildfire Size on
Emissions
In this research, the random forest algorithm is used
to predict the relationship between the wildfire scale,
which is represented by the burning area, and CO2
and PM2.5 emission. Through the analys
is of
comparison of actual observations with model
predictions, we evaluate the performance of the
model.
3.1.1 Prediction Results of CO₂ Emissions
Figure 1 represents the comparison of the actual and
predicted emission of CO2. As this figure shows, the
random forest algorithm can better capture the
relationship between CO2 emissions and combustion
area. Although the predictions of the model are
slightly off in some high burning areas, the forecast
result is overall close to the actual value. All these
things above shows this model excels when dealing
with nonlinear relationships that can be effectively
used to predict
Figure 1: The comparison of the actual and predicted
emission of CO2 (Picture credit: Original)
3.1.2 Forecast Results for PM2.5
Emissions
Figure 2 shows the comparison of the actual and
predicted emission of PM2.5. Similar to the predicted
result of the CO2 emission, the random forest festival
does well in the forecast of PM2.5. The model can
accurately reflect the trend of PM2.5 emission with
the burning area, especially in the middle level
burning areas. However, in the extremely high
burning areas, the prediction accuracy of the model
will decrease slightly, which may be related to the
sparsity of the data distribution.
Figure 2: The comparison of the actual and predicted
emission of PM2.5 (Picture credit: Original)
3.1.3 Model Performance Evaluation
In general, the random forest model shows high
accuracy while predicting the CO2 and PM2.5
emission. There is a strong correlation between the
prediction results of the model and the actual
observations which shows the burned area is and
important factor affecting emissions. However, there
is still development area in the prediction accuracy of
the model in extreme classes. More complex model
structure or more
characteristic variables could be
used to improve prediction performance in the
future.
ICDSE 2025 - The International Conference on Data Science and Engineering
396
3.2 Wildfire Scale Classification
Results
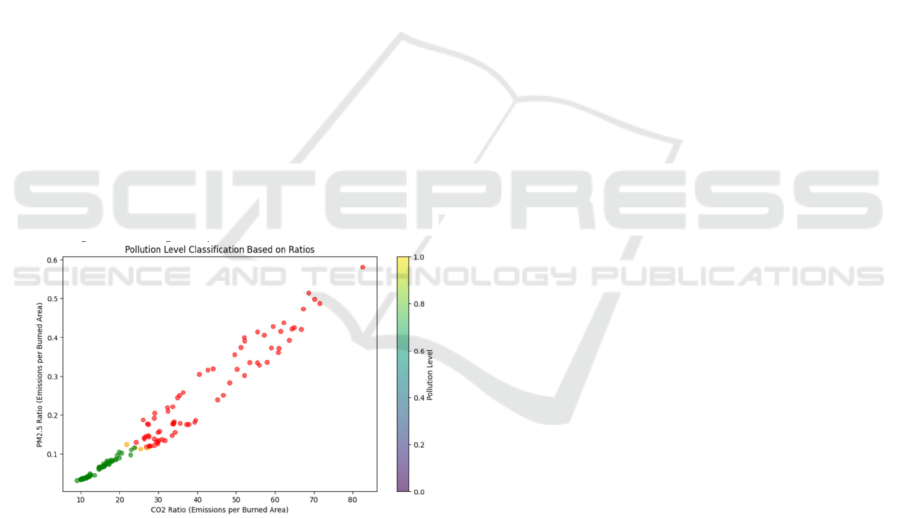
In this chapter, the global wildfire scale is made a
grade classification which is based on the ratio of
burnt area to pollutant emissions. At the same time
the spatiotemporal distribution characteristics of
different level of wildfire are analyzed. It is clear that
the impact of wildfire on environment is accurately
assess through comparing the grade of the resources.
Pollutant ratios and wildfire scale classifications
Figure 3 shows the result of classification of
wildfire size classification based on PM2.5 and CO₂
emissions and burned area ratio. It can be seen that
PM2.5 ratio fluctuates between 0.1 and 0.6. At the
same time CO2 ratio remains relatively stable at a low
level. Through analyzing all those ratios, wildfire
scale is divided into the following levels:
1. Low pollution level: PM2.5 ratio less than 0.2,
CO₂ ratio less than 0.2. These types of wildfires
typically burn a small area and have a limited impact
on air quality.
2. Medium pollution level: PM2.5 ratio between
0.2 and 0.4, CO₂ ratio between 0.2 and 0.4. These
wildfires burn a moderate area and have a significant
impact on local air quality.
3. High pollution level: PM2.5 ratio is higher than
0.4, and CO₂ ratio is higher than 0.4. These wildfires
burn large areas and have a serious impact on regional
and even global air quality.
Figure 3: the result of classification of wildfire size
classification based on PM2.5 and CO₂ emissions and
burned area ratio (Picture credit: Original)
The impact of wildfires on the environment can be
assessed more accurately with the help of the
classification of wildfire scale based on pollution
ratio. The high-level wildfires which occur in a
specific time and area have such severe impact on
global climate change and air quality. The future
result can get further combination with
meteorological data and human activity factors. With
these developments, accuracy of wildfire prediction
and management will be improved.
4 DISCUSSION
4.1 Result Discussion
This paper is based on the predicted result of the CO2
and PM2.5 emissions. While estimating the impact of
wildfires on global greenhouse gas concentrations, it
is clear that there is a significant positive correlation
between wildfire burned area and CO2 and PM2.5
emissions. Especially during severe pollution events,
the impact of wildfires on greenhouse gas
concentrations is more prominent. Combined with the
spatial and temporal distribution of wildfire-prone
areas, there are many potential drivers on climate
change, including increased extreme weather events,
increased dryness of vegetation, and human activities
interfering with natural ecosystems. Differences in
wildfire characteristics between regions are the main
reason in emission contributions, for example,
different vegetation types can affect combustion
efficiency and the types of emissions; climate
conditions can intensify the scale and frequency of
wildfires; and human activities can also have a
significant impact on wildfire emissions. The
interaction of these factors results in significant
differences in the contribution of wildfires to climate
warming in different regions. It shows great
prediction while using the random forest model on the
prediction aspect. The nonlinear relationships
between burning area and CO2 and PM2.5 emission
could be easily caught. However, there are also some
limitation of the random forest model, for example
the high reliance on data volume and relatively weak
interpret ability. In the future, there may be more
machine learning models used to deal with this
project which may make some comparison to find a
best fitted one. With the future effort, the predictive
performance will be improved
.
4.2 Study Limitations
4.2.1 Data Quality
The data used in this study may have issues with
uneven time spans or insufficient spatial coverage,
particularly in areas where wildfires are frequent but
monitoring capabilities are weak. Furthermore,
measurement errors in CO2 and PM2.5 emission data
may impact the model results, such as insufficient
sensor accuracy or biases introduced by data
interpolation methods.
Research on a Random Forest Regression Model for Climate Prediction in the Context of Wildfires
397

4.2.2 Model Selection
Although the random forest model performed well in
this study, it did not fully consider other potential
features (such as meteorological conditions and
vegetation types) and their interactions. Additionally,
median-based classification methods, while simple
and intuitive, may not adequately reflect the dynamic
changes in pollution levels. Future research could
explore the introduction of dynamic thresholds or
machine learning-based classification methods to
enhance classification accuracy.
4.3 Research
Future research could have further understanding on
several aspects of further research into wildfire
emissions and their impact on climate change. First of
all, more influencing factors could be added in order
to build multivariate regression or deep learning
models to more fully capture the complex
mechanisms of wildfire emissions. For example,
changes in climate could significantly influence the
wildfire combustion efficiency and emissions spread.
The differences in vegetation types affect the types of
fuels and emission intensity. Secondly, with the
combination of the climate model, the long term
influence could be studied on the impact of wildfire
emissions of greenhouse gas concentrations and
climate warming. Through simulating these, It can
assess the contribution of wildfire emissions to global
temperature increases and reveal their potential
changes under different climate conditions. After all,
while predicting the influence of wildfire emissions
to global temperature rise, evaluation of potential
effects of wildfire emissions should be made in order
to analyze the economic and environmental benefits
of international cooperation and localized control
measures. After combing the help of understanding
the reflection of wildfire on climate change. These
could provide stronger scientific support for
addressing climate change.
5 CONCLUSIONS
Deal to the dynamic regulation of ecosystems, the
existing information on species types and climate
conditions around the world. As a result of this, the
current rules of wildfire area burned and greenhouse
gas emissions still remains unchanged. As climate
change intensifies its impact on ecosystems, the way
of prediction of the impact of climate change on
greenhouse gas emissions, especially impact of
wildfires on emissions such as CO2 and PM2.5, will
make challenges facing by the climate protection
manager. Although the current research has shown
that there are Potential associations between wildfire
emissions and climate change. Considering the
uncertainty about climate change, this paper uses the
simplest representative, which are CO2 and PM2.5,
to predict the predicting the specific impact of
wildfires on greenhouse gas emissions as a
preliminary attempt.
This paper uses the simplest representative, which
are CO2 and PM2.5, to predict the predicting the
specific impact of wildfires on greenhouse gas
emissions as a preliminary attempt in this area. The
model evaluation results show that the mean square
error (MSE), mean absolute error (MAE) and
coefficient of determination (R²) all have high
prediction accuracy. The pollution classification
method based on Emission ratio intuitively reveals
the distribution characteristics of pollution levels in
time. New research ideas are provided to quantify the
impact of wildfire emissions on climate change,
which may better face the challenges of climate
change
On the scientific aspect, the result provides
database support and methodological references for
the prediction of global climate change, especially on
the aspect of discussing wildfire emissions and global
warming. It fills the gap in related research. At the
same time, on the policy level, this result provides a
basis for developing wildfire emission prevention and
control policies. Prioritize responding to severe
pollution incidents and reducing their harm to
ecosystems and human health. Scientific support is
also provided for the regional and global climate
policies optimization.
In the future research, Comprehensive analysis of
multiple factors, such as meteorological conditions,
vegetation types and human activities, should be
taken into consideration to reduce the impact of
confounding variables on experimental results. At the
same time, the prediction model could be constructed
as a more accurate one, which is specially designed
for this problem, to uncover the complex mechanisms
of wildfire emissions. What’s more, Regional
differences can be conducted based on wildfire
characteristics in different regions. In order to
improve these shortcomings, It is important to
promoting data sharing and interdisciplinary
collaboration. Combining the power of climatology,
ecology and data science to jointly address climate
change. These hard works will further develop the
understanding of understanding wildfire emissions
and their impact on climate change and provide
strong support for science-based responses to climate
change
ICDSE 2025 - The International Conference on Data Science and Engineering
398

REFERENCES
Borup, D., Christensen, B. J., Mühlbach, N. S., & Nielsen,
M. S. 2023. Targeting predictors in random forest
regression. International Journal of Forecasting, 39(2),
841-868.
Bot, K., & Borges, J. G. 2022. A systematic review of
applications of machine learning techniques for
wildfire management decision
support. Inventions, 7(1), 15.
Holmes, T. P., Huggett Jr, R. J., & Westerling, A. L. 2008.
Statistical analysis of large wildfires. The economics of
forest disturbances, 79, 59-77.
Huot, F., Hu, R. L., Goyal, N., Sankar, T., Ihme, M., &
Chen, Y. F. 2022. Next day wildfire spread: A machine
learning dataset to predict wildfire spreading from
remote-sensing data. IEEE Transactions on Geoscience
and Remote Sensing, 60, 1-13.
Koutsias, N., Martínez-Fernández, J., & Allgöwer, B. 2010.
Do factors causing wildfires vary in space? Evidence
from geographically weighted regression. GIScience &
Remote Sensing, 47(2), 221-240.
Liu, S., Xing, J., Westervelt, D. M., Liu, S., Ding, D., Fiore,
A. M., ... & Wang, S. 2021. Role of emission controls
in reducing the 2050 climate change penalty for PM2.
5 in China. Science of the Total Environment, 765,
144338.
McKenzie, D., Gedalof, Z. E., Peterson, D. L., & Mote, P.
2004. Climatic change, wildfire, and
conservation. Conservation biology, 18(4), 890-902.
Moritz, M. A., Morais, M. E., Summerell, L. A., Carlson, J.
M., & Doyle, J. 2005. Wildfires, complexity, and highly
optimized tolerance. Proceedings of the National
Academy of Sciences, 102(50), 17912-17917.
Nunes, L. J. 2023. The rising threat of atmospheric CO2: a
review on the causes, impacts, and mitigation
strategies. Environments, 10(4), 66.
Short, K. C. 2014. A spatial database of wildfires in the
United States, 1992-2011. Earth System Science
Data, 6(1), 1-27.
Research on a Random Forest Regression Model for Climate Prediction in the Context of Wildfires
399
