
Comparative Analysis of Time Series Models for Forecasting the U.S.
Unemployment Rate: A Study of ARIMA, LSTM, and Intervention
Approaches
Yunpeng Li
a
Bachelor of Business Administration (Hons) Programme, Hong Kong Baptist University, Kowloon, Hong Kong, China
Keywords: Time Series Forecasting, Unemployment Rate Prediction, Economic Events, COVID-19 Pandemic, Machine
Learning Techniques.
Abstract: The unemployment rate reflects the overall health of the labor market and influences monetary and fiscal
strategies. The rapidly changing economic landscape, marked by events like the financial downturn of 2008
and the global health crisis caused by COVID-19, highlights the necessity of stable forecasting models that
capture complex dynamics and structural changes. This research centers on comparing various time series
models to forecast unemployment rates in the United States (ARIMA, LSTM and intervention approaches).
The research collected the US unemployment rate for the 16-24 age group from 1978 to 2023 and applied
time series visualization, seasonal decomposition, and intervention analysis to understand trends and event
impacts. ARIMA and LSTM are developed and evaluated by evaluation measures like MSE, RMSE, MAE,
and MAPE. The study aims to identify which model best captures trends, seasonal patterns, and structural
changes in the labor market. Preliminary findings suggest that LSTM models outperform ARIMA in complex
scenarios due to their ability to learn long-term dependencies. The results of this research will contribute to
improved forecasting methodologies, providing policymakers with more accurate predictions to inform
decision-making processes.
1 INTRODUCTION
The unemployment rate has always been a hot topic
for economists worldwide. As it affects all countries,
forecasting the unemployment rate is critical for
policymakers, economists, and businesses (Douglas,
S., & Zahed, M.,2024). It provides valuable insights
into the overall health of the economy and labor
market trends. The United States unemployment rate,
in particular, is a key economic indicator that
influences monetary policy decisions, fiscal planning,
and business strategies. Over the years, various time
series models have been developed and applied to
predict unemployment rates, each with strengths and
limitations.
Recent studies have highlighted the need for a
comprehensive comparison of different forecasting
models because the performance of these models can
vary significantly depending on economic conditions
and data characteristics. For instance, Douglas and
a
https://orcid.org/0009-0006-2287-6080
Zahed demonstrated the limitations of using only
ARIMA models for long-term unemployment rate
forecasts, emphasizing the need to consider
alternative approaches (Douglas & Zahed, 2024).
Similarly, Gostkowski and Rokicki compared several
predictive methods, including ARIMA and regression
models, but they did not include more advanced
machine learning techniques such as LSTM
(Gostkowski & Rokicki, 2021).
The rapidly evolving economic landscape,
particularly considering recent worldwide
occurrences, such as the COVID-19 outbreak, has
emphasized the significance of reassessing and
comparing different forecasting models. Traditional
models that performed well in the past may no longer
be as effective in capturing the complex dynamics of
today's labor market. As Barnichon and Nekarda
(2012) noted, models incorporating labor force flow
data can significantly outperform traditional
forecasting approaches, especially during economic
downturns (Barnichon & Nekarda, 2012).
372
Li, Y.
Comparative Analysis of Time Series Models for Forecasting the U.S. Unemployment Rate: A Study of ARIMA, LSTM, and Intervention Approaches.
DOI: 10.5220/0013697600004670
Paper published under CC license (CC BY-NC-ND 4.0)
In Proceedings of the 2nd International Conference on Data Science and Engineering (ICDSE 2025), pages 372-378
ISBN: 978-989-758-765-8
Proceedings Copyright © 2025 by SCITEPRESS – Science and Technology Publications, Lda.

Predicting unemployment levels is a critical task
for economic policymakers and researchers.
However, the data used by a number of studies is
already outdated, and they didn’t involve the outliers
caused by the pandemic. Various methods have been
employed by many researchers to predict
unemployment rates, including traditional statistical
models and advanced machine-learning techniques.
Previous researchers have used various methods
to predict unemployment trends in the United States,
including traditional ARIMA models, primary
economic signals, and automatic time series modeling
techniques like Autometrics. Guerard, Thomakos,
and Kyriazi built upon earlier work by applying
Autometrics to improve models for real GDP and
unemployment, accounting for structural breaks and
outliers (Guerard, Thomakos & Kyriazi, 2020). Their
study emphasized the effectiveness of adaptive
learning forecasting and the significance of
incorporating leading indicators. However, the
effects of the COVID-19 period were not included in
their research process, which generated a huge impact
on the global unemployment rate.
Shan Zhong analyzed the U.S. real GDP and
unemployment rate data from 1948 to 2023 using
linear and nonlinear regression and ARIMA models
(Zhong, 2023). The study found that nonlinear
regression more accurately represents the relationship
between these two factors. ARIMA forecasts showed
optimistic future trends with GDP growth and low
unemployment but with wide confidence intervals.
Yurtsever proposed a hybrid model combining
LSTM and GRU deep learning techniques to forecast
unemployment rates in the U.S., U.K., France, and
Italy. Generally, the hybrid model outperformed
standalone LSTM and GRU models, except in Italy,
where GRU performed better. This study highlights
the effectiveness of combining different models to
enhance forecasting performance (Yurtsever, 2023).
Other researchers have also explored hybrid
approaches, such as combining ARIMA with
artificial intelligence methods, which have shown
promising results in reducing prediction errors
(Chakraborty et al., 2021; Ahmad et al., 2021).
Additionally, Xiao et al. revisited earlier forecasting
methodologies to explore relationships between
unemployment rates and leading economic indicators
such as data on weekly jobless claims and the U.S.
Leading Economic Indicator (LEI), demonstrating
that incorporating these variables can enhance
predictive accuracy (Xiao et al., 2022). Montgomery
et al. further emphasized that forecasting accuracy
could be improved by combining multiple time series
methods and carefully accounting for structural
breaks in historical data (Montgomery et al., 1998).
Similarly, Dritsakis and Klazoglou applied the Box-
Jenkins methodology extensively to forecast U.S.
unemployment rates, highlighting its effectiveness
but also acknowledging its limitations when
confronted with structural changes or unprecedented
economic shocks (Dritsakis & Klazoglou, 2018).
These findings collectively reinforce the necessity of
exploring diverse forecasting methodologies to better
capture complex labor market dynamics.
This study seeks to fill this research gap by
comparing three well-known time series forecasting
methods to predict unemployment trends in the
United States: ARIMA, LSTM neural networks, and
intervention approaches. By evaluating these diverse
models using the recent data from 1978 to 2023 and
considering their performance across different
economic conditions, this study seeks to point out
which model is best fitted to predict unemployment
trends and offer new perspectives on how effectively
different forecasting approaches perform in the
current financial landscape.
2 DATA AND METHOD
2.1 Data Collection and Description
The dataset used in this analysis contains the
unemployment rate for the 16-24 age group from
December 1978 to July 2023. The data was cleaned
and preprocessed by removing missing values,
converting the date column to a date format, and
arranging the data in chronological order. The dataset
provides a comprehensive view of the trends and
patterns in youth unemployment over more than 40
years.
2.2 Methods and Principles
This study employs several methodologies to analyze
and predict unemployment rates in the United States.
The primary methods are as follows.
2.2.1 Time Series Visualization
Time series visualization is a crucial step in
understanding the behavior of the data over time. This
involves graphically representing the unemployment
rate over time to identify trends, seasonal patterns,
and significant events. Visual inspection helps in
understanding the overall behavior of the data.
Firstly, this study presents a time series graph
depicting unemployment rates among younger age
Comparative Analysis of Time Series Models for Forecasting the U.S. Unemployment Rate: A Study of ARIMA, LSTM, and Intervention
Approaches
373
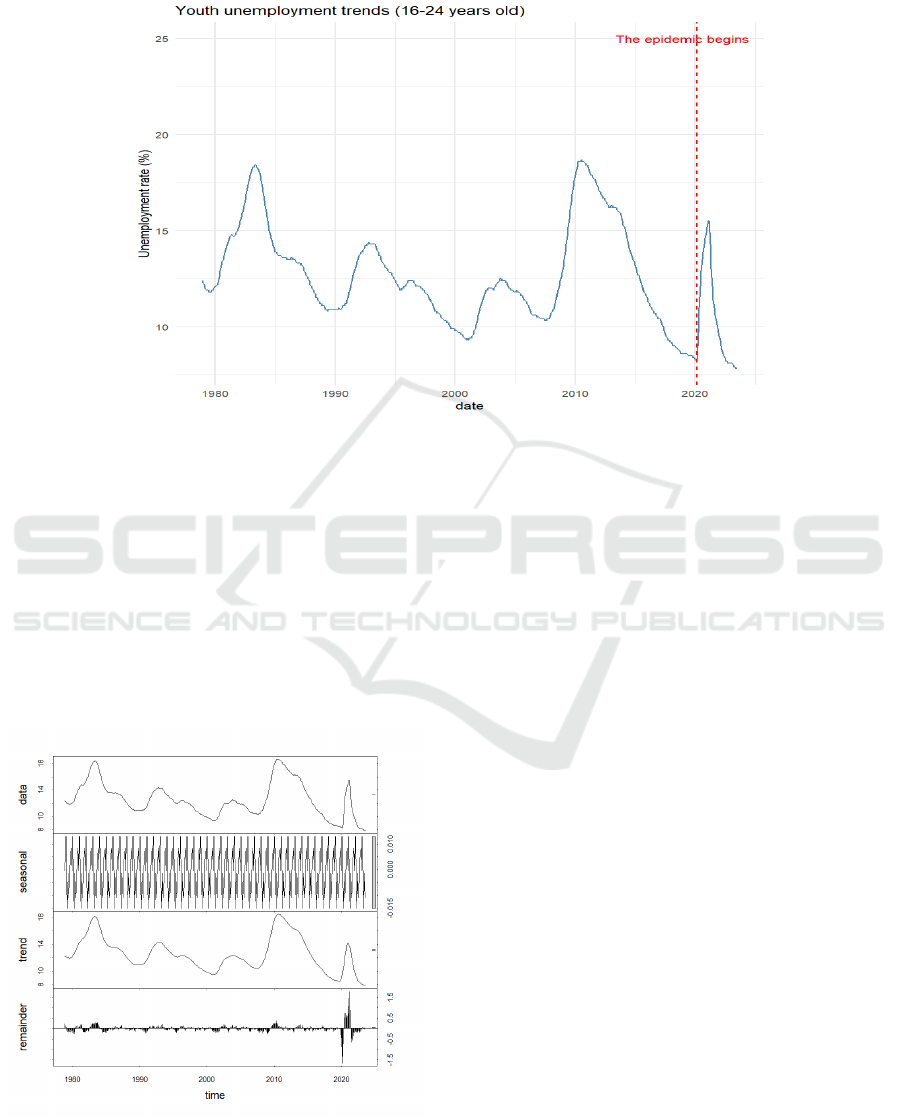
groups. The unemployment rate for the 16-24 age
group was plotted over time, as shown in Figure 1, a
clear trend and seasonal patterns were displayed. A
vertical line was added to mark the start of the
pandemic in March 2020, was marked to observe its
impact on the trend.
Figure. 1 Youth Unemployment Trends (16-24 years old). (Picture credit: Original)
2.2.2 Seasonal Decomposition
Seasonal decomposition, using techniques such as the
STL method, breaks down the time series into its
underlying components: trend, seasonal, and residual.
This decomposition aids in understanding the
underlying structure of the data. In this study, the time
series was decomposed into trend, seasonal, and
residual components using the STL method, as shown
in Figure 2. This provided valuable insights into the
underlying structure of the data.
Figure. 2 Seasonal Decomposition by STL model. (Picture
credit: Original)
2.2.3 Intervention Analysis
Intervention analysis examines how particular
incidents, like the financial crisis in 2008 and the
COVID-19 pandemic, influence changes in
unemployment rates. Intervention analysis helps in
quantifying the effects of these events.
In this paper, a linear regression model was built
to analyze the impact of the financial crisis in 2008
and the 2020 pandemic on the unemployment rate.
The model included dummy variables for these events
and a lagged term of the unemployment rate and also
allowed for the quantification of their impacts on the
unemployment rate at the same time.
2.2.4 ARIMA Model
The ARIMA approach is widely utilized for
forecasting time series data. It integrates
autoregressive (AR), differencing (I), and moving
average (MA) elements to effectively identify linear
dependencies and seasonal variations within the
dataset. In this literature, the ARIMA model was
applied to forecast the unemployment rate. The data
was differenced to achieve stationarity, and the
optimal ARIMA model was selected based on the
AIC values.
2.2.5 LSTM Model
Long Short-Term Memory (LSTM) networks are a
type of recurrent neural network (RNN) that are
ICDSE 2025 - The International Conference on Data Science and Engineering
374
particularly effective for time series forecasting. They
are capable of learning long-term dependencies in the
data. This research applied the LSTM approach to
predict unemployment rates. The dataset underwent
normalization before being divided into training and
testing subsets. The training subset was utilized to
build the model, while the testing subset was
employed to assess its performance.
2.3 Evaluation Metrics
The average squared difference between the expected
and actual values is measured by the Mean Squared
Error, or MSE. It is a frequently used indicator to
assess how well regression models perform.
Root Mean Squared Error (RMSE) is calculated
as the square root of Mean Squared Error (MSE) and
measures the size of prediction errors, expressed in
the original units of the data.
Mean Absolute Error (MAE) calculates the mean
of the absolute differences between observed and
predicted values, and it is more robust against outliers
than MSE.
Mean Absolute Percentage Error (MAPE)
calculates the average of absolute differences
between actual and predicted values expressed as
percentages, offering a relative assessment of
forecasting accuracy.
Mean Absolute Scaled Error (MASE) evaluates a
model's accuracy by comparing its prediction errors
against errors from a simple baseline (naive forecast),
resulting in a standardized performance metric.
3 RESULTS AND DISCUSSION
3.1 Intervention Analysis
The intervention analysis model was designed to
assess the impact of significant events on the
unemployment rate. The results indicate that the 2008
financial crisis had a substantial and statistically
significant impact on the unemployment rate, with a
coefficient of 0.32035. This suggests that the crisis
led to a marked increase in unemployment.
Conversely, the 2020 pandemic had a much smaller
and statistically insignificant impact, with a
coefficient of 0.01223186. This finding may be
attributed to government interventions, such as
stimulus packages and employment support
programs, which mitigated the pandemic's effects on
employment.
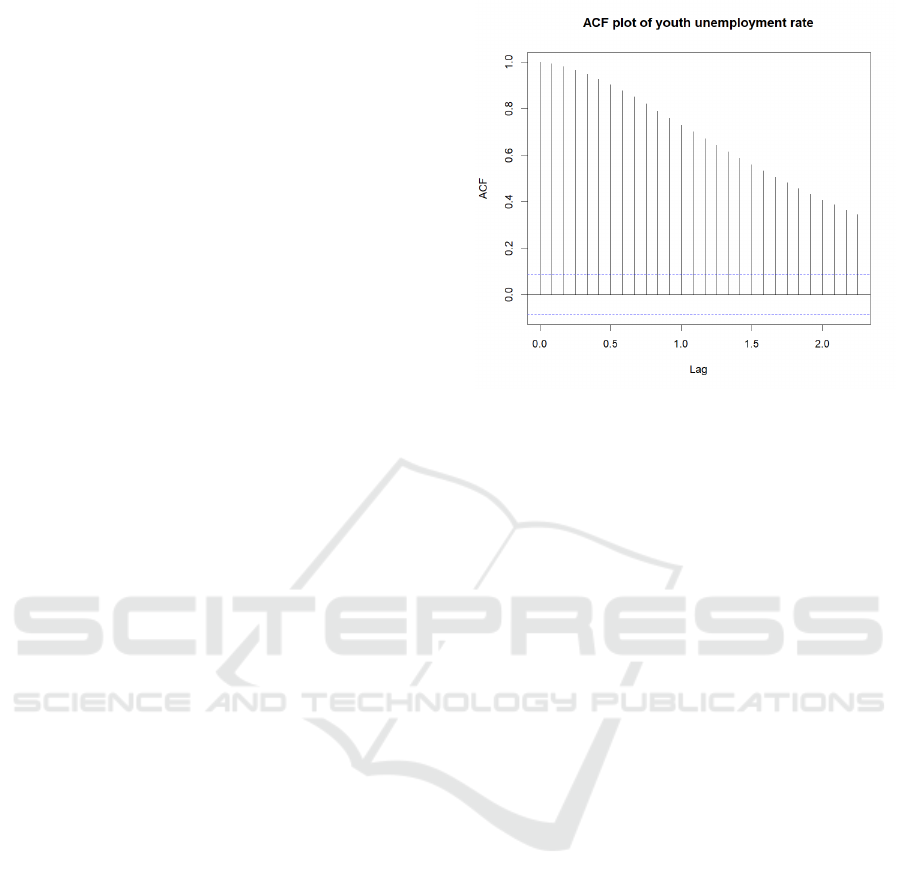
Figure. 3 ACF Plot of Youth Unemployment Rate. (Picture
credit: Original)
Figure. 3 presents the ACF plot for the original
youth unemployment rate data (ages 16-24). The
ACF plot visually represents the correlation between
observations at different lag intervals. The horizontal
axis represents different lag values, while the vertical
axis shows autocorrelation coefficients. The shaded
area indicates the confidence interval bounds;
correlations extending beyond these bounds are
statistically significant. From Figure 3, high initial
autocorrelation is observed that there is a very high
autocorrelation at lag 0 (as expected, always equal to
1), followed by gradually decreasing autocorrelations
at subsequent lags. This indicates strong persistence
in the unemployment rate data, meaning past
unemployment rates heavily influence current rates.
It is also noticeable that notable periodic spikes at
regular intervals (approximately every 12 lags)
suggest clear seasonal patterns. This aligns with
typical labor market dynamics where youth
unemployment rates fluctuate seasonally due to
school calendars, holidays, and seasonal employment
opportunities.
In summary, Figure 3 illustrates that the original
unemployment series is non-stationary due to
persistent trends and seasonal fluctuations. These
characteristics necessitate differencing or other
transformations before applying forecasting models
such as ARIMA.
Comparative Analysis of Time Series Models for Forecasting the U.S. Unemployment Rate: A Study of ARIMA, LSTM, and Intervention
Approaches
375
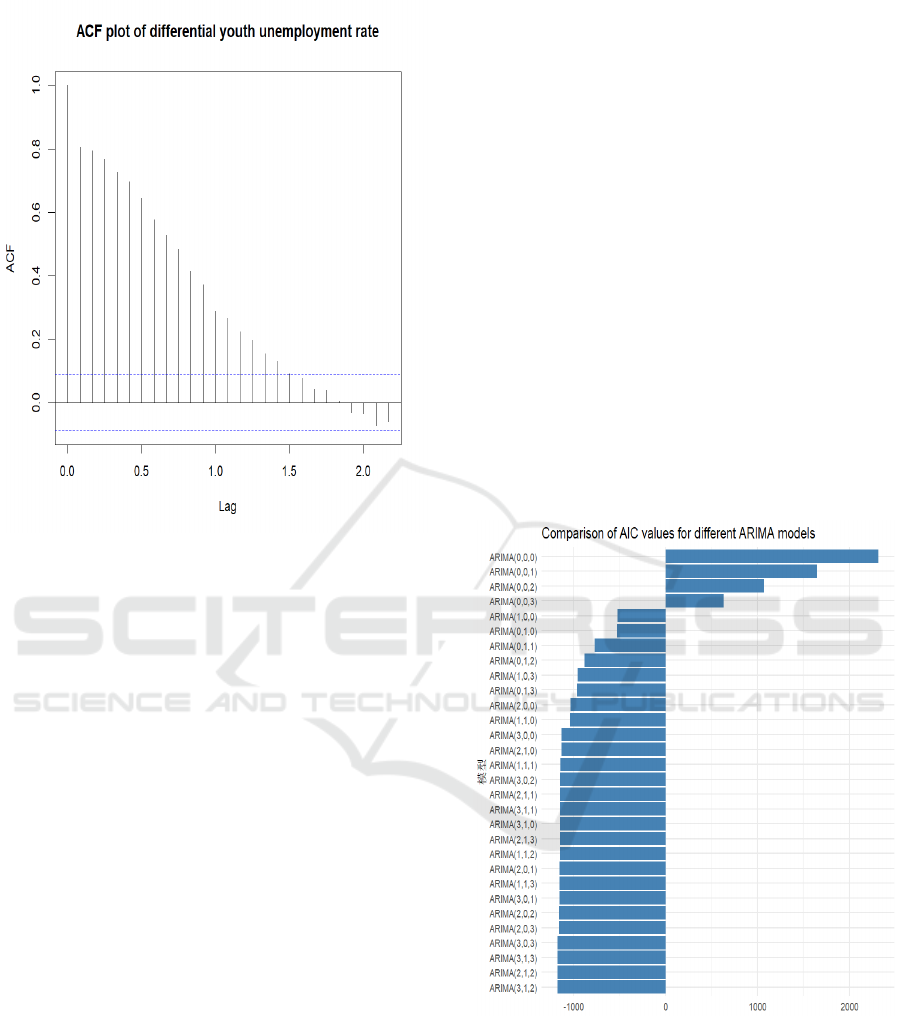
Figure. 4 ACF Plot of Differential Youth Unemployment
Rate. (Picture credit: Original)
Figure 4 shows the ACF plot after applying first-
order differencing to the youth unemployment rate
data. Differencing is a common step in achieving
stationarity by removing trends and stabilizing mean
values. It is observed that there is a significant
reduction in autocorrelation. Compared to Figure 3,
the autocorrelation values drop sharply after
differencing. This substantial reduction indicates that
differencing effectively removed much of the trend
component present in the original data. Furthermore,
unlike Figure 3, Figure 4 displays a rapid decline of
autocorrelation values toward zero after just a few
lags. This rapid decay pattern confirms that
differencing successfully transformed the series into
a stationary one, which is suitable for ARIMA
modeling.
In summary, Figure 4 demonstrates that
differencing has effectively addressed non-
stationarity caused by trends but has not completely
eliminated seasonal effects. Therefore, although
intervention analysis can now be reliably performed
on this stationary series, additional modeling
adjustments may still be beneficial for capturing
remaining seasonal dynamics accurately. These
findings justify using ARIMA models with
differencing (as performed in this study).
3.2 ARIMA Model
Figure 5 below in the research paper provides a
comparative visualization of Akaike Information
Criterion (AIC) values calculated for different
ARIMA models tested during the model selection
process. The ARIMA model selected based on the
lowest AIC value was ARIMA (3,1,2), with an AIC
of -1178.4186. This model was chosen because lower
AIC values suggest a better trade-off between
complexity and explanatory power, which indicates it
achieves an optimal balance between capturing
sufficient patterns in youth unemployment data and
avoiding excessive complexity. Meanwhile, it has the
ability to effectively capture the linear relationships
and seasonal patterns in the data. However, the
model's performance on the test set revealed a
relatively high RMSE of 3.51754016, indicating that
the predictions were not highly accurate. This
suggests that while ARIMA models are useful for
understanding linear trends, they may struggle with
complex or non-linear dynamics.
Figure. 5 Comparison of AIC Values for Different ARIMA
Models. (Picture credit: Original)
3.3 LSTM Model
The LSTM model's performance was evaluated using
RMSE. The RMSE for the LSTM model was
1.030382, which is significantly lower than the
ARIMA model's RMSE on the test set. This indicates
that the LSTM model yielded more precise
ICDSE 2025 - The International Conference on Data Science and Engineering
376
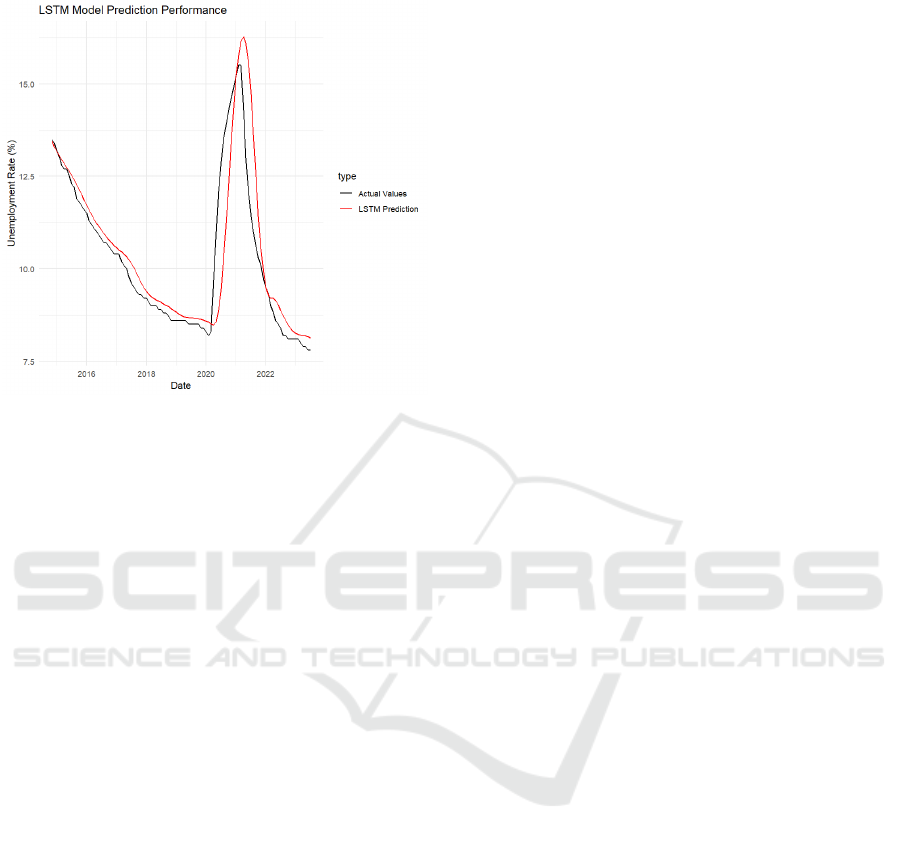
predictions. It demonstrated enhanced performance
compared to the ARIMA model.
Figure. 6 LSTM Model Prediction Performance. (Picture
credit: Original)
However, the LSTM model's predictions, as
shown in Figure. 6, exhibit a hysteresis quality,
indicating a lagged response to changes in the actual
unemployment rate data. This phenomenon can be
attributed to the model's design, which prioritizes
capturing long-term dependencies over immediate
adjustments to new trends. To improve the model's
responsiveness in the future, further research could
focus on refining the model architecture or optimizing
training parameters to better adapt to rapid changes in
economic conditions.
3.4 Comparison of Results
3.4.1 Intervention Analysis
The intervention analysis results indicated clear
differences in the impacts of major economic events
on youth unemployment rates. Specifically, the 2008
Financial Crisis: The unemployment rate increased
significantly during the crisis, as indicated by the
coefficient of 0.32035. The considerable effect of this
event on unemployment rates highlights the necessity
of including external shocks in predictive models. In
contrast, the 2020 Pandemic, with a coefficient of
0.01223186, indicates a negligible impact on the
unemployment rate, which may be due to government
interventions or other factors, such as stimulus
packages, employment subsidies, and targeted
economic support programs implemented during the
pandemic period, which effectively cushioning the
labor market from severe disruptions. The minimal
impact observed may reflect effective policy
interventions, highlighting the need for adaptive
forecasting approaches that account for such factors.
3.4.2 ARIMA Model
Through model selection based on AIC, the ARIMA
(3,1,2) model had the lowest AIC value, indicating it
was the best fit among the models tested and was
suitable for capturing linear relationships and
seasonal patterns present in youth unemployment
data. However, for its prediction Error: The RMSE of
3.51754016 on the test set suggests that the model's
predictions were not very accurate. The high RMSE
suggests limitations in addressing complex scenarios,
particularly when nonlinearities and structural breaks
exist within the historical data.
3.4.3 LSTM Model
In comparison to ARIMA, the LSTM model achieved
a notably lower RMSE of around 1.030382 on test
data. The lower RMSE indicates better performance
in capturing non-linear dynamics. This improved
accuracy highlights LSTM's strength in capturing
long-term nonlinear dependencies and complex
temporal patterns inherent in youth unemployment
rates. Nevertheless, despite its overall better
predictive capability, the LSTM model exhibited a
delayed response or hysteresis effect when reacting to
sudden shifts or structural changes in unemployment
trends.
3.5 Discussion
The results of this study highlight the importance of
selecting appropriate time series models based on the
complexity of the data. While ARIMA models are
effective for linear trends, LSTM models offer
superior performance in scenarios with non-linear
relationships. The intervention analysis underscores
the need to incorporate significant events into
forecasting models to improve accuracy. These
findings have implications for policymakers seeking
to improve their ability to foresee and make well-
informed choices regarding labor market initiatives.
4 CONCLUSIONS
This literature analyses the youth unemployment rate
data using various methods and provides valuable
insights into the trends and impacts of significant
events on the unemployment rate. The intervention
Comparative Analysis of Time Series Models for Forecasting the U.S. Unemployment Rate: A Study of ARIMA, LSTM, and Intervention
Approaches
377

analysis highlighted the significant impact of the
2008 financial crisis, while the 2020 pandemic had a
smaller and statistically insignificant impact. The
ARIMA model provided a baseline for forecasting,
but the LSTM model outperformed it in terms of
prediction accuracy, as indicated by the lower RMSE
value. The results suggest that deep learning models
like LSTM can be more effective for time series
forecasting in complex and non-linear scenarios. This
study has limitations in involving more related
control variables to forecast the unemployment rate in
the US because the unemployment rate is affected by
factors such as different genders, different races, and
the financial crisis period in 2008. If all these highly
correlated factors are included in this research, the
results should be more precise and accurate.
Therefore, the shortcoming of this research is not
taking into account all of these correlated control
variables. Additionally, as the LSTM exhibits a
hysteresis quality, other changes such as adjusting the
model architecture and improving data preprocessing
are required in future studies. In the future, this study
will verify more corresponding factors which perform
a big impact on the unemployment rate. Additionally,
more forecasting models like linear and non-linear
regression models would be applied to get the best-
performing model to predict the unemployment rate
so that governments and policymakers around the
world could look forward to future changes in the
unemployment rate and introduce relevant policies in
advance to stabilize the economic conditions.
REFERENCES
Barnichon, R., & Nekarda, C. J. (2012). The ins and outs of
forecasting unemployment: Using labor force flows to
forecast the labor market. Journal of Economic
Perspectives, 26(3), 45-66.
Douglas, S., & Zahed, M. (2024). Forecasting U.S.
unemployment rates using ARIMA: A time series
analysis from 1948 to 2019. SESUG 2024 Proceedings.
Retrieved from
https://sesug.org/proceedings/sesug_2024_SAAG/Pres
entationSummaries/Papers/148_Final_PDF.pdf
Dritsakis, N., & Klazoglou, P. (2018). Forecasting
unemployment rates in USA using Box-Jenkins
methodology. International Journal of Economics and
Financial Issues, 8(1), 9.
Gostkowski, M., & Rokicki, T. (2021). Forecasting the
unemployment rate: Application of selected prediction
methods. European Research Studies Journal,
XXIV(3), 985-1000.
Guerard, J., Thomakos, D., & Kyriazi, F. (2019). Automatic
time series modeling and forecasting: A replication case
study of forecasting real GDP, the unemployment rate,
and the impact of leading economic indicators. Cogent
Economics & Finance, 7(1), 1-20.
Guerard, J., Thomakos, D., & Kyriazi, F. (2020). Automatic
time series modeling and forecasting: A replication case
study of forecasting real GDP, the unemployment rate
and the impact of leading economic indicators. Cogent
Economics & Finance, 8(1), 1759483.
Montgomery, A. L., Zarnowitz, V., Tsay, R., & Tiao, G. C.
(1998). Forecasting the U.S. unemployment rate.
Journal of the American Statistical Association,
93(442), 478-493.
Xiao, H., Chen, R., & Guerard Jr, J. B. (2022). Forecasting
the U.S. unemployment rate: Another look. Wilmott
Magazine, November, 20-31.
Yurtsever, M. (2023). Unemployment rate forecasting:
LSTM-GRU hybrid approach. Journal for Labour
Market Research, 57(1), 1-9.
Zhong, S. (2023). The research and forecasts on real GDP
growth and the unemployment rate in the United States.
EMFRM, 2023, 159-165.
ICDSE 2025 - The International Conference on Data Science and Engineering
378
