
Short-Term Stock Price Forecasting Using ARIMA: A Case Study on
Apple and Amazon
Zikai Feng
a
Department of Athematics, The Chinese University of HongKong, HongKong, 999077, China
Keywords: ARIMA Model, Stock Price Prediction, Stock Market.
Abstract: In stock market, predicting stock price has attracted many researchers interest over years because of the non-
stationary and highly volatile nature of stock prices. Among various time series forecasting models, the Auto
Regressive Integrated Moving Average (ARIMA) model has been widely applied because of its ability to
capture the patterns for short term prediction. This study applies the Auto Regressive Integrated Moving
Average model to forecast Apple (AAPL) stock value and Amazon (AMZN) stock value. Using the Akaike
Information Criterion (AIC) to select the model that fits the best, and ARIMA (0,1,0) is found to be the best
option for both stocks. The Root Mean Square Error (RMSE) is used to estimate the accuracy of model
forecast. Result of this paper illustrate that ARIMA model exhibits an impressive aptitude for short-term stock
price predictions, offering a reference for future research and investment strategies. This study aims to
demonstrate the effectiveness of the ARIMA model in short-term stock value predicting, delivering a resource
for financial market analysts and financial institutions.
1 INTRODUCTION
With the rapid development of financial markets,
stock price prediction has become indispensable for
investment decision-making and risk management.
Stock prices exhibit complex characteristics such as
non-stationarity and nonlinearity, and high volatility
influenced by macroeconomic indicators,
geopolitical events, and irrational market behaviors
traditional analytical approaches often fail to capture
these dynamic patterns effectively (Devi, Sundar, &
Alli, 2013; Ariyo, Adewumi, & Ayo, 2014). Because
of their dependence on static assumptions, classic
analytical techniques like linear regression and
simple time-series models find it difficult to represent
the chaotic patterns created by these intricate
interactions. The Auto Regressive Integrated Moving
Average(ARIMA) model, proposed by Chen, has
been proven highly effective in handling financial
time series data with temporal dependencies. By
transforming non-stationary data into stationary
series after servals difference, the ARIMA model
would capture cyclical variations in the data and
provides short-term forecasts(Chen, 2022).
Stationarity, which requires constant mean, variance,
a
https://orcid.org/0009-0000-8778-7229
and autocorrelation structure over time, eliminates
spurious correlations caused by trends or seasonal
patterns, thereby allowing models to identify genuine
relationships within the data, using stationary data to
predict the stock price is more trustworthy (Dar et al.,
2024).
Several empirical investigations have been
conducted to assess the capacity for prediction of the
ARIMA model in the stock market. For example,
Almasarweh et al. applied an ARIMA (1,1,2) model
to predict Banking Stock Market Data and found that
the model performed well in forecasting the data
(Almasarweh & Wadi, 2018). Similarly Adebayo et
al. identified ARIMA (3,1,1) and ARIMA (1,1,4) as
optimal specifications for Botswana and Nigeria
markets, respectively (Adebayo, Sivasamy, &
Shangodoyin, 2014). Additionally, Adebiyi et al.
employed an ARIMA (2,1,0) model to predict the
Nokia Stock Index and an ARIMA (1,0,1) model for
the Zenith Bank Index, demonstrating that both
models effectively predicted stock price
movements(Adebiyi et al., 2014). These studies
emphasize the prediction capability of ARIMA model
by using stationary and accurate stock price.
366
Feng, Z.
Short-Term Stock Price Forecasting Using ARIMA: A Case Study on Apple and Amazon.
DOI: 10.5220/0013697500004670
Paper published under CC license (CC BY-NC-ND 4.0)
In Proceedings of the 2nd International Conference on Data Science and Engineering (ICDSE 2025), pages 366-371
ISBN: 978-989-758-765-8
Proceedings Copyright © 2025 by SCITEPRESS – Science and Technology Publications, Lda.
The aim of this paper is exploring application of
the ARIMA model in stock market price forecasting,
particularly its ability to predict short-term price
fluctuations. By doing so, this study seeks to provide
investors with an effective tool for short-term stock
price prediction, aiding them in making more rational
and efficient investment decisions.
The following is the framework of the paper.
Section 2 reviews the fundamental theory and
methodology of ARIMA model, as well as data
sources and model constructed. Section 3 describe the
forecast results obtained and the conclusions are
illustrated in section 4.
2 MODEL AND DATA
2.1 ARIMA Model
The ARIMA model is composed of different parts:
moving averages (MA), differencing (I), and
autoregression (AR).
The Equation (1) shows the equation for the
ARIMA model.
𝑦
= 𝜇+𝜙
𝑦
+𝜙
𝑦
+𝜙
𝑦
+ ⋯
+𝜙
𝑦
+ 𝜃
𝜀
+𝜃
𝜀
+⋯ 𝜃
𝜀
+𝜀
1
Where: 𝑦
is the time value of t, 𝜇 is the constant
mean, 𝜙
,
𝜙
,⋯, 𝜙
are the parameters for the
autoregressive terms, 𝜃
, 𝜃
,⋯,𝜃
are the
parameters for moving average terms, 𝜀
represents
the white noise (residuals) at time t.
The ARIMA model is a dynamic univariate
predictive method for predicting time series data.
Therefore, It is crucial for selecting a suitable model
to analyze stock price trends and provide sufficient
information for decision-making (Ganesan &
Kannan, 2021).
2.2 Data Resources
Yahoo Finance website is used in this study to gather
stock price data for Apple (AAPL) and Amazon
(AMZN) over the period of January 1st, 2020, to
December 31th, 2024. The dataset consists of the
following key components: Date, Open Value, High
Value, Low Value, Close Value, Adjusted Close
Value, and Volume.
The Adjusted Close price is selected as the main
variable for investigation. The adjusted closing price,
as opposed to the closing price, more closely
represents real market returns, as it accounts for
corporate actions such as dividends and stock splits,
thereby eliminating non-market factors that could
distort price movements. This approach enhances the
rigor and reliability of the analysis. The time frame
spanning January 1st, 2020, to December 1st, 2024,
is designated as the training set, while the period from
December 2nd, 2024, to December 31th, 2024, is
selected as the test set. By comparing the difference
between test set and the predicted value, such as
RMSE value, it provides a standard for judging the
model projections.
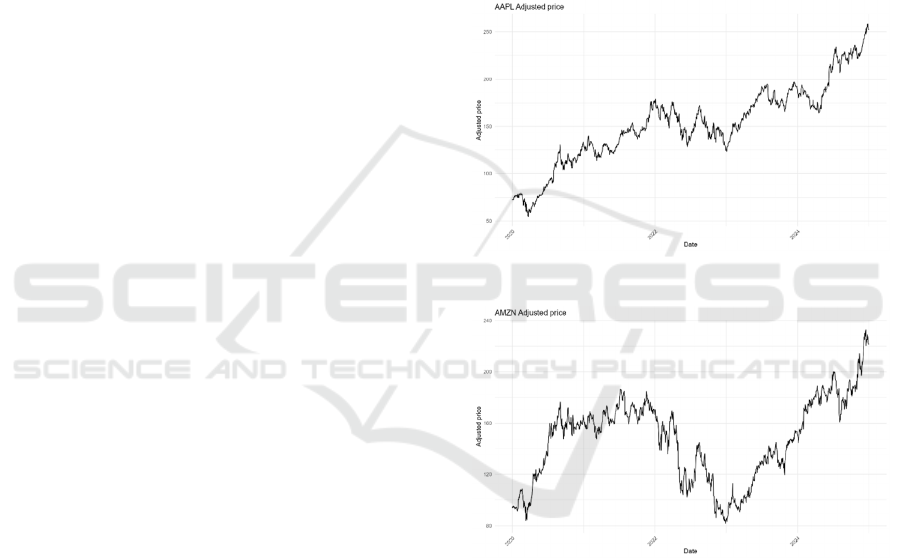
To visually illustrate the stock price trends of the
three companies, Figure 1 presents the AAPL price
trend, Figure 2 shows the AMZN price movement.
Figure 1: AAPL Adjusted price. (Picture credit: Original)
Figure 2: AMZN Adjusted price. (Picture credit: Original).
2.3 Model Construction
2.3.1 ARIMA (p, d, q) Model for APPL
Stock
Figure 3 is the ACF plot of the AAPL stock adjusted
price, this picture exhibits a slow decay, indicating
that the data is non-stationary.
Short-Term Stock Price Forecasting Using ARIMA: A Case Study on Apple and Amazon
367
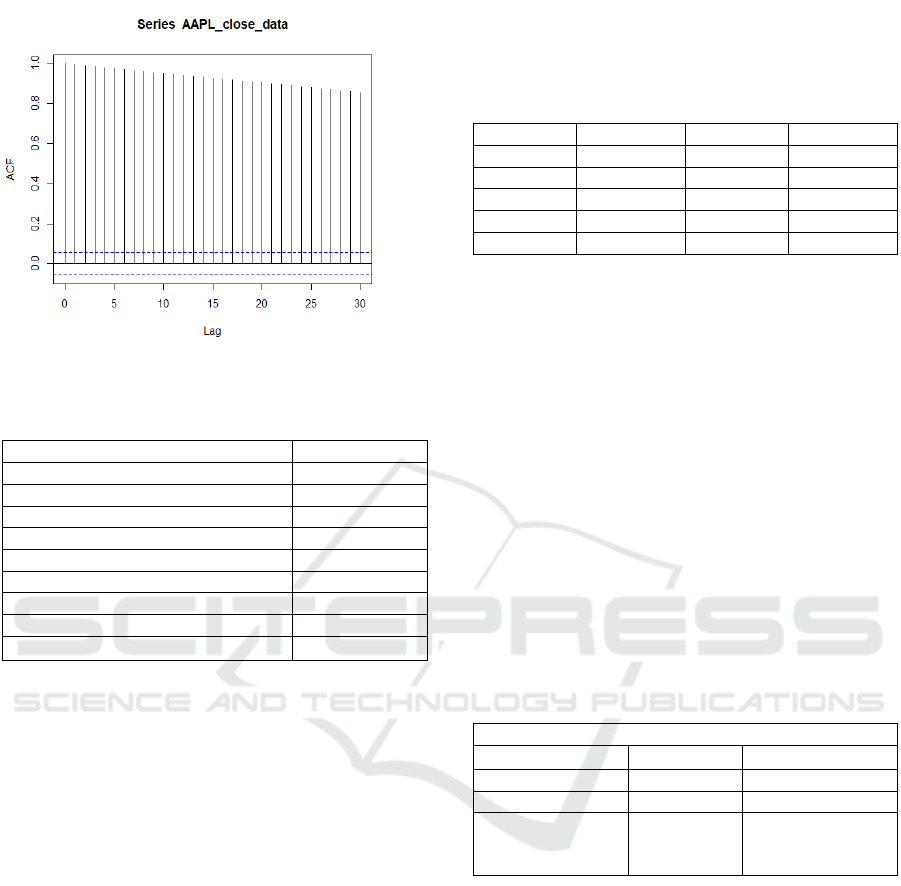
Figure 3: ACF of AAPL. (Picture credit: Original)
Table 1: ADF of AAPL Adjusted price.
Statistic Value
ADF Test Statistic -25.5625
1% value of Criticalit
y
-2.58
5% value of Criticalit
y
-1.95
10% value of Criticalit
y
-1.62
z.la
g
.1 Coefficient -1.03801
z.lag.1 Standard Erro
r
0.04061
R² 0.5079
F-Statistic 635.7
F-Statistic p-value < 2.2e-16
Utilizing the Augmented Dickey-Fuller (ADF)
test to determine if this data has reached stationarity
following the first difference(Dhyani et al., 2020).
The ADF test result verifies that the series is
stationary following the first difference, as table 1
illustrates that the test statistic (-25.5625) far below
the 1% critical value (-2.58). The unit root hypothesis
is rejected at the 99% confidence level (p < 0.001).
The best model was thought to be the ARIMA
model with the lowest AIC score, since the ARIMA
model can be constructed using different values of p,
d, and q to accommodate various time series
characteristics. The autoregressive order p represents
the order of the AR in the model, The number of times
the original time series is differentiated is indicated
by the difference order d, with the aim of satisfying
the stationarity assumption for the series, the moving
average order q symbolizes the order of the Moving
Average terms (MA) in model, which explains how
the real value and the forecast error at the previous q
time points are linearly related.
The parameter ranges for p, d, and q are restricted
from 0 to 2, because negative values are not
meaningful, and values exceeding 2 may lead to
unreliable parameter estimation(Mondal, Shit, &
Goswami, 2014).
Table 2: AIC value of different ARIMA model based on
AAPL data.
ARIMA AIC ARIMA AIC
(
1,0,0
)
5949.17
(
0,0,1
)
11063.27
(1,0,1) 5950.482 (0,1,2) 5936.885
(1,1,1) 5936.876 (0,1,0) 5933.821
(2,0,1) 5952.988 (0,2,0) 6804.786
(
2,1,1
)
5938.558
(
1,0,1
)
5935.519
ARIMA (0,1,0) is considered to be the best model
to predict the price of AAPL stock, as the value of this
model is the smallest in those models, with 5933.821.
Some AIC value of different models were listed in the
table 2. Table 3 illustrate the coefficient about
ARIMA (0,1,0) with drift. This model implies that at
each time step, the time series undergoes a fixed
change amount, combined with random fluctuations.
The ARIMA (0,1,0) with drift equation is given by
Equation (2)
𝑌
=𝑌
+ℎ×𝑐
2
Where: :𝑌
is the current stock price, ℎ is the
forecast time step, 𝑐 is the drift term (the fixed trend
value estimated by the model).
Table 3: Coefficients value of ARIMA (0,0,1) based on
AAPL data
ARIMA (0,1,0) with drift
Coefficient:
Drift
0.1330
S.E. 0.0757
sigma^2 = 7.097
log
likelihood =
-2964.37
AIC=5932.74
In figure 4 the residuals were checking with the
Ljung-Box test. The results show that the residuals
distribution is approximately normal, which means
the residuals were white noise and the fitted model
sufficiently explains the data, with no systematic
information remaining in the residuals. This model is
selected to forecast the APPL stock price from
December 2, 2024, to December 31.
ICDSE 2025 - The International Conference on Data Science and Engineering
368
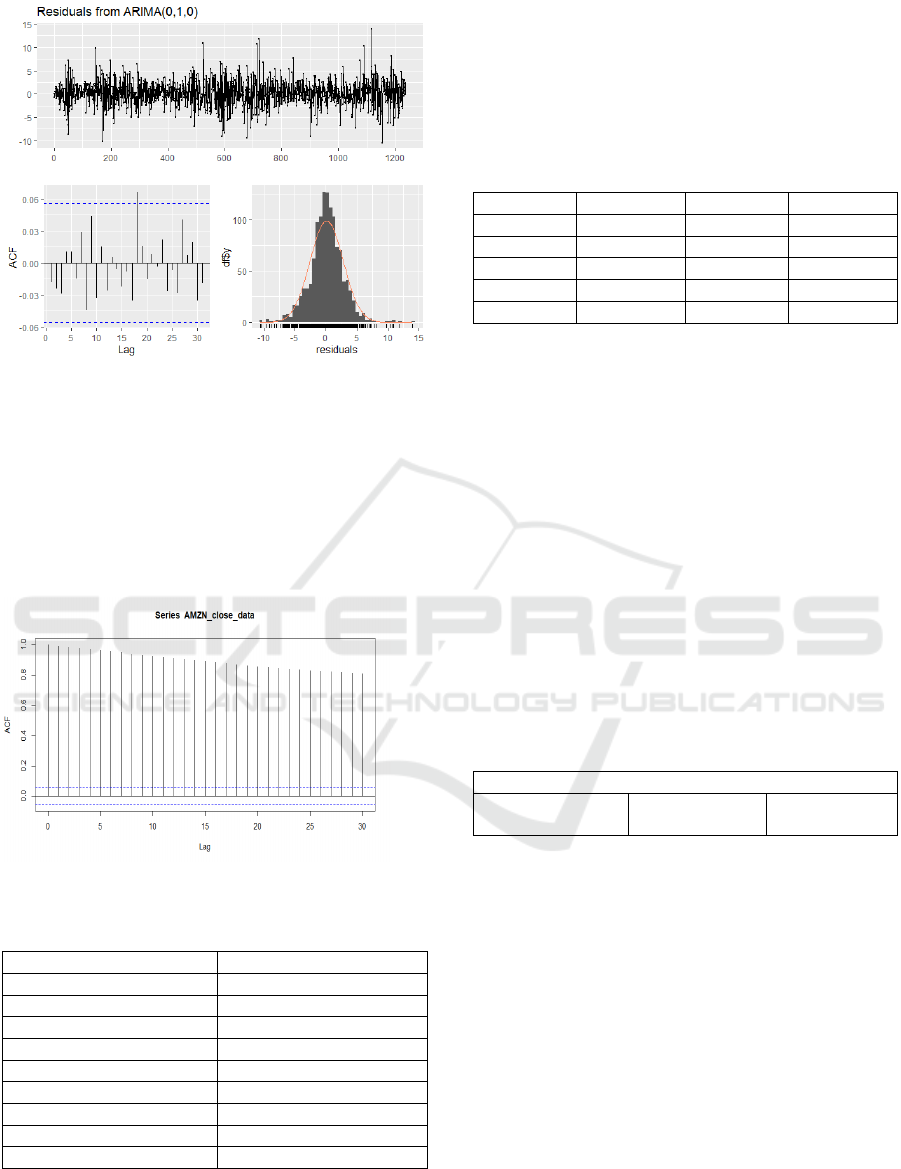
Figure 4: Residuals of ARIMA (0,1,0) based. (Picture
credit: Original)
2.3.2 ARIMA (p, d, q) Model for APPL
Stock
The Figure 5 exhibit a slowly dies down,
indicating that the AMZN data is non-stationary.
Following the first difference, the data's stationarity
is checked using the ADF test.
Figure 5: ACF of AMZN. (Picture credit: Original)
Table 4: ADF of AMZN data after first-difference.
Statistic Value
ADF Test Statistic -25.4769
1% value of Criticalit
y
-2.58
5% value of Criticalit
y
-1.95
10% value of Criticalit
y
-1.62
z.lag.1 Coefficient -1.03410
z.la
g
.1 Standard Erro
r
0.04059
R² 0.5077
F-Statistic 635.2
F-Statistic p-value < 2.2e-16
Table 4 shows the result of ADF test of AMZN
data after first-difference. It is cleared that the
standard error is 0.04059 and a lagged term
coefficient is -1.03410, which means the estimate is
deemed to be reasonably accurate. The AMZN stock
price after first-difference is a suitable set to design
an AIRMA model, as the F-statistic is 635.2 and the
p-value is much smaller than 0.05.
Table 5: AIC value of different ARIMA model based on
AMZN data.
ARIMA AIC ARIMA AIC
(
1,0,0
)
6334.658
(
0,0,1
)
10440.91
(1,0,1) 6336.521 (0,1,2) 6325.42
(1,1,1) 6325.463 (0,1,0) 6322.138
(
2,0,1
)
6338.182
(
0,2,0
)
7192.456
(
2,1,1
)
6327.25
(
1,0,1
)
6323.851
In table 5 illustrate the ARIMA (0,1,0) was
selected as the best fitted model to forecast the
AMZN stock price, since the AIC value of this model
is the smallest, with 6322.138. The Equation (3)
illustrates ARIMA (0,1,0) without drift equation
𝑌
=𝑌
+𝜖
3
Where: 𝑌
is the current value, 𝑌
is the value
from the previous time step, 𝜖
is the white noise
term, representing random error, usually following a
normal distribution N (0,𝜎
). It is noticeable that
there is a different between Equation (2) and
Equation(3) as it shows whether the model has a
deterministic temporal trend component or not.
Table 6: Coefficients value of ARIMA (0,1,0) based on
AMZN data
ARIMA (0,1,0)
sigma^2 = 9.733
log likelihood =
-3160.07
AIC= 6322.14
Table 6 presents the coefficients of the ARIMA
(0,1,0) model for AMZN stock prices. The ACF plot
in Figure 6 shows that most ACF values fall within
the confidence intervals, indicating no significant
autocorrelations in the residuals. Additionally, the
residuals follow a normal distribution and exhibit
white noise characteristics, suggesting that this model
effectively fits the stock price data. ARIMA (0,1,0)
model is selected to forecast the AMZN stock price.
Short-Term Stock Price Forecasting Using ARIMA: A Case Study on Apple and Amazon
369
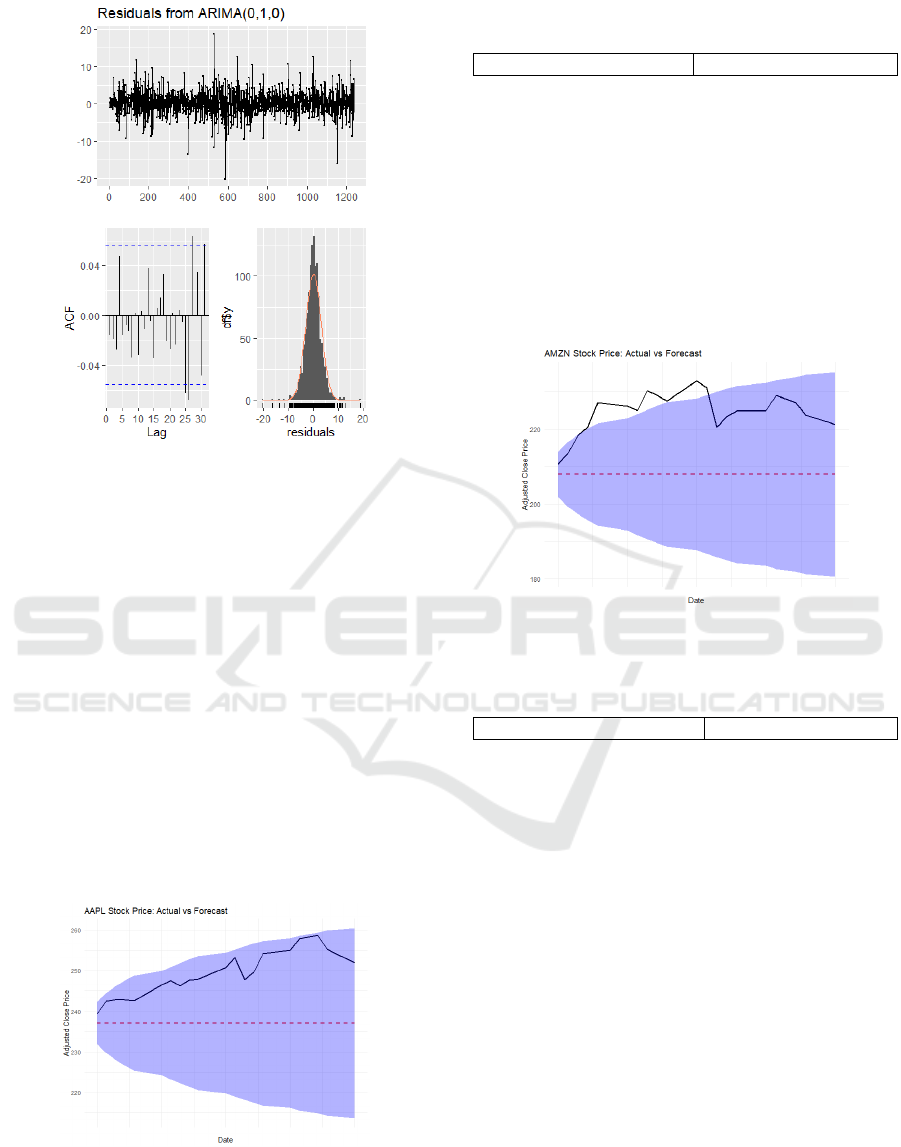
Figure 6: Residuals of ARIMA (0,1,0). (Picture credit:
Original)
3 RESULTS AND DISCUSSION
3.1 ARIMA (0,1,0) With Drift based on
APPL Data
The figure 7 illustrates the forecasted and actual
values of Apple's stock price from December 2, 2024,
to December 31, 2024, employing the ARIMA (0,1,0)
model. The 95% confidence interval is consisted of
areas shaded in blue, whereas the red line represents
the expected mean. The black line indicates the actual
stock prices. As observed, the actual values totally
fall within the predicted confidence interval. The
table 7 illustrates the RMSE value of this model is
13.092.
Figure 7: Forecast of APPL stock. (Picture credit:
Original)
Table 7: RMSE value of ARIMA (0,1,0) based on APPL
data
RMSE of ARIMA (0,1,0) 13.09234
3.2 ARIMA (0,1,0) based on AMZN
Data
The figure 8 illustrates that the actual AMZN stock
price (black line) mostly falls within the confidence
interval, suggesting the model effectively captures
market fluctuations. However, the predicted mean
(red dashed line) is noticeably lower than the actual
upward trend. The table 8 shows that the RMSE value
of this model is 17.34869.
Figure 8: Forecast of AMZN stock (Picture credit: Original)
Table 8: RMSE value of ARIMA (0,1,0) based on AMZN
data
RMSE of ARIMA
(
0,1,0
)
17.34896
4 CONCLUSIONS
Accurate stock price forecasting plays a vital role in
financial decision-making, helping investors navigate
market fluctuations with data-driven insights. This
study selected optimal ARIMA models to forecast
stock prices of Apple and Amazon, collecting
sufficient stock data from Yahoo Finance. By
employing the AIC for parameter optimization and
rigorous residual diagnostics to ensure model
validity, the analysis identifies ARIMA (0,1,0) with
drift is the most effective model for AAPL, while the
ARIMA(0,1,0) without drift is the optimal model for
AMZN. This can guide investors to make sensible
investment decisions. The results illustrate the
ARIMA model demonstrates exceptional capability
in short-term forecasting. However, given the
inherent limitations of ARIMA models, such as their
reliance on historical data and assumption of linear
relationships, future research may explore hybrid
ICDSE 2025 - The International Conference on Data Science and Engineering
370

models or machine learning techniques to enhance
forecasting accuracy and robustness.
REFERENCES
Adebiyi, A. A., Adewumi, A. O., & Ayo, C. K. (2014,
March). Stock price prediction using the ARIMA
model. In 2014 UKSim-AMSS 16th International
Conference on Computer Modelling and Simulation
(pp. 106-112). IEEE.
Adebayo, F. A., Sivasamy, R., & Shangodoyin, D. K.
(2014). Forecasting stock market series with ARIMA
model. Journal of Statistical and Econometric Methods,
3(3), 65-77.
Almasarweh, M., & Wadi, S. A. (2018). ARIMA model in
predicting banking stock market data. Modern Applied
Science, 12(11), 309-317.
Chen, Z. (2022). Asset allocation strategy with Monte-
Carlo simulation for forecasting stock price by ARIMA
model. In Proceedings of the 2022 13th International
Conference on E-Education, E-Business, E-
Management, and E-Learning (pp. 481-485).
Dar, A. A., Jain, A., Malhotra, M., Farooqi, A. R., Albalawi,
O., Khan, M. S., & Hiba. (2024). Time series analysis
with ARIMA for historical stock data and future
projections. Soft Computing, 28, 12531-12542.
Devi, B. U., Sundar, D., & Alli, P. (2013). An effective time
series analysis for stock trend prediction using ARIMA
model for Nifty Midcap-50. International Journal of
Computer Science, Engineering and Applications
(IJCSEA), 3(2), 13-26.
Dhyani, B., Kumar, M., Verma, P., & Jain, A. (2020). Stock
market forecasting technique using ARIMA model.
International Journal of Recent Technology and
Engineering (IJRTE), 8(6), 456-460.
Ganesan, A., & Kannan, A. (2021). Stock price prediction
using ARIMA model. International Research Journal of
Engineering and Technology (IRJET), 8(8), 1234-
1240.
Mondal, P., Shit, L., & Goswami, S. (2014). Study of
effectiveness of time series modeling (ARIMA) in
forecasting stock prices. International Journal of
Computer Science, Engineering and Applications, 4(2),
13-29.
Short-Term Stock Price Forecasting Using ARIMA: A Case Study on Apple and Amazon
371
