
Predictive Model for Heart-Related Issues Based on Demographic,
Societal, and Lifestyle Factors
Bindu Chandra Shekar Reddy, Pravallika Dharmavarapu, Roopal Dixit, Prudhvi Kodali,
Akanksha Ojha and Bonaventure Chidube Molokwu
a
Department of Computer Science, College of Engineering and Computer Science, California State University,
Sacramento, U.S.A.
Keywords:
Cardiovascular Disease Prediction, Machine Learning, XGBoost, Demography, Lifestyle, Hyperparameter
Tuning, Heart Disease.
Abstract:
This research predicts cardiovascular disease (CVD) risk by analyzing demographic, societal, and lifestyle
factors, supporting early intervention for conditions like heart attacks. With CVD causing around 17.9 million
deaths annually worldwide (WHO), there is a critical need for accessible, accurate predictive models. We
propose an XGBoost-based machine learning model trained on a 70,000-patient dataset enriched with features
such as median income, stress, and diet risk. After robust preprocessing and feature engineering—including
BMI and pulse pressure—the model achieves 73% accuracy, 76% precision, 68% recall, 72% F1-score, and
80% ROC-AUC. Key predictors include pulse pressure, cholesterol, and age, indicating that this multifactor
approach can enhance clinical decision-making and inform scalable health solutions.
1 INTRODUCTION
Cardiovascular diseases (CVDs) remain a leading
global cause of death. As real-world health data be-
comes more accessible, improving early detection and
prevention is increasingly vital despite advances in
medicine.Most traditional risk prediction models used
to assess heart disease risk tend to rely heavily on clin-
ical and physiological factors (Molokwu et al., 2021)
such as blood pressure, cholesterol, and glucose lev-
els; often neglecting important social and lifestyle in-
fluences such as stress, physical activity, or income
level. This limitation can lead to inaccurate assess-
ments, especially for the individuals whose risk pro-
files are shaped by the non-clinical circumstance.
Our work herein addresses this critical gap by
developing a ML-based system that predicts heart-
disease risk using a comprehensive set of features -
demographic (e.g. age, gender), societal (e.g. smok-
ing, alcohol use, income), and lifestyle-physiological
(e.g. cholesterol, glucose, BMI, stress, diet risk) vari-
ables. During our analyses, we observed that patients
with similar blood pressure and cholesterol levels of-
ten had vastly different predicted outcomes depending
on their lifestyle and income, and this highlights the
a
https://orcid.org/0000-0003-4370-705X
need for a more holistic model.
We developed a robust predictive pipeline utiliz-
ing 70,000 records from the Kaggle Cardiovascu-
lar Disease dataset. Feature engineering was con-
ducted to incorporate variables such as stress levels,
dietary risk, and estimated median income by ZIP
code, alongside physiological metrics like Body Mass
Index (BMI) and pulse pressure. Outliers in blood
pressure measurements were removed to enhance data
integrity. The XGBoost algorithm was selected for
its demonstrated efficacy and interpretability when
working with structured data. Data were partitioned
into training (80%) and testing (20%) sets, with all
variables standardized. Model performance was rig-
orously evaluated using metrics including accuracy,
precision, recall, F1-score, and ROC-AUC, comple-
mented by visualization tools such as ROC curves and
feature importance plots to facilitate interpretability.
Our novel contributions include: the integration of
multidimensional and synthesized features often over-
looked in standard models, a balanced and explain-
able ML pipeline, and the development of a prediction
tool that is readily available for mobile and web plat-
forms. Our results herein can support early clinical
interventions, help reduce healthcare disparities, and
inform public-health action strategies. Our findings
are targeted at both academic and applied audiences.
358
Reddy, B. C. S., Dharmavarapu, P., Dixit, R., Kodali, P., Ojha, A. and Molokwu, B. C.
Predictive Model for Heart-Related Issues Based on Demographic, Societal, and Lifestyle Factors.
DOI: 10.5220/0013692400003985
Paper published under CC license (CC BY-NC-ND 4.0)
In Proceedings of the 21st International Conference on Web Information Systems and Technologies (WEBIST 2025), pages 358-365
ISBN: 978-989-758-772-6; ISSN: 2184-3252
Proceedings Copyright © 2025 by SCITEPRESS – Science and Technology Publications, Lda.

2 REVIEW OF RELATED
LITERATURE
Heart disease prediction remains a crucial area of re-
search, since cardiovascular risk is shaped by not only
biological factors but also geography, social condi-
tions, and daily habits like diet, activity, and health-
care access. While traditional models focus on static
clinical indicators, recent advances in AI and ma-
chine learning enable more adaptive and comprehen-
sive prediction frameworks.
Recent work by (Patil, 2021) introduced a hy-
brid model combining deep learning (Mask R-CNN
for segmentation and feature extraction) with classi-
cal ML classifiers like Random Forest and Gaussian
Naive Bayes, achieving a high heart attack predic-
tion accuracy of 98.5%. Similarly, (Jin et al., 2018)
used artificial neural networks (ANN) on sequential
EHR data to capture temporal healthcare patterns. To-
gether, these studies underscore the effectiveness of
both ensemble and sequence-based models for im-
proving heart disease prediction accuracy.
(Shah et al., 2020) compared several supervised
ML classifiers—ANN, Decision Trees, SVM, Naive
Bayes, and Gradient Boosting—for heart disease pre-
diction, finding that Gaussian Naive Bayes achieved
the highest accuracy at 81.9%. Their findings high-
light the importance of choosing the right algorithm
based on data characteristics. Similarly, (Salhi et al.,
2020) and (Rajesh et al., 2018) demonstrated strong
predictive performance by ANN and Decision Trees.
(Srinivas et al., 2018) proposed hybrid ML strate-
gies to enhance prediction, while (Ranga and Rohila,
2018) conducted detailed parametric analyses to re-
veal strengths unique to each algorithm. Collectively,
these studies underscore that algorithm choice, fea-
ture selection, and robust preprocessing are critical to
building accurate and reliable heart disease prediction
models.
More research highlights that heart health depends
not only on medical factors but also on where peo-
ple live and their social environment. Differences
in risk factors like cholesterol and smoking between
U.S. and Asian populations emphasize the impor-
tance of including social determinants—such as in-
come, education, access to care, and diet—in predic-
tion models, rather than using a one-size-fits-all ap-
proach. (Oladimeji and Oladimeji, 2020) used classi-
fication algorithms like Random Forest, Naive Bayes,
and KNN to find out that predictive outcomes vary
significantly based on features such as smoking sta-
tus, serum composition, and ejection ratio (Oladimeji
and Oladimeji, 2020).
Further studies highlight that ensemble and hy-
brid modeling approaches can significantly improve
prediction accuracy, often surpassing 90% (Abdeld-
jouad et al., 2020; Rahman et al., 2018). By inte-
grating clinical, behavioral, and demographic data,
these models enable more personalized risk stratifica-
tion. Similarly, and (Oladimeji and Oladimeji, 2020)
others demonstrated that combining key health and
demographic indicators with ensemble ML methods
not only enhances model performance and adaptabil-
ity but also achieves consistently high precision and
accuracy rates above 90% (Dangare and Apte, 2012).
Other studies point out challenges like data im-
balance, missing values, and overfitting. (Srivastava
et al., 2020; Hazra et al., 2018) tackled these issues
with data preprocessing, including correlation matrix
filtering, PCA, and hybrid model tuning. Inspired by
this, our project uses Random Forest, Logistic Re-
gression, and XGBoost, along with geosocial data, to
predict heart disease effectively across diverse groups.
3 PROPOSED FRAMEWORK
AND METHODOLOGY
This study uses supervised learning with demo-
graphic, societal, and lifestyle-physiological features
to predict CVD risk, employing XGBoost to enable
accurate early detection and personalized interven-
tions.
3.1 Data
Training and learning herein is based on a dataset
comprising 70, 000 patient records suitable for model-
ing CVD-based risks. This dataset possesses a range
of patient-based features (Age, Height, Weight, Gen-
der, Systolic blood pressure, Diastolic blood pres-
sure, Cholesterol, Glucose, Smoking, Alcohol intake,
Physical activity, Presence or absence of cardiovas-
cular disease)which are important for deeper analysis
with reference to heart-related conditions. The dataset
did not have any missing values, but for future per-
spective of re-training, median value is used to fill any
null value if present. Each sample of features is asso-
ciated with a binary target indicating the presence (1)
or absence (0) of CVD.
3.2 Data Preprocessing and
Augmentation
The training and learning data is preprocessed and ad-
ditional features were synthesized and extracted from
the existent features of the dataset.
Predictive Model for Heart-Related Issues Based on Demographic, Societal, and Lifestyle Factors
359

Median-Income: This is computed by map-
ping the ZIP3 codes (941, 100, 787, 900, 606) to
USD68, 000 - USD85, 000 which reflects the socioe-
conomic variability for CVD risk.
MedianIncomeUSD = code(ZIP3) → Income
Stress: Computed as the normalized age and
systolic blood pressure (ap hi), so as to model
physiological and psychological strain for CVD
prediction.
Stress =
age
100
+
ap hi
200
Diet Risk: It is assigned 0.7, if the cholesterol
level is > 1 or it is assigned 0.3, if otherwise.
DietRisk =
(
0.7, if Cholesterol > 1
0.3, otherwise
3.3 Feature Extraction
Feature Extraction transforms raw-data features into
predictive features to ensure a balanced representation
of demographic, societal, and lifestyle-physiological
factors; thereby optimizing the dataset’s relevance
and computational efficiency for subsequent model-
ing. Herein, we devised the following, viz:
Body Mass Index (BMI): Computed as the stan-
dardized weight of a person with respect to their
height. It aids in assessing obesity-related CVD risk:
BMI =
Weight
(Height × 0.01)
2
Pulse Pressure: This feature encapsulates arterial
stiffness and cardiovascular strain which are both crit-
ical for predicting heart-releated disease.
Pulse Pressure = ap
hi
− ap
lo
3.4 Feature Selection
Twelve (12) features age, gender, cholesterol level,
glucose level, smoker, alcohol consumption, activ-
ity level, BMI, pulse pressure, median-income, stress,
and diet risk were selected to ensure a balanced rep-
resentation of demographic, societal, and lifestyle-
physiological factors which optimizes the dataset’s
relevance and computational efficiency.
Outlier Removal: The dataset is filtered to re-
tain only records with systolic blood pressure (80 <
ap hi < 250) and diastolic blood pressure (40 <
ap lo < 150); thereby eliminating physiologically im-
plausible values so as to ensure high data-quality for
CVD modeling.
Class Balancing with SMOTE: The Synthetic Mi-
nority Oversampling Technique (SMOTE) is applied
to address any potential class imbalance with respect
to the binary target class - 0 (no CVD) or 1 (yes CVD).
This methodology synthetically generates samples of
the minority class in a bid to mitigate bias and en-
hance predictive fairness.
3.5 Feature Scaling
Subsequently, Scalar Standardization is applied to
each of the twelve (12) selected features so as to main-
tain a unit-mean and unit-variance with respect to
each feature. Additionally, the dataset is split into two
(2) parts, viz: 80% for training and 20% for testing
with a fixed seeding so as to ensuring reproducibility
across varying experimental setups.
3.6 Feature Categorization
The dataset contains twelve (12) features, systemati-
cally categorized into three (3) groups, to reflect di-
verse influences on CVD risk:
Demographic Features:
• Age: Patient age in years, derived by dividing raw
age (in days) by 365.
• Gender: Binary encoding (0 for female, 1 for
male).
Societal Features:
• Smoker: Binary indicator of smoking status (0:
no, 1: yes).
• Alcohol consumption: Binary indicator of alcohol
consumption (0: no, 1: yes).
• Activity level: Binary indicator of physical activ-
ity (0: inactive, 1: active).
• Median-Income: Synthesized feature which as-
signs income levels (USD68,000 - USD85,000) to
sampled ZIP3 codes (941, 100, 787, 900, 606).
Lifestyle-Physiological Features:
• Cholesterol level: Categorical feature which de-
notes the level of blood cholesterol (1: normal, 2:
above normal, 3: well above normal).
• Glucose level: Categorical feature which denotes
the level of blood glucose (1: normal, 2: above
normal, 3: well above normal).
These features collectively depict a multidimen-
sional feature space with respect to CVD risk factors;
and thus, enabling robust predictive modeling.
WEBIST 2025 - 21st International Conference on Web Information Systems and Technologies
360

3.7 Machine Learning (ML) Algorithms
• Random Forest: An ensemble method that con-
structs multiple decision trees, h
1
(x). .. , h
n
(x),
and aggregates their results to improve accuracy
and prevent overfitting.
y = f
h
1
(x), h
2
(x), . .. , h
n
(x)
• Decision Tree: A tree-like model where decisions
are made by splitting the data, based on the fea-
ture space, so as to create the most homogeneous
branches. This splitting strategy is regulated via
the following:
Gini Impurity: Measures the probability of incor-
rectly classifying a randomly chosen element, if it
was randomly labeled according to the class dis-
tribution in a node.
Gini = 1 −
c
∑
i=1
(p
i
)
2
Entropy: Measures the amount of uncertainty or
randomness in the data at a node, and it is used to
quantify information gain during splitting.
Entropy = −
c
∑
i=1
p
i
· log
2
p
i
• K-Nearest Neighbors (KNN): A lazy learning
method that predicts a data point’s label based on
the majority class among its k−nearest neighbors
with respect to a distance metric (e.g. Euclidean
Distance).
Euclidean Distance, d
p,q
=
s
n
∑
i=1
(p
i
− q
i
)
2
• Logistic Regression: A statistical model that pre-
dicts the probability of a binary outcome using a
logistic (sigmoid) function.
P
(y = 1)|x
=
1
1 + e
−(β
0
+β
1
x
1
+...+β
n
x
n
)
• XGBoost Classifier: An optimized gradient-
boosting algorithm that builds decision trees, se-
quentially; thereby minimizing errors at each step
using regularization. Its primary objective func-
tion is denoted below such that l(y
i
, ˆy
i
) is a loss
function and Ω( f
k
) is the regularization on a given
tree, f :
Obj() =
n
∑
i=1
l(y
i
, ˆy
i
) +
∑
k
Ω( f
k
)
Ω( f ) = γT ( f ) +
1
2
λ∥w∥
2
• LightGBM Classifier: A gradient-boosting tech-
nique with respect to decision trees that uses a
leaf-wise tree growth strategy for faster training
and better accuracy. Its formalism is as denoted
below:
F
t
(x) = F
t−1
(x) + ηh
t
(x)
where F
t
(x) is the prediction at iteration t, η is the
learning rate, and h
t
(x) is the new tree trained to
predict the negative gradient of the loss function.
3.8 Model Training and Learning
Algorithms
Our benchmarking process employs multiple
ML classification algorithms configured with
hyperparameters, viz: learning
rate=0.1,
max depth=5,n estimators=200; and the bench-
mark algorithms have been optimized for logloss to
effectively address the binary classification task of
predicting CVD risk(s).
3.8.1 Hyperparameter Tuning
Our proposed methodology employs XGBoost classi-
fier, with hyperparameter tuning performed via grid-
search, to optimize performance. Table 1 below lists
the relevant parameters and hyperparameters explored
with respect to our model’s configuration. With the
aid of grid-search, we selected the best combination
of learning rate, max depth, and n estimators
based on ROC-AUC scoring; and this hyperparame-
ter combination is used to tune our proposed model
herein.
Other hyperparameters (e.g. subsample,
colsample bytree) of the XGBoost algorithm are
left at their base or default values.
3.8.2 Model Evaluation
Benchmark and comparative analysis of each trained
model is conducted by assessing each benchmark
model’s performance against the Test set based on a
comprehensive suite of metrics, viz: Accuracy, Pre-
cision, Recall, F1-score, and ROC-AUC. The goal is
to provide a holistic view of each benchmark model’s
predictive capability. Decision thresholds (0.3, 0.4,
0.5, 0.6) are evaluated on probability outputs to iden-
tify the threshold maximizing Accuracy, thereby fine-
tuning predictions to enhance classification perfor-
mance and address potential imbalances with respect
to Sensitivity and Specificity.
Predictive Model for Heart-Related Issues Based on Demographic, Societal, and Lifestyle Factors
361
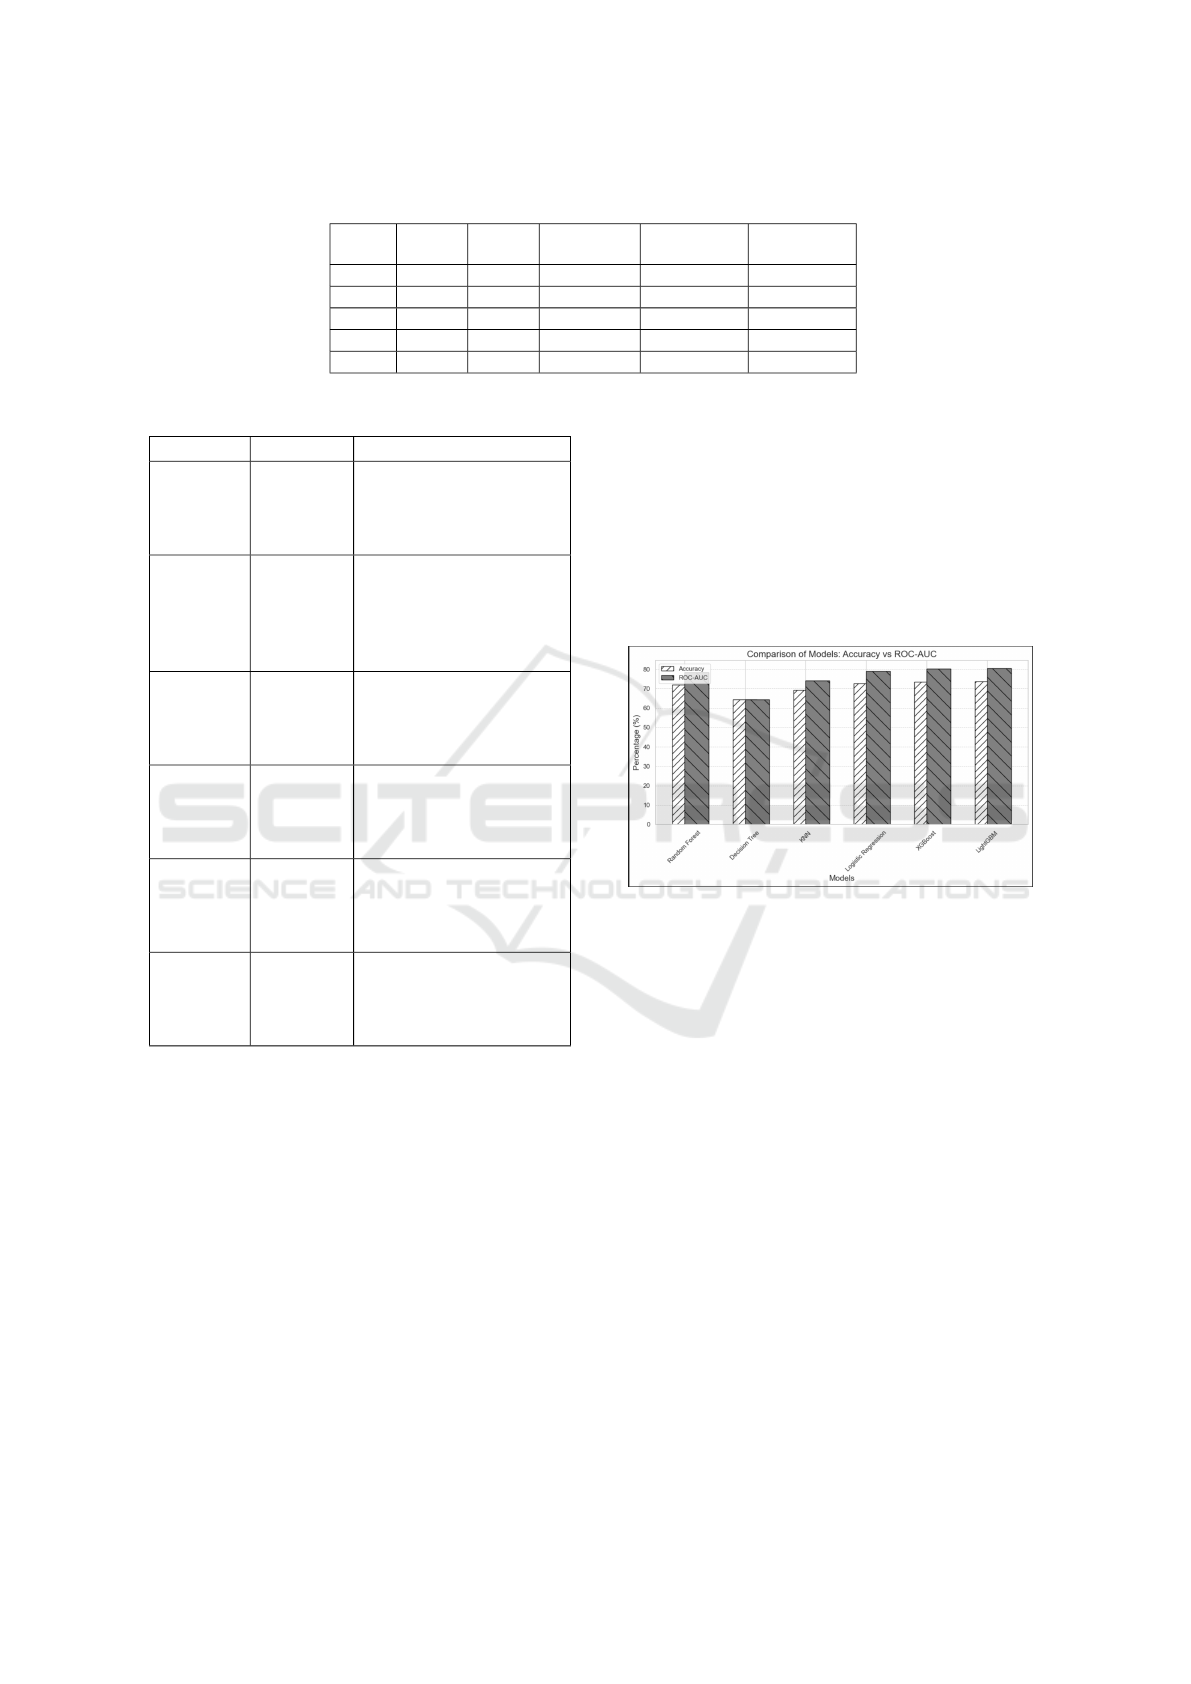
Table 1: Configuration of Hyperparameters.
Rank
Learn
Rate
Max.
Depth
No. of Es-
timators
Mean Test
ROC-AUC
Std. Test
ROC-AUC
1 0.2 3 100 0.79976 0.00361
2 0.01 7 300 0.79930 0.00406
3 0.01 5 300 0.79914 0.00394
4 0.01 7 200 0.79889 0.00415
5 0.01 5 200 0.79771 0.00408
Table 2: Comparison Models: Accuracy vs ROC-AUC.
Function Type Description
Log Loss Objective
(Training)
Binary cross-entropy loss
minimized during XG-
Boost training for binary
classification.
ROC-AUC Evaluation
Metric
Area under the ROC
curve, used as the scoring
metric in GridSearchCV
to optimize hyperparam-
eters.
Accuracy Evaluation
Metric
Proportion of correct pre-
dictions, assessing over-
all model correctness (re-
ported as 0.73).
Precision Evaluation
Metric
Ratio of true positives to
predicted positives, eval-
uating prediction reliabil-
ity (reported as 0.76).
Recall Evaluation
Metric
Ratio of true positives to
actual positives, measur-
ing sensitivity (reported
as 0.68).
F1-Score Evaluation
Metric
Harmonic mean of preci-
sion and recall, balancing
both metrics (reported as
0.72).
4 EXPERIMENTAL RESULTS
Table 3 denotes the performance of Benchmarking
six machine learning models, LightGBM achieved the
highest performance (Accuracy: 73.72%, ROC-AUC:
80.40%), closely followed by XGBoost (Accuracy:
73.50%, ROC-AUC: 80.24%). Logistic Regression
remained competitive with 72.61% Accuracy and a
strong ROC-AUC of 79.09%. Random Forest pro-
vided balanced results (72.09% Accuracy, 78.26%
ROC-AUC) but lagged slightly behind the boosting
models. K-Nearest Neighbors (KNN) showed mod-
erate effectiveness (69.17% Accuracy, 74.01% ROC-
AUC), while Decision Tree performed the poorest
(Accuracy and ROC-AUC: 64.34%), likely due to
overfitting and limited generalizability.
In terms of Precision and Recall trade-offs, Logis-
tic Regression and LightGBM achieved the highest
precision scores (75.39% and 75.82%, respectively),
demonstrating their strength in minimizing false posi-
tives. LightGBM and XGBoost both maintained high
F1-Scores (around 72.6% to 72.67%), indicating a
strong balance between Precision and Recall, whereas
Decision Tree and KNN showed lower F1-Scores, re-
flecting inconsistencies between the two metrics.
Figure 1: Comparison Models : Accuracy vs ROC-AUC.
The reasons behind the superior performance of
LightGBM and XGBoost can be attributed to their
boosting mechanisms, which build strong learners it-
eratively by focusing on the mistakes of previous
models. The top hyperparameters for the XGBoost
CVD model mostly employ a small learning rate
(0.01), medium-to-deep trees (max depth 5 . . . 7), and
high estimators (200 . . . 300), or alternatively a higher
learning rate (0.2) with a shallower tree (depth 3) and
fewer estimators (100). These hyperparameter com-
binations achieved ROC-AUC scores ≈ 0.799, indi-
cating a very strong and stable model performance.
Our model generalizes well by capturing complex
feature interactions and using regularization. Logis-
tic Regression performed strongly for linear patterns,
while Random Forest did not outperform other mod-
els in this context. KNN had moderate results, likely
due to feature sensitivity, and Decision Trees strug-
gled due to overfitting without ensembling.
Based on these findings, LightGBM is recom-
mended as the top-performing model for deployment
or further refinement, thanks to its superior predic-
WEBIST 2025 - 21st International Conference on Web Information Systems and Technologies
362
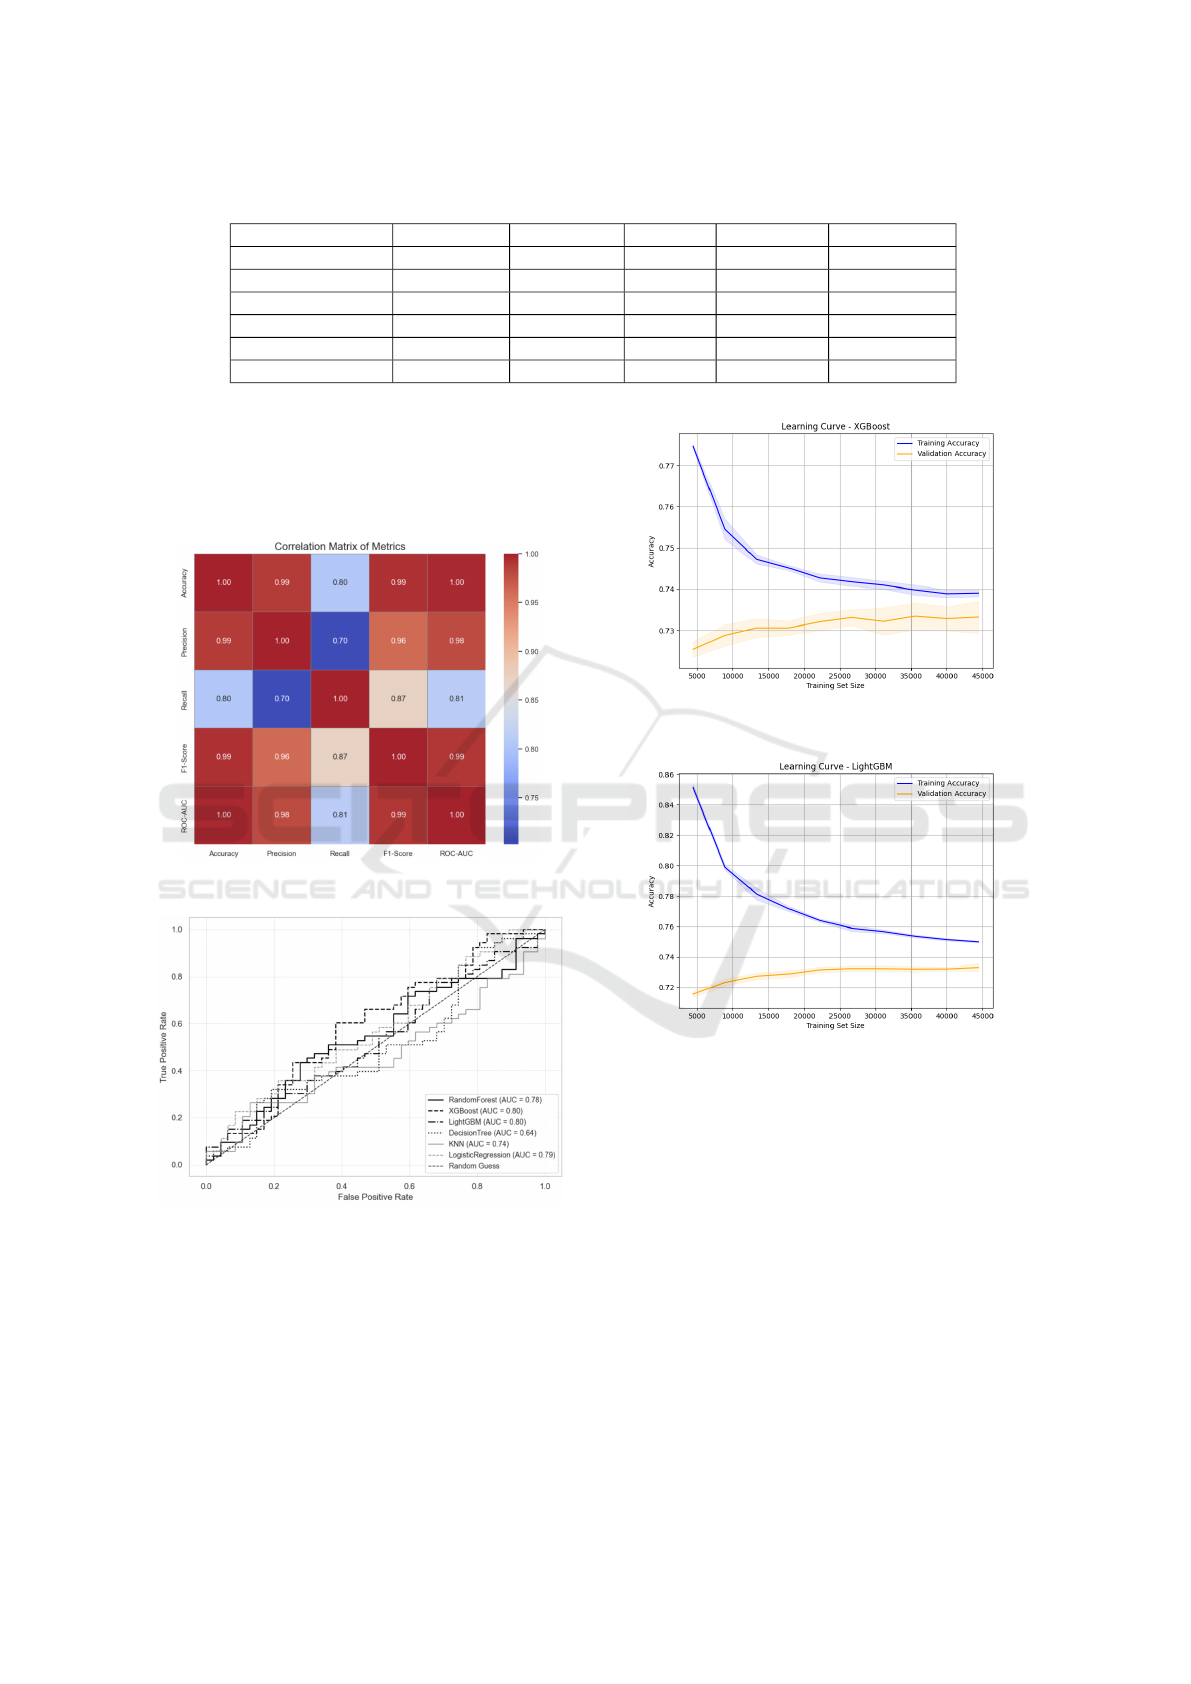
Table 3: Model Performance.
Model Accuracy (%) Precision (%) Recall (%) F1-Score (%) ROC-AUC (%)
Random Forest 72.09 72.61 71.09 71.84 78.26
Decision Tree 64.34 64.23 64.97 64.60 64.34
K-Nearest Neighbors 69.17 69.62 68.21 68.91 74.01
Logistic Regression 72.61 75.39 67.26 71.09 79.09
XGBoost 73.50 75.24 70.19 72.63 80.24
LightGBM 73.72 75.82 69.78 72.67 80.40
tive accuracy across key metrics. XGBoost is also a
strong alternative, offering comparable results along
with valuable interpretability tools. Logistic Regres-
sion remains a reliable baseline, particularly when
model simplicity and transparency are prioritized.
Figure 2: Correlation Matrix.
Figure 3: ROC-AUC Curve.
5 IMPLICATIONS AND MERITS
OF THE RESEARCH
The evaluated ML models showed strong CVD risk
prediction. LightGBM and XGBoost led with a mean
ROC-AUC of 0.80, followed by Logistic Regression
Figure 4: Learning Curve XGBoost.
Figure 5: Learning Curve LightGBM.
at 0.79. Tuning XGBoost’s hyperparameters further
improved its ROC-AUC to 0.7998 with low variance
(Std = 0.0036), demonstrating both high accuracy and
consistency. These results underscore the practical
value of advanced ML models for reliable CVD risk
assessment.
5.1 Implications
• Early Risk Detection: LightGBM and XGBoost
achieve high ROC-AUC (0.80), enabling accurate
identification of at-risk individuals and supporting
early interventions. Their balanced confusion ma-
trices further reduce false results, enhancing clin-
ical decision-making.
Predictive Model for Heart-Related Issues Based on Demographic, Societal, and Lifestyle Factors
363

• Key Predictors: XGBoost identified stress, diet,
cholesterol level, and age as significant key risk
factors; and these are consistent with current med-
ical understanding. These strong feature correla-
tions can help guide clinicians to prioritize inter-
ventions such as stress management and dietary
changes.
• Stable Configurations: Moderate hyperparam-
eter settings promote stable, generalizable pre-
dictions across populations, while higher values
(e.g., learning rate=0.3, max depth=7, estima-
tors=300) risk overfitting and lower ROC-AUC
(0.7735). This underscores the need for careful
hyperparameter tuning.
• Cost-Effective Options: Logistic Regression’s
strong performance (ROC-AUC = 0.79) offers a
simple, viable alternative for resource-limited en-
vironments; and still maintain reasonable level of
accuracy without complexities.
5.2 Benefits
• Clinical Integration: Using routinely collected
data (age, cholesterol, stress, diet, etc.), our pro-
posed model(s) can be integrated into Electronic
Health Records (EHR) to stratify patients, priori-
tize high-risk cases, and tailor interventions; thus,
this ultimately leads to improved medical reach
and proactivity.
• Transformative Impact: By leveraging medi-
cal, societal, demographic, and lifestyle data, our
proposed model(s) can predicts CVD risk(s) with
Precision, reducing its 17.9 million annual deaths
(as reported by WHO). It addresses health dispar-
ities through equitable predictions and optimizes
healthcare resources via preventive care - benefit-
ing both developed and developing regions.
6 CONCLUSION AND FUTURE
WORK
This research developed a predictive model for iden-
tifying individuals at risk of heart disease by inte-
grating demographic, societal, and lifestyle data. By
leveraging machine learning algorithms on structured
health data, the study demonstrated that including
non-clinical factors can yield accurate and actionable
risk predictions to support early intervention.
Of the algorithms evaluated, LightGBM emerged
as the top performer in terms of accuracy, precision,
and recall, making it the recommended choice for de-
ployment or further refinement. XGBoost also deliv-
ered strong results, with the added advantage of inter-
pretability features. For cases where model simplicity
and transparency are priorities, Logistic Regression
serves as a robust and interpretable alternative.
6.1 Limitations
Despite the success of the initial implementation, sev-
eral limitations must be acknowledged:
• Dataset Constraints: The model was trained and
evaluated using only a single benchmark dataset,
such as the cardio train Heart Disease dataset.
While this dataset is widely used, it may not
fully represent the range of heart-related condi-
tions found in diverse populations across differ-
ent regions. This poses a challenge to the model’s
generalizability and real-world applicability.
• Limited Feature Scope: Although the model in-
corporates a range of demographic, societal, and
lifestyle factors, it currently lacks access to more
detailed clinical data such as ECG signals, choles-
terol levels, blood pressure, or family medical his-
tory. Including these features could significantly
enhance prediction accuracy and deepen risk as-
sessment.
• Model Interpretability: Although we experi-
mented with interpretable models like decision
trees, the final model relies on ensemble meth-
ods such as Random Forest and XGBoost. These
models are known for their high performance but
are often considered “black-box” models, which
can hinder transparency and trust, especially in
sensitive domains like healthcare.
6.2 Future Work
We aim to improve our model by addressing its cur-
rent limitations and expanding its capabilities. The
primary goals is to train and validate the model on
more diverse datasets that encompass a wider range of
backgrounds to improve its generalizability.We also
plan to incorporate clinical health indicators such as
cholesterol levels, blood pressure, ECG readings, and
genetic predispositions, which would allow for a more
holistic and accurate prediction of heart-related risks.
Integrating AI interpretability tools will help clin-
icians understand and trust model predictions. Con-
necting the model to an iOS app that uses Apple
Watch sensor data—such as heart rate, activity, and
ECG—can boost its reach and utility. With real-time
physiological data, the app can offer dynamic, per-
sonalized CVD risk assessments and make preven-
tive care widely accessible, especially for underserved
WEBIST 2025 - 21st International Conference on Web Information Systems and Technologies
364

populations. The app would deliver clear, actionable
lifestyle guidance, support habit change, and gener-
ate new data to further refine predictions and adapt
to evolving health trends. This combined approach
advances health equity, drives ongoing research, and
helps address the global burden of heart disease.
REFERENCES
Abdeldjouad, F. Z., Brahami, M., and Matta, N. (2020). A
hybrid approach for heart disease diagnosis and pre-
diction using machine learning techniques. The Im-
pact of Digital Technologies on Public Health in De-
veloped and Developing Countries, 12157:299 – 306.
Dangare, C. S. and Apte, S. S. (2012). A data mining ap-
proach for prediction of heart disease using neural net-
works. Journal of Economics.
Hazra, A., Mukherjee, A., Gupta, A., Mukherjee, A., Kr-
ishnaiah, V., Narsimha, G., Chandra, N. S., Hu, G.,
Root, M. M., Naidu, A., kumar Dwivedi, A., Shahi,
M., and Gurm, R. K. (2018). A review on heart dis-
ease prediction using machine learning and data an-
alytics approach. International Journal of Computer
Applications.
Jin, B., Che, C., Liu, Z., Zhang, S., Yin, X., and Wei, X.
(2018). Predicting the risk of heart failure with ehr
sequential data modeling. IEEE Access, 6:9256–9261.
Molokwu, B. C., Shuvo, S. B., Kobti, Z., and Snowdon, A.
(2021). A multi-task learning framework for covid-19
monitoring and prediction of ppe demand in commu-
nity health centres. arXiv.
Oladimeji, O. O. and Oladimeji, O. (2020). Predicting sur-
vival of heart failure patients using classification algo-
rithms.
Patil, P. B. (2021). Heart attack detection based on mask
region based convolutional neural network instance
segmentation and hybrid classification using machine
learning techniques.
Rahman, M. J.-U., Sultan, R. I., Mahmud, F., Shawon, A.,
and Khan, A. (2018). Ensemble of multiple models
for robust intelligent heart disease prediction system.
2018 4th International Conference on Electrical Engi-
neering and Information & Communication Technol-
ogy (iCEEiCT), pages 58–63.
Rajesh, N., T, M., Hafeez, S. A., and Krishna, H. (2018).
Prediction of heart disease using machine learning al-
gorithms. International Journal of Engineering &
Technology.
Ranga, V. and Rohila, D. (2018). Parametric analysis of
heart attack prediction using machine learning tech-
niques. International Journal of Grid and Distributed
Computing, 11:37–48.
Salhi, D. E., Tari, A., and Kechadi, M. T. (2020). Using
machine learning for heart disease prediction. In Com-
munication Systems and Applications.
Shah, D., Patel, S. B., and Bharti, S. K. (2020). Heart dis-
ease prediction using machine learning techniques. SN
Computer Science, 1.
Srinivas, V., Aditya, K., Prasanth, G., G.Babukarthik, R.,
Satheeshkumar, S., and Sambasivam, G. (2018). A
novel approach for prediction of heart disease: Ma-
chine learning techniques. International Journal of
Engineering & Technology.
Srivastava, D. K., Choubey, K., and Choubey, D. K. (2020).
Heart disease prediction using machine learning and
data mining. International Journal of Recent Technol-
ogy and Engineering.
Predictive Model for Heart-Related Issues Based on Demographic, Societal, and Lifestyle Factors
365
