
Health-Aware Charging of Li-Ion Batteries Using MPC and Bayesian
Degradation Models
Taranjitsingh Singh
a
, Jeroen Willems
b
, Bruno Depraetere
c
and Erik Hostens
d
MotionS, Flanders Make, Lommel, Belgium
fi fl
Keywords:
Model Predictive Control (MPC), Health-Aware Charging, Lithium-Ion Batteries, Bayesian Networks.
Abstract:
We propose a Model Predictive Control (MPC) approach for health-aware optimal charging of Lithium-ion
Nickel Manganese Cobalt (Li-NMC) batteries. Our method integrates electrical, thermal, and degradation
models using Bayesian Networks (BNs) to estimate the battery’s State of Health (SOH). These models are
embedded into an MPC framework to generate charging profiles that reduce long-term degradation while
ensuring fast charging performance. Validation is performed through high-fidelity simulations using the
PyBaMM battery modeling environment. Results show improved SOH retention compared to conventional
Constant Current-Constant Voltage (CC-CV) strategy.
1 INTRODUCTION
The electric vehicle (EV) market, particularly the
part using Lithium-ion Nickel Manganese Cobalt (Li-
NMC) batteries, is experiencing significant growth,
with forecasts indicating continued expansion in the
coming decades. In 2023, nearly 14 million electric
cars were sold globally, making up 18% of all EV
sales worldwide, indicating a growing trend in sales.
This upward trend is expected to continue, with key
markets like China, Europe, and the United States at
the forefront. As the market expands, the demand for
charging infrastructure is also anticipated to rise sub-
stantially. To support the increase in electric vehicles,
the number of public charging stations will need to
grow sixfold by 2035 (Agency, 2024).
Despite advancements, range anxiety and battery
aging continue to be significant obstacles to broader
EV adoption. Enhancing charging infrastructure is
essential, but reducing charging times is equally criti-
cal. A smart and fast charging strategy aims to reduce
charging time while preserving lithium-ion battery
lifespan. This requires precise regulation of charg-
ing currents within physical limits to avoid conditions
that could cause rapid, unwanted degradation of batter-
ies or, in extreme cases, thermal runaway. Developing
a
https://orcid.org/0000-0003-3255-3796
b
https://orcid.org/0000-0002-2727-6096
c
https://orcid.org/0000-0003-2011-3857
d
https://orcid.org/0000-0003-2482-7523
such a fast charging strategy for EVs with Li-NMC bat-
teries is a complex and resource-intensive task (Was-
siliadis et al., 2023).
The standard fast charging protocols used in
EVs have long been the classical Constant-Current
Constant-Voltage (CC-CV) method (Abdollahi et al.,
2016). To mitigate the risk of degradation, these proto-
cols have been extended to include multiple CC phases
along with a CV phase (MCC) (Li et al., 2020). Ad-
ditionally, researchers have explored methods that de-
liver high C-rate pulses to further preserve battery
health (Qin et al., 2022). However, while these meth-
ods perform well for slow charging, they are inherently
static and fail to provide a charging profile that ac-
counts for the preservation of battery health (Lu et al.,
2024).
As previously mentioned, smart fast charging
presents the challenge of balancing charging times
with battery degradation, which can affect the long-
term State-of-Health (SOH) of EV batteries (Agency,
2024). Extensive reviews on fast charging meth-
ods, particularly for EVs, have been conducted by
researchers, as noted in (Tomaszewska et al., 2019).
Their discussions highlight the impact of overcharging
on battery degradation. Most fast charging algorithms
prioritize avoiding thermal runaways, which leads to
a focus on the design part of thermal management
rather than the algorithms themselves (Tomaszewska
et al., 2019). In the realm of charging algorithm in-
vestigations, the research predominantly depends on
degradation models, which are empirical-based meth-
Singh, T., Willems, J., Depraetere, B. and Hostens, E.
Health-Aware Charging of Li-Ion Batteries Using MPC and Bayesian Degradation Models.
DOI: 10.5220/0013691400003982
Paper published under CC license (CC BY-NC-ND 4.0)
In Proceedings of the 22nd International Conference on Informatics in Control, Automation and Robotics (ICINCO 2025) - Volume 1, pages 37-46
ISBN: 978-989-758-770-2; ISSN: 2184-2809
Proceedings Copyright © 2025 by SCITEPRESS – Science and Technology Publications, Lda.
37

ods and so their performance can only be tested for
a limited range of chemistries (Tomaszewska et al.,
2019; Erdinc et al., 2009).
Despite these difficulties in modeling, incorporat-
ing battery degradation into fast charging algorithms
is essential. Battery degradation is a complex pro-
cess resulting from multiple mechanisms within the
battery chemistry. Some of the key mechanisms in-
clude the formation of a solid electrolyte interphase
(SEI) layer on the anode surface, lithium plating
−
where lithium ions from the electrolyte are deposited
as metallic lithium on the anode
−
and the loss of
active materials (Birkl et al., 2017). Fast charging
and high currents lead to elevated temperatures, which
accelerate these degradation processes, subsequently
increasing the anode potential which must be avoided
when designing charging profiles.
Advanced health-aware fast charging algorithms
exist, where researchers have dived into the use of
Model Predictive control (MPC) techniques by includ-
ing these degradation models in the optimization. One
of the first MPC techniques considered for optimal
charging dates back to 2011, where the researchers uti-
lized advanced degradation models (Wassiliadis et al.,
2023; Klein et al., 2011). Although these models are
derived from accurate electrochemical models, they
are inherently complex involving multiple states. Con-
sequently, identifying model parameters, or estimating
the intermediate states presents a significant compu-
tational challenge. Therefore, the studies conducted
in (Xavier and Trimboli, 2015; Xavier et al., 2020)
employ a reduced-order model of the battery, which is
derived from a complex electrochemical model.
In this paper, we use a Bayesian Network (BN)
model that relies on the degradation drivers rather than
using the electrochemical model states, along with a
model for battery and electro-thermal dynamics. This
method stands in contrast to the one presented in (Lu
et al., 2024) which employs a deterministic parametric
state-space model for degradation. The key advantage
of our approach is its ability to account for stochastic
variations. This method can also be applied in closed-
loop simulations to achieve more accurate degradation
estimates. Our novelty is in framing the optimal health-
aware charging problem as a Nonlinear MPC problem
using the BN predicted distributions and conducting
realistic high-fidelity simulations for validation.
The article is organized as follows. Section 2 de-
tails the proposed models and estimators. Section 3
outlines the formulation of the MPC problem for
health-aware charging control. Section 4 presents the
validated results, and finally, Section 5 draws the con-
clusions of this article and provides insights on future
research directions.
2 MODELING APPROACH
Figure 1 explains the interconnected modeling frame-
work necessary for health-aware charging optimiza-
tion. It highlights three necessary models: the Battery
Model, the Electro-Thermal Model, and the State of
Health Model, which collectively govern the behavior
and performance of a battery (Wassiliadis et al., 2023).
The Battery Model simulates the relationship between
the State of Charge (SOC) and the battery’s voltage.
The Electro-Thermal Model models the temperature
variations, and interactions of temperature with SOC
and the SOH. Lastly, the SOH model includes the long-
term degradation of the battery, taking into account the
operating conditions and impact of various charging
strategies.
Figure 1: Coupling and interconnected framework required
for health-aware charging (Wassiliadis et al., 2023).
This section provides the detailed descriptions of
these three models.
2.1 Battery Model
The battery dynamics are modeled using a first-
order Resistance-Capacitance (RC) Equivalent Circuit
Model (ECM). This describes the relationship between
the overpotential
o
k
and the terminal voltage
y
k
, as a
function of the current
u
k
. This influence is a function
of resistances and capacitances that vary with parame-
ters such as the SOC
s
k
and temperature
T
k
. Therefore,
the dynamic behavior of
T
k
and
s
k
will be modeled
as well: for
T
k
this will be done in the thermal model
in the next section, but the evolution of
s
k
is added
here to the ECM model. This yields an overall battery
model with states x
ECM
= [s
k
,o
k
]
T
given by:
ECM
s
k+1
o
k+1
=
1 0
0 θ
1
s
k
o
k
+
∆t
Q
k
θ
2
u
k
y
k
= o
k
+V
OCV
(s
k
,T
k
) + θ
3
u
k
(1)
Herein,
Q
k
expresses the battery’s total capacity,
V
OCV
(
s
k
,T
k
) expresses the open-circuit-voltage (OCV)
as a function of current, and
θ
1
,
θ
2
and
θ
3
express
gains depending on resistances and capacitances that
vary over time as a function of
s
k
and
T
k
. As a result,
this becomes a Linear Parameter Varying – Input Out-
ICINCO 2025 - 22nd International Conference on Informatics in Control, Automation and Robotics
38

put (LPV-IO) model. We have used experimental logs
of voltages, current, temperature, and SOC, to identify
these model parameters in multiple conditions using
the methodology as given in (Hoekstra et al., 2023).
2.2 Electro-Thermal Model
Now we will describe the thermal behavior of the
battery. As seen in the previous section, the parameters
of the ECM are influenced by the battery temperature.
Likewise, how much the battery heats up, is affected
by electrical parameters like the current, the terminal
voltage and the OCV. Consequently, there is a mutual
coupling and interaction between the ECM and the
thermal model (Cai et al., 2021).
The electro-thermal model expresses the heat
˙q
th
generated at the core of the battery, how this affects
the core temperature
T
c
and the surface temperature
T
s
, as well as how much cooling is obtained at the
battery’s surface which is in contact with the envi-
ronment at ambient temperature
T
f
. This yields the
electro-thermal battery models (ETBM) with states
x
ET BM
= [q
th
k
,T
c
k
,T
s
k
]
T
as given by:
ET BM
˙q
th
k
= u
k
V
OCV
(s
k
,T
k
) − y
k
T
c
k+1
= T
c
k
+
∆t
C
c
q
th
k
+
T
s
k
− T
c
k
R
c
T
s
k+1
= T
s
k
+
∆t
C
s
T
f
k
− T
s
k
R
u
+
T
c
k
− T
s
k
R
c
(2)
Here, the first equation expresses the heat generation
due to the charging, as the product of the current
u
,
and the voltage which is a function of electrical param-
eters as mentioned. The second and third equations
express the evolution of core and surface temperatures,
with
C
c
and
C
s
the centralized heat capacity of the bat-
tery core and the battery surface respectively. These
evolutions are a function of the generated heat and the
cooling, as well as of the heat transfer between the two.
This transfer is affected by
R
c
, denoting the equivalent
conduction heat resistance used to simulate the heat
exchange between the core and the surface, and
R
u
,
denoting the equivalent convective resistance used to
simulate the convective cooling on the battery surface.
Remark 1. Note that for simplicity, the temperature
T
used in the ECM model is taken as the average
between T
c
and T
s
.
2.3 State-of-Health Model
For health-aware control, we need a reliable model
for degradation of batteries. Indeed, if we know how
degradation evolves as a function of charging and dis-
charging profiles, then (i) it can be included as a cost
function for optimal control, and (ii) it can be used to
improve the SOH estimation and therefore the SOC
estimation, since the latter relies on an accurate knowl-
edge of the actual value of Q
k
in (1).
SOH
k
which represents the current state of health,
is related to the loss of capacity due to degradation is
expressed as follows:
SOHM
SOH
k+1
=
1
Q
nom
(Q
k
− ∆Q
k
)
or
SOH
k+1
= SOH
k
−
∆Q
k
Q
nom
(3)
where,
Q
k
is the current cell’s capacity,
Q
nom
in the
nominal cell capacity, and ∆
Q
k
represents the capacity
degradation.
While this is a simple model, it is in practice very
hard to estimate these quantities correctly. The degra-
dation model therefore needs to include the uncer-
tainty. An accurate quantification of the uncertainty
distribution is important as we know that the SOC level
has a strong influence on degradation, especially in
case of under- and overcharging, for which the tails
of the SOC distribution matter. This information is
then fused with other sources of information such as
sensor inputs (current, voltage, temperatures, etc) or
other models such as the SOC to open-circuit voltage
relation, to then form a total posterior distribution for
the SOC. However, detailed models of degradation,
such as (Sulzer et al., 2021) for Li-ion batteries, are
too complicated to use in an online optimal control
calculation. Furthermore, although these models rely
on a profound understanding of the physics of degra-
dation, it is a process that relies on many influences,
many of which are unmeasured or even unknown, as
such rendering it highly stochastic. This stochastic
behavior can be derived from real measurement data
only. A useful tool for training stochastic models are
Bayesian Networks (BN), as they provide a compre-
hensible graphical description of all involved variables
and their stochastic relations. Especially for SOH
and/or remaining useful life (RUL) predictions, where
data is censored and models and measurements with
their uncertainties have to be fused in a nontrivial way
to support maintenance decisions, BNs have proven
their usefulness (Hostens et al., 2024).
In this paper, we adopt a simplified use of BNs,
and we assume availability of periodic capacity mea-
surements
Q
in the data. This is motivated by the exis-
tence of explicit procedures for capacity measurement,
such as (Christophersen, 2015, p14). We then model
the change in capacity as a function of the degrada-
tion drivers, such as temperature, depth-of-discharge
(DoD) and C-rate. Full formulations are provided in
Section 4.
Health-Aware Charging of Li-Ion Batteries Using MPC and Bayesian Degradation Models
39
In absence of prior knowledge of the nature of
these relations, it is recommended to use data-based
regression techniques and suggest specific functions
and distributions with a low number of parameters. In
many cases, generalized linear regression is a good
starting point. Training of the BN returns the poste-
rior distribution of the model parameters, as shown in
Fig. 2. An ill-chosen model will result in bad conver-
gence, yielding for instance multi-modal posteriors,
which can be used to trigger a refinement of the model,
or to collect more data (in case of too wide posteriors).
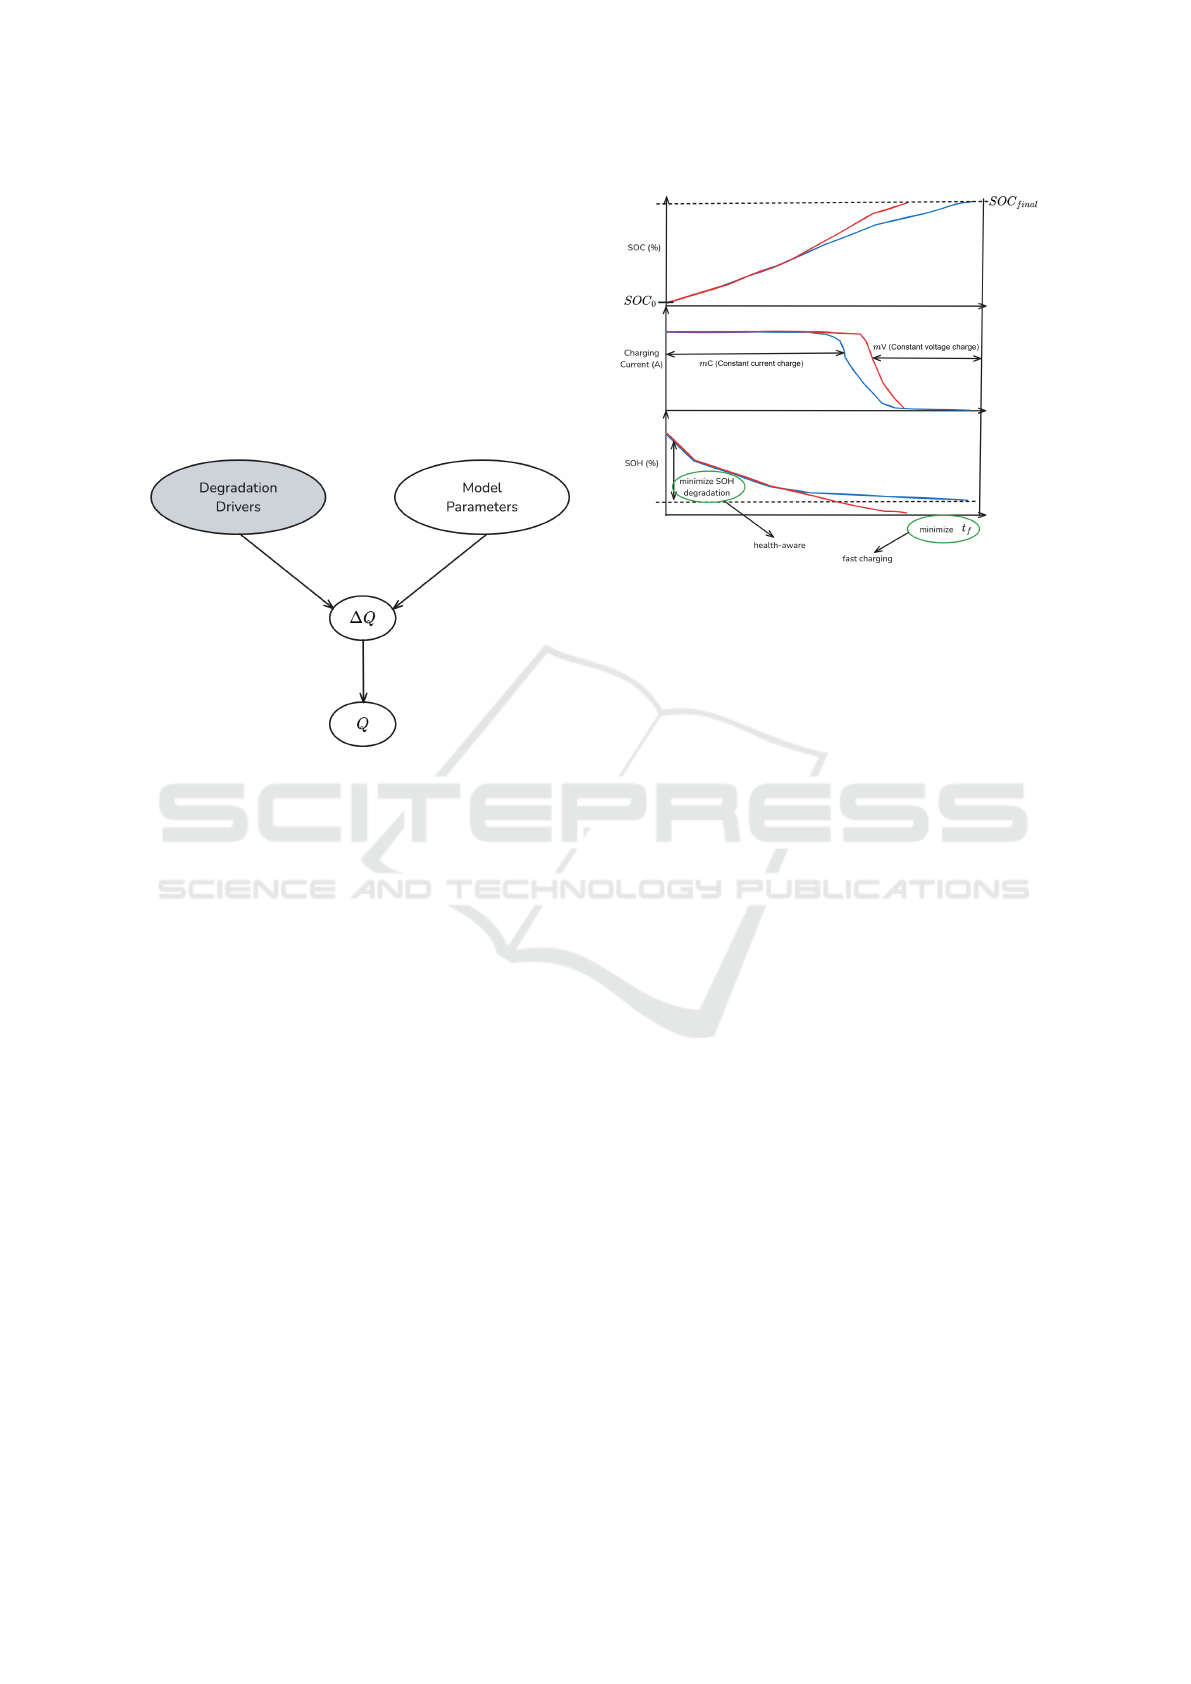
Figure 2: Generic BN representation of battery degradation.
The gray-colored variables are observed during training.
3 HEALTH-AWARE PROBLEM
FORMULATION
In this section we introduce our problem formula-
tion for the health-aware charging for the lithium ion-
batteries.
The trade-off between fast charging and health
degradation, is illustrated in Figure 3. It shows the
battery’s SOC, charging current, and SOH over time,
for two different current profiles. The bottom graph
illustrates the SOH over time, with the red curve in-
dicating a faster decline in SOH due to aggressive
charging, and the blue curve showing less degradation
with conservative charging. The overall goal of health-
aware charging is to minimize the total charging time,
which is to reach the desired SOC as fast as possible,
while also minimizing SOH degradation, yielding a
trade-off between fast charging and preserving battery
health.
Now, to define the Health-aware optimal charging
problem formulation, we first gather all needed mod-
els. We couple the discretized ECM model (1) with the
discretized ETBM model (2) and couple it to the dis-
cretized SOH model (3). This results in the collective
states,
x
= [
x
ECM
,x
EBT M
,x
SOH
], with
n
x
= 6, and input
Figure 3: Illustration of the health-aware optimal charging.
u
as the current. With that model, the MPC formula-
tion for Health-aware charging can now be formulated
as follows.
Formulation 3.1. Given a battery model with the
ECM model (1) from section 2.1, the discretized
ETBM (2) from section 2.2 and the discretized SOH
model mapped from the capacity degradation model
from section 2.3, the optimal charging current protocol
sequence input sequence
u
=
{u
0;x
k
,u
1;x
k
,...,u
N
h
−1;x
k
}
is the one that from an initial SOC, brings the system
to the final desired SOC as quickly as possible while
preserving SOH:
minimize
x
k
,u
k
J (x
k
,u
k
)
subject to (1),(2),(3)
s
min
≤ s
k
≤ s
max
−I
max
≤ u
k
≤ I
max
V
min
≤ y
k
≤ V
max
T
min
≤ T
k
≤ T
max
x
0
= X
0
(4)
Remark 2. Note: In our MPC formulation, the ex-
pected value of the SOH distribution from the Bayesian
Network model is used in the optimization cost.
Formulation 3.2. The objective term
J
(
x
k
,u
k
) is a
sum consisting of the following three terms:
1.
Fast charging term:
J
1
=
Q
s
∑
N
h
k=0
||s
k
− s
final
||
2
.
This first objective term penalizes deviations of the
SOC from
s
f inal
, encouraging the SOC to get close
to this value.
2.
Degradation preserving term:
J
2
=
Q
soh
∑
N
h
k=0
||SOH
k
− SOH
0
||
2
. This term penalizes
ICINCO 2025 - 22nd International Conference on Informatics in Control, Automation and Robotics
40

changes in the SOH, promoting preservation in
the battery’s health.
3.
Input regularization:
J
3
=
Q
u
∑
N
h
k=0
∥u
k+1
− u
k
∥
2
2
.
This term penalizes the rate of change of the charg-
ing current, promoting smoother current profiles.
The combination of objectives
J
1
,
J
2
and
J
3
ensures
a smooth, health-aware charging current
u
is obtained,
which also ensures the battery is charged sufficiently
quickly.
4 VALIDATION RESULTS
4.1 NMC Battery Data Collection
The Oxford Mathematical modeling Battery
Group’s Python Battery Mathematical Model
(PyBaMM) (Sulzer et al., 2021), built on top of
CasADi (Andersson et al., 2019), was used to collect
efficient battery simulations data. The specific
Doyle-Fuller-Newmann (DFN) model for Lithium-ion
NMC batteries with electrochemistry as depicted
in (O’Kane et al., 2020) for 5Ah was used.
This model is configured with several options that
captures various degradation mechanisms and physical
phenomena occurring within the battery. For instance,
the “SEI” (Solid Electrolyte Interphase) formation is
set to be “solvent-diffusion limited”, and changes in
SEI porosity are enabled. The model also includes
options for lithium plating porosity change, particle
mechanics (both swelling and cracking), SEI forma-
tion on cracks, and stress-driven loss of active mate-
rial (O’Kane et al., 2022).
The models use a discretization of the different re-
gions of the battery. These regions include the negative
electrode (
x
n
), separator (
x
s
), positive electrode (
x
p
),
and the particles within the negative (
r
n
) and positive
(
r
p
) electrodes. The number of regions determines
the resolution of the numerical solution in each region,
with higher values providing more detailed simulations
at the cost of increased computational effort. The used
values of the discretization parameters are listed in
Table 1.
We performed a series of experiments with sev-
eral charging protocols and voltage limits. We also
included noise to introduce stochasticity in the experi-
ments. A subset of the resulting capacity degradation
curves is shown in figure 4.
4.2 Model Parameters
The parameters of the ECM model, i.e.,
θ
1
,
θ
2
, and
θ
3
are chosen as polynomial functions. For this spe-
Table 1: Overview of the used discretization parame-
ters for PyBaMM simulations for the cell stoichiometry
from (O’Kane et al., 2020).
Parameter Name Symbol Value
negative electrode x
n
5
positive electrode x
p
5
negative particle r
n
30
positive particle r
p
30
separator x
s
5
0 100 200 300 400 500 600 700 800
4.6
4.8
5
5.2
5.4
Time (days)
Capacity (Ah)
Capacity vs. Time
1C, [2.5, 4.2] V, Conc.: 500 1C, [2.5, 4.2] V, Conc: 1000
1C, [2.5, 4.2] V, Conc: 1250 1C, [2.5, 4.2] V, Conc: 1500
1C, [3.0, 4.0] V, Conc: 500 1C, [3.2, 3.9] V, Conc: 1000
2C, [2.5, 4.2] V, Conc: 1000 3C, [2.5, 4.2] V, Conc: 1000
Figure 4: Capacity degradation curves resulting from differ-
ent degradation mechanisms, with charging protocols varied
from 1C-rate, 2C-rate and 3C-rate, along with several values
of Depth of Discharge (DoD) and initial concentration in
electrolyte [mol.m-3].
cific model, a seventh-order polynomial function of
the SOC is selected. The values of their coefficients
were estimated from the data using the LPVCore tool-
box (den Boef et al., 2021).
Remark 3. On establishing the curves
V
OCV
(
s
k
,T
k
)
for the considered cell, it was observed thatthe sensi-
tivity to temperature was found to be negligible, and
so for the results shown in the next subsection, the
dependency of
T
k
was dropped from the
V
OCV
curve,
as well as from the polynomial functions
θ
1
,
θ
2
, and
θ
3
.
The ETBM parameters are extracted from (Ak-
barzadeh et al., 2020) where they are derived empir-
ically for Lithium-ion NMC battery of 5Ah capacity.
The parameters are listed in Table 2:
Table 2: Thermal parameters for ETBM model as extracted
from (Akbarzadeh et al., 2020).
Parameter Name Symbol Value Unit
Battery core heat capacity C
c
934.5 J/kg.K
Battery surface heat capacity C
s
1661.9 J/kg.K
Conductive heat resistance R
c
0.422 K/W
Convective cooling resistance R
u
0.559 K/W
Ambient temperature T
f
298.18 K
The parameters for the BN degradation models
that are used to model the SOHM in (3) for ∆
Q
, are
Health-Aware Charging of Li-Ion Batteries Using MPC and Bayesian Degradation Models
41
trained on simulated accelerated aging data with full
charge/discharge cycles. We accordingly modeled the
discrete loss of capacity ∆Q after each cycle.
•
For charging cycles, ∆
Q
follows a shifted exponen-
tial distribution, or ∆
Q − µ
C
∼ Exponential
(
λ
C
),
where
µ
C
= ∆Q
C,nom
+ α
C,V
(V −V
C,nom
) + α
C,I
(I −I
nom
).
(5)
•
For discharging cycles, ∆
Q
follows a Laplace dis-
tribution: ∆Q ∼ Laplace(µ
D
,b
D
), where
µ
D
= ∆Q
D,nom
+ α
D,V
(V −V
D,nom
) + α
D,I
(I − I
nom
).
(6)
The variable
V
represents the final voltage of the cycle
and is as such equivalent to the depth of charge/dis-
charge. The variable
I
represents the constant current
(either during constant load or in CC phase of CC-CV),
and is as such equivalent to C-rate. The values for the
model parameters and nominal settings are shown in
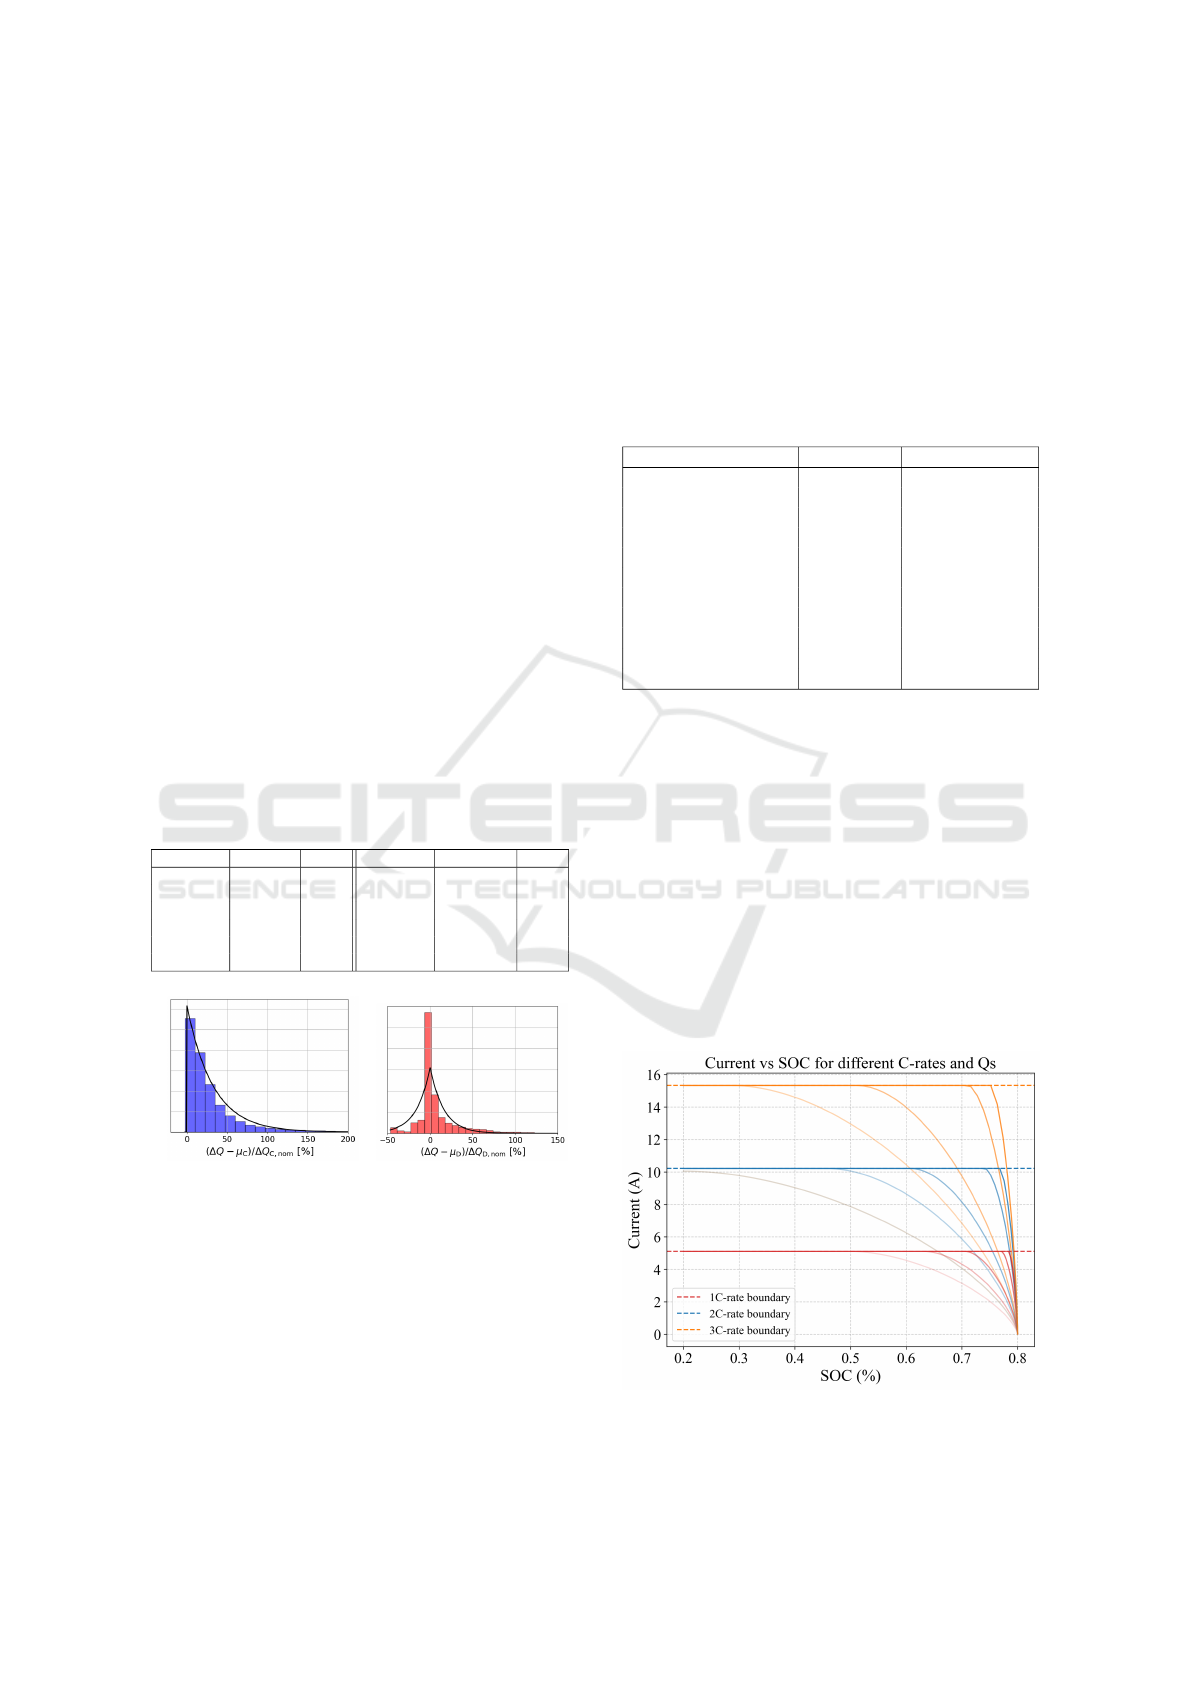
Table 3, and the relative prediction error histograms
and corresponding modeled distributions in figure. 5.
Note the wide distributions of relative prediction er-
rors, which is due to the intrinsic stochasticity of the
degradation process. This emphasizes the importance
of correct uncertainty quantification.
Table 3: Model parameter values for degradation models.
parameter value unit parameter value unit
∆Q
C,nom
8.35e−6 Ah ∆Q
D,nom
1.21e−5 Ah
α
C,V
2.47e−5 Ah/V α
D,V
−2.83e−5 Ah/V
α
C,I
2.52e−6 Ah/A α
D,I
7.38e−6 Ah/A
V
C,nom
3.9 V V
D,nom
3.25 V
I
nom
4 A b
D
1.93e−6 Ah
1/λ
C
2.71e−6 Ah
Figure 5: The histograms for the relative prediction errors
of ∆
Q
and corresponding modeled distributions (black), for
charging (blue, left) and discharging (red, right).
4.3 Results
The MPC formulation 3.1 is implemented in
CasADi (Andersson et al., 2019) and Rockit frame-
work (Gillis et al., 2020) for testing in simulations in
Python. To solve the optimization, we used the interior
point based IPOPT solver (Wächter and Biegler, 2006)
interfaced with CasADi. The simulation was carried
out on a PC with an Intel(R) Core(TM) Ultra 7 155H
and 32GB memory.
The parameters selected for the controllers are de-
tailed in Table 4. As can be seen, we calculated our
charging profiles using various C-rates, as well as dif-
ferent weights for how much to promote fast charging.
This allows us to validate the robustness of our method
under different conditions.
Table 4: Overview of MPC formulation parameters for the
health-aware charging.
MPC parameters symbol value
Symbolic framework - CasADi
Solver - IPOPT
MPC Horizon N
h
250 samples
Time for trajectory T 3600s
C-rates I
max
[1,2, 3] C
SOC constraints [s
min
,s
max
]
T
[0.2,0.8]
T
SOC charging ref. s
f inal
0.8 → 80%
Initial Temperature T
init
297 K
Weight (SOH deg.) Q
soh
10
−3
Weight (∆u) Q
u
10
−2
Weight (fast charging) Q
s
[10
−4
,10
−3
,10
−2
,1,10]
The simulations are performed with optimal health-
aware charging at different C-rates, aiming to bring
SOC from 0.2 to 0.8 (i.e. from 20% to 80%.) This
approach follows recommendations suggesting that
at low operating SOCs, significant degradation may
occur due to rapid volume expansion (Bazlen et al.,
2022). Figure 6 shows the simulated results of Current
vs SOC achieved with the optimal control at differ-
ent C-rates and with different weights
Q
s
. The trans-
parency of the curves decreases as the weight
Q
s
is
increased. It can be seen that the control yields a set of
charging profiles, that all bring the SOC to the desired
value according to the allowed C-rate, but at different
rates depending on the choice of Q
s
.
Figure 6: Simulation results for charging currents vs. SOC
at 1C, 2C and 3C rates with varying Q
s
.
ICINCO 2025 - 22nd International Conference on Informatics in Control, Automation and Robotics
42
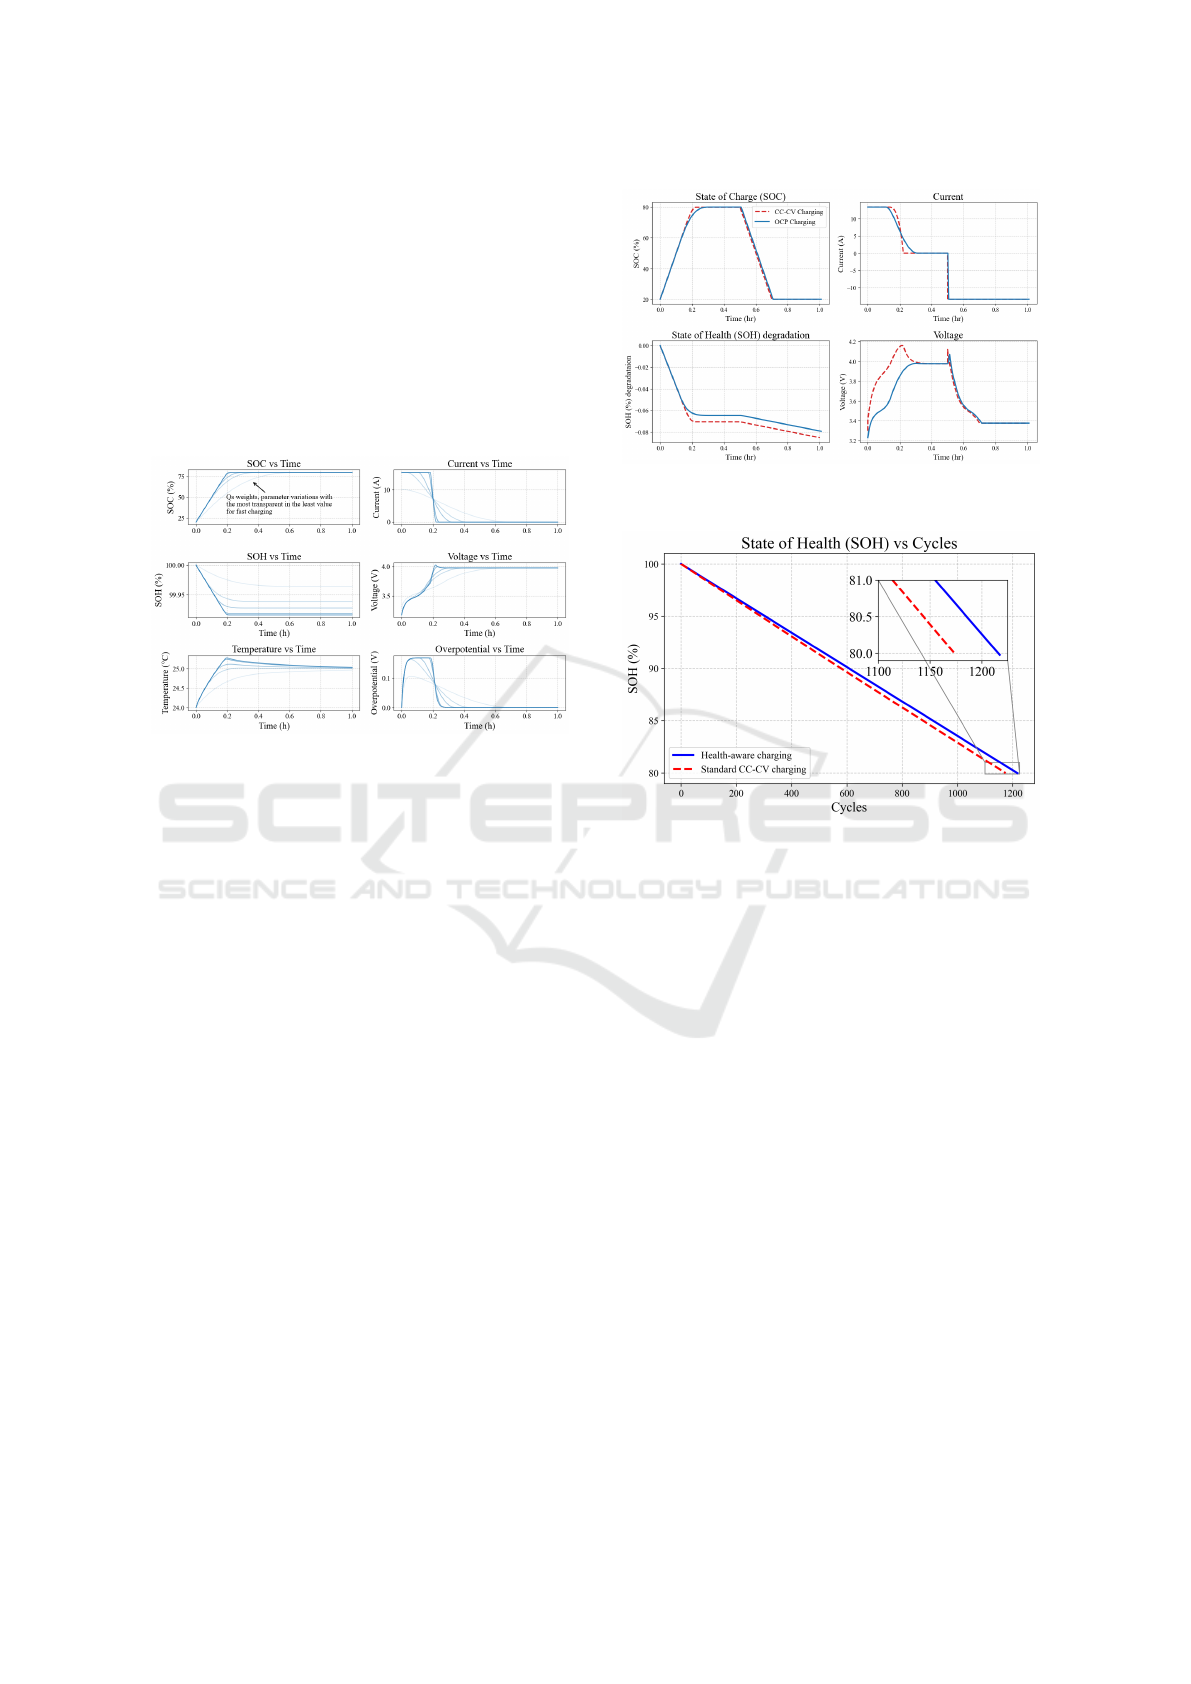
Figure 7 shows the corresponding trajectories of
the SOCs, SOHs and Voltage along with optimal charg-
ing current as a function of time, for the 3C rate. Again,
as
Q
s
increases, the curves become less opaque. It can
be observed that the fastest charging has the highest
SOH degradation. Note that in this graph we have
shown the 3C rate. This is the one we would use
for health-aware but still fast charging, since for fast
charging according to “IEC6581-1 EV charging mode
4” the entire battery has to be charged within 15-20
minutes (Van Den Bossche, 2010).
Figure 7: Simulation results of the optimal input and states:
SOC, SOH, Voltage, Temperature and Overpotential for 3C
fast charging with varying Q
s
.
In order to further validate our proposed approach,
we compare the health-aware charging protocol to the
conventional CC-CV charging strategy. Here we have
used both to charge the SOC from 20% to 80%, assum-
ing an initial SOH of 100%. After charging, we then
discharged using a 3C discharge profile, like in (Ab-
dollahi et al., 2016). The result of this comparative
analysis for a cycle is shown in Figure 8. The SOH
degradation for CC-CV charging is determined post-
process, once the charging profile has been established.
As illustrated in the figure, the CC-CV method results
in noticeably higher degradation. This increased degra-
dation can be attributed to an overshoot in terminal
voltage and the absence of an integrated SOH model
during the charging process, indicating suboptimal
charging.
Next, we simulate a prolonged sequence of charge
cycles, where in between the cycles we also estimate
the changes in SOH with the BN approach described
above. To make this a realistic sequence we use
data from the Urban Dynamometer Driving Schedule
(UDDS), developed by the Environmental Protection
Agency (EPA) that simulates city driving conditions.
The UDDS driving cycle is a standardized driving cy-
cle used for vehicle testing (Plett, 2004). From it, we
derive the scaled discharge current profiles from the
speed profile of UDDS, and then repeat it to generate
Figure 8: Charge and Discharge cycle comparison of Health-
aware optimal charging with standard CC and CV.
Figure 9: Comparison of Health-Aware and Standard CC-
CV Charging Methods with UDDS discharge cycles with
control model in loop.
a longer sequence of typical discharge cycles.
Remark 4. In the Health-aware optimization formu-
lation, the
SOH
0
is not fixed to the initial cycle value.
Instead, it is updated dynamically at the beginning of
each new charge cycle or just before the new MPC
horizon. This allows the charging current to adapt
to the current health state of the battery, keeping the
charging profile efficient.
On applying our health aware charging strategy
at 3C rate, the battery’s degradation is reduced, as is
illustrated in figure 9. It achieves this by dynamically
utilizing the current states and optimizing the charging
profile, while still minimizing the SOH degradation
during charging. In contrast, the standard CC-CV
charging method follows a fixed rule-based approach,
applying a constant current followed by a constant volt-
age, without taking the battery’s health into account.
This can lead to faster degradation. As compared to the
standard CC-CV charging, the health-aware optimal
charging lasts for approximately 2.5% more cycles.
Finally, we study how the proposed health-aware
controller would react in realistic conditions, in closed
Health-Aware Charging of Li-Ion Batteries Using MPC and Bayesian Degradation Models
43
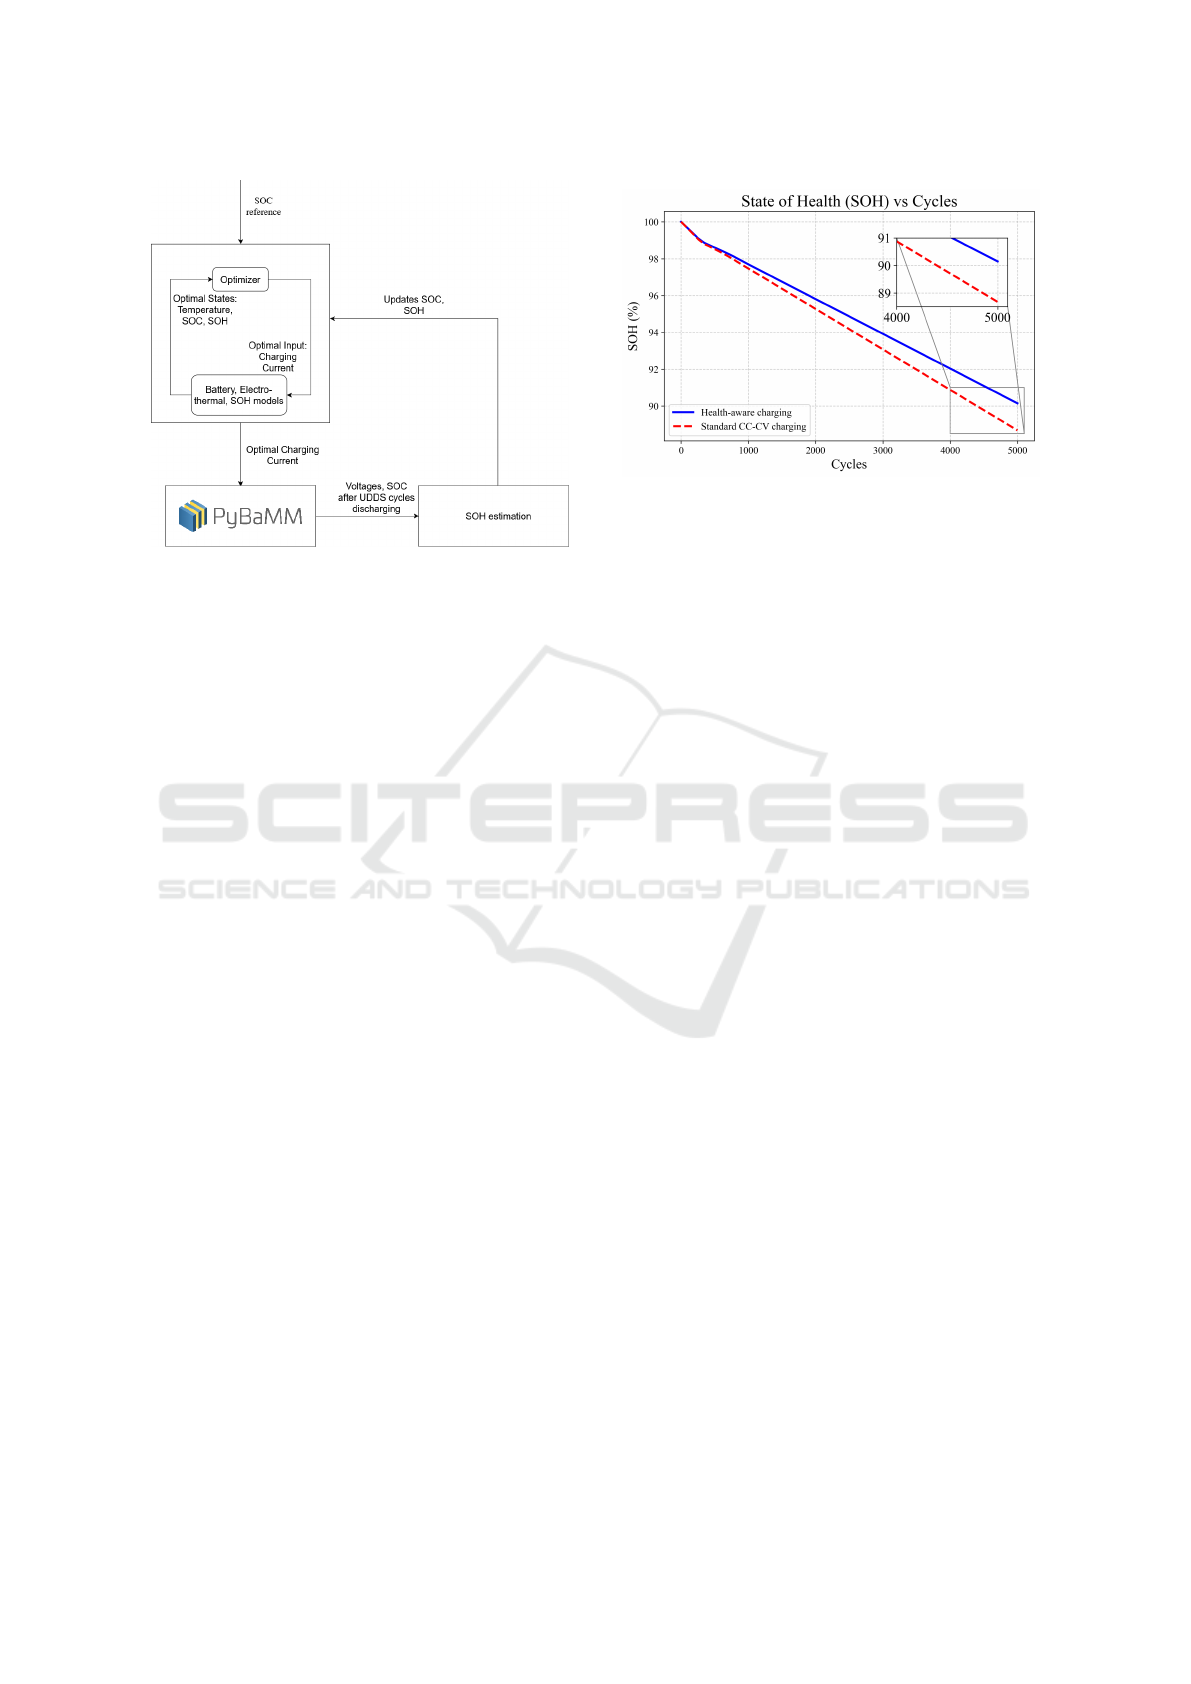
Figure 10: Configuration with PyBaMM emulation in the
loop.
loop, with imperfect models. To do so, we have set
up the configuration as shown in Figure 10, with the
controller actions being applied to the high-fidelity
PyBaMM model, and receiving updates from it, to
which the controller then reacts.
Remark 5. In the closed-loop simulations, the ex-
pected degradation prediction is transformed into the
change in SOH for the degradation penalizing term.
Initially, the health-aware optimal control gives an
optimal charging current profile, for a specified SOC
reference and the system’s present states, including the
temperature, SOC, overpotential, and SOH. It should
also be noted that the control is calculated using the
models from section 2, which are far simpler than the
full PyBaMM model. This profile is then applied to
the PyBaMM model. The simulation outcomes, which
provide updated SOC and SOH estimates, are fed back
into our health-aware optimal control optimizer.
Remark 6. It should be noted that the the discharge
cycle in these simulations has a lower DoD during
the UDDS discharging profile, and so eventually the
charging has a less depth of charge. This choice is
driven by the need for stable PyBaMM in closed loop
simulations.
Figure 11 shows the SOH degradation over a span
of 5000 cycles for both the charging strategies i.e.,
CC-CV charging and Health-aware charging. It can
be observed that Health-aware charging retains ap-
proximately 90% of its SOH, while CC-CV falls to
approximately 88.7%. It is also evident that Health-
aware charging had approximately 600 more cycles
than CC-CV method before reaching 90% SOH. This
disparity occurs because the CC-CV charging strategy
is purely voltage and C-rate without regard to the state
of health or degradation impacts. While, the health-
Figure 11: Comparison of Health-Aware and Standard CC-
CV Charging Methods with UDDS discharge cycles with
PyBaMM in closed-loop.
aware charging explicitly considers battery’s updated
SOH during optimization. Due to this, the charging
current prevents excessive degradation and prolongs
battery. Eventually, the figure highlights the impact of
considering SOH in Health-aware charging leading to
better performance than standard CC-CV.
5 CONCLUSION
This paper presents a health-aware MPC based battery
charging approach integrating electrical, thermal and
degradation dynamics via Bayesian Networks. We
validated our approach through high-fidelity simula-
tions and it demonstrated reduced SOH degradation
compared to standard CC-CV methods. The differ-
ence represents a significant enhancement in life-cycle
sustainability especially for long-term applications.
We expect SOH estimation and corresponding
charging profiles to become increasingly important,
due to (i) the increasing utilization of e.g., EVs, but (ii)
as battery passports gradually become standardized, to
keep track of battery health, since then there will be
extra incentives to ensure batteries are not degraded
by inefficient charging.
While the proposed approach demonstrates promis-
ing results in high-fidelity simulations, real-world ex-
perimental validation is essential to assess its robust-
ness, practical feasibility and generalization. Future
work will focus on implementing the methodology on
actual battery systems, with significant emphasis on
developing and validating robust estimators. Further-
more, the current deterministic control formulation
does not utilize the uncertainty propagation from the
BN degradation model. Future work will address these
gaps by integrating stochastic MPC strategies.
ICINCO 2025 - 22nd International Conference on Informatics in Control, Automation and Robotics
44

ACKNOWLEDGMENT
This research was supported by Flanders Make, the
strategic research centre for the manufacturing industry
in Belgium, in the framework of the OptiBATT_IRVA
project.
REFERENCES
Abdollahi, A., Han, X., Avvari, G., Raghunathan, N., Bal-
asingam, B., Pattipati, K. R., and Bar-Shalom, Y.
(2016). Optimal battery charging, part i: Minimiz-
ing time-to-charge, energy loss, and temperature rise
for ocv-resistance battery model. Journal of Power
Sources, 303:388–398.
Agency, I. E. (2024). Global ev outlook 2024: Moving
towards increased affordability.
Akbarzadeh, M., Kalogiannis, T., Jaguemont, J., He, J., Jin,
L., Berecibar, M., and Van Mierlo, J. (2020). Ther-
mal modeling of a high-energy prismatic lithium-ion
battery cell and module based on a new thermal char-
acterization methodology. Journal of Energy Storage,
32:101707.
Andersson, J. A., Gillis, J., Horn, G., Rawlings, J. B., and
Diehl, M. (2019). Casadi: a software framework for
nonlinear optimization and optimal control. Mathemat-
ical Programming Computation, 11:1–36.
Bazlen, S., Heugel, P., von Kessel, O., Commerell, W., and
Tübke, J. (2022). Influence of charging protocols on the
charging capability and aging of lithium-ion cells with
silicon-containing anodes. Journal of Energy Storage,
49:104044.
Birkl, C. R., Roberts, M. R., McTurk, E., Bruce, P. G., and
Howey, D. A. (2017). Degradation diagnostics for
lithium ion cells. Journal of Power Sources, 341:373–
386.
Cai, Y., Che, Y., Li, H., Jiang, M., and Qin, P. (2021).
Electro-thermal model for lithium-ion battery simu-
lations. Journal of Power Electronics, 21(10):1530–
1541.
Christophersen, J. P. (2015). Battery test manual for electric
vehicles, revision 3. Technical report, Idaho National
Lab.(INL), Idaho Falls, ID (United States).
den Boef, P., Cox, P. B., and Tóth, R. (2021). Lpvcore:
Matlab toolbox for lpv modelling, identification and
control. IFAC-PapersOnLine, 54(7):385–390.
Erdinc, O., Vural, B., and Uzunoglu, M. (2009). A dynamic
lithium-ion battery model considering the effects of
temperature and capacity fading. In 2009 International
Conference on Clean Electrical Power, pages 383–386.
IEEE.
Gillis, J., Vandewal, B., Pipeleers, G., and Swevers, J. (2020).
Effortless modeling of optimal control problems with
rockit. In 39th Benelux Meeting on Systems and Con-
trol, volume 138. Elspeet, The Netherlands.
Hoekstra, F., Donkers, M., and Bergveld, H. (2023). Rapid
empirical battery electromotive-force and overpotential
modelling using input–output linear parameter-varying
methods. Journal of Energy Storage, 65:107185.
Hostens, E., Eryilmaz, K., Vangilbergen, M., and Ooijevaar,
T. (2024). Bayesian networks for remaining useful
life prediction. In PHM Society European Conference,
volume 8, pages 11–11.
Klein, R., Chaturvedi, N. A., Christensen, J., Ahmed, J.,
Findeisen, R., and Kojic, A. (2011). Optimal charging
strategies in lithium-ion battery. In Proceedings of the
2011 american Control Conference, pages 382–387.
IEEE.
Li, Y., Li, K., Xie, Y., Liu, J., Fu, C., and Liu, B. (2020).
Optimized charging of lithium-ion battery for elec-
tric vehicles: Adaptive multistage constant current–
constant voltage charging strategy. Renewable energy,
146:2688–2699.
Lu, Y., Han, X., Li, Y., Li, X., and Ouyang, M. (2024).
Health-aware fast charging for lithium-ion batteries:
Model predictive control, lithium plating detection,
and lifelong parameter updates. IEEE Transactions on
Industry Applications.
O’Kane, S. E., Ai, W., Madabattula, G., Alonso-Alvarez,
D., Timms, R., Sulzer, V., Edge, J. S., Wu, B., Offer,
G. J., and Marinescu, M. (2022). Lithium-ion battery
degradation: how to model it. Physical Chemistry
Chemical Physics, 24(13):7909–7922.
O’Kane, S. E., Campbell, I. D., Marzook, M. W., Offer,
G. J., and Marinescu, M. (2020). Physical origin of the
differential voltage minimum associated with lithium
plating in li-ion batteries. Journal of The Electrochem-
ical Society, 167(9):090540.
Plett, G. L. (2004). Extended kalman filtering for battery
management systems of lipb-based hev battery packs:
Part 3. state and parameter estimation. Journal of
Power sources, 134(2):277–292.
Qin, Y., Zuo, P., Chen, X., Yuan, W., Huang, R., Yang, X.,
Du, J., Lu, L., Han, X., and Ouyang, M. (2022). An
ultra-fast charging strategy for lithium-ion battery at
low temperature without lithium plating. Journal of
Energy Chemistry, 72:442–452.
Sulzer, V., Marquis, S. G., Timms, R., Robinson, M., and
Chapman, S. J. (2021). Python battery mathemati-
cal modelling (pybamm). Journal of Open Research
Software, 9(1).
Tomaszewska, A., Chu, Z., Feng, X., O’kane, S., Liu, X.,
Chen, J., Ji, C., Endler, E., Li, R., Liu, L., et al. (2019).
Lithium-ion battery fast charging: A review. ETrans-
portation, 1:100011.
Van Den Bossche, P. (2010). Iec 61851-1: Electric vehicle
conductive charging system-part 1: General require-
ments. In 2, pages 1–99. Iec.
Wächter, A. and Biegler, L. T. (2006). On the implemen-
tation of an interior-point filter line-search algorithm
for large-scale nonlinear programming. Mathematical
programming, 106:25–57.
Wassiliadis, N., Kriegler, J., Gamra, K. A., and Lienkamp,
M. (2023). Model-based health-aware fast charging
to mitigate the risk of lithium plating and prolong the
cycle life of lithium-ion batteries in electric vehicles.
Journal of Power Sources, 561:232586.
Health-Aware Charging of Li-Ion Batteries Using MPC and Bayesian Degradation Models
45

Xavier, M. A., de Souza, A. K., and Trimboli, M. S. (2020).
A split-future mpc algorithm for lithium-ion battery
cell-level fast-charge control. IFAC-PapersOnLine,
53(2):12459–12464.
Xavier, M. A. and Trimboli, M. S. (2015). Lithium-ion
battery cell-level control using constrained model pre-
dictive control and equivalent circuit models. Journal
of Power Sources, 285:374–384.
ICINCO 2025 - 22nd International Conference on Informatics in Control, Automation and Robotics
46
