
Localized Thermal Analysis for Sportswear via Wind Tunnel Testing
Xiaoyi Cai
a
, Zixiang Hu
b
and Peng Zhou
Department of Mechanical and Aerospace Engineering, The Hong Kong University of Science and Technology,
Clear Water Bay, Kowloon, Hong Kong SAR, China
Keywords: Sportswear, Thermal Comfort, Wind Tunnel, Convective Heat Transfer Coefficient, Thermal Insulation.
Abstract: Thermal comfort of sportswear is critical for optimizing athletic performance and improving safety. However,
current research on the convective heat transfer coefficient (h) between fabrics and the air flow remains
limited, especially in terms of its local analysis. In this study, a thermal cylinder which simulates human limb
was developed to evaluate the fabrics' thermal insulation (I
t
) and h (both local and global values) in the wind
tunnel. The wind speed ranged from 2 to 8 m/s, and the stretch ratio (SR) from 1.1 to 2.0. The results show
that for both fabrics, the local h reaches a minimum around θ = 80°–90°, while the local I
t
peaks near θ =
120°. The effects of SR and wind speed on I
t
and h are also reported. This work offers a practical method for
quantifying the heat transfer characteristics of stretched fabrics, providing theoretical guidance for sportswear
design and thermal regulation strategies in wind environment.
1 INTRODUCTION
Thermal performance of sportswear is a critical factor
influencing both athletes' competitive performance
and physiological safety (Domenico et al., 2022). On
one hand, effective heat dissipation from the body
surface improves thermal comfort, which is important
for endurance, concentration, and neuromuscular
efficiency during exercise. On the other hand,
inadequate thermal regulation can lead to the
accumulation of metabolic heat and moisture,
increasing the risk of thermal stress, dehydration, and
heat-related illnesses (Douzi et al., 2020; Reilly et al.,
2006). Therefore, a comprehensive understanding of
the thermal performance of sportswear is essential for
designing garments and providing guidance for
enhancing athletes' competitive performance.
Research on evaluating the thermal performance
of sportswear mainly focuses on the thermal
insulation (I
t
) and evaporative resistance (R
et
).
Several researchers have investigated the influence of
fabric physical parameters on thermal insulation and
evaporative resistance, including factors such as
fabric layer and yarn type. A common conclusion
from these studies is that thermal insulation tends to
increase with increasing fabric thickness and the
a
https://orcid.org/0009-0005-4430-8095
b
https://orcid.org/0009-0005-5227-9888
volume ratio of air layer. Using heated thermal
manikins, Wang et al. (2012; 2016) and Fan et al.
(2008) studied the effects of body motion, body
regions, and sweat rates on the global evaporative
resistance. Similarly, Preet et al. (2018; 2023)
explored the body-related factors, including sweat
composition and concentration. The impact of
varying wind conditions on thermal insulation and
evaporative resistance has also been studied (Hu et al.,
2016; Cui et al., 2016); however, the maximum wind
speed in these works was limited to 1.5 m/s. Research
on fabrics' It and Ret under static or low wind speed
conditions are listed in Table 1.
In real-world athletic activities such as cycling,
wind speeds usually exceed 5 m/s. Under such
conditions, convective heat transfer plays a
significant role in thermoregulation. Therefore,
investigating the convective heat transfer coefficient
(h) is of practical significance for competitive sports
and recreational sports. Although there have been
standardized American Society of Testing Materials
(ASTM) test methods for evaluating thermal
insulation and evaporative resistance of fabrics
(ASTM, 2022; ASTM, 2016), research focusing on
convection heat transfer of fabric remain limited,and
there is still no international testing standards for the
Cai, X., Hu, Z. and Zhou, P.
Localized Thermal Analysis for Sportswear via Wind Tunnel Testing.
DOI: 10.5220/0013689400003988
Paper published under CC license (CC BY-NC-ND 4.0)
In Proceedings of the 13th International Conference on Sport Sciences Research and Technology Support (icSPORTS 2025), pages 69-78
ISBN: 978-989-758-771-9; ISSN: 2184-3201
Proceedings Copyright © 2025 by SCITEPRESS – Science and Technology Publications, Lda.
69

Table 1: Investigation on thermal insulation (I
t
) and evaporative resistance (R
et
) of fabric.
Researchers Motivation Method* Variables
Tesinova et al., 2022
Study the effect of
fabric structure or
composition
Commercial instruments Number of layers
Özkan et al., 2023 Commercial instruments Type of yarn
Kumar et al., 2021 Commercial instruments Blend rate of fabrics
Saeed et al., 2022 Commercial instruments Combination of fabrics
Noshro. et al., 2024 Commercial instruments Porosity of fabric
Kumar et al., 2022 Commercial instruments Linear density of fabric
Wang et al., 2017 Thermal manikin Thickness of fabric
Wang et al., 2012
Investigate the factors
related to human
Thermal manikin Body segments
Wang et al., 2016 Thermal manikin Sweating set rate
Fan et al., 2008 Thermal manikin Motions of human
Preet et al., 2018
Study the effect of
sweat components
Commercial instruments Sweat/water
Preet et al., 2023 Commercial instruments Lactate concentration
Wang et al., 2012
Explore the influence of
wind conditions
Thermal manikin Wind speed
Hu et al., 2016 Thermal manikin Wind direction
Cui et al., 2016 Thermal manikin Wind speed
h between fabrics and the air flow. Asawo et al.
(2023)studied the impact of air permeability and wind
speed on thermal insulation and Nusselt number.
Although they compared the thermal properties of
different fabrics, the effect of fabric tightness wasn't
considered. The fabrics used in cycling suits typically
exhibit high elasticity, resulting in notable changes in
surface structure when subjected to stretching (Li et
al., 2025). Researchers already know that such
surface structural variation can affect the flow and
aerodynamic drag (Zheng et al., 2021; Zheng et al.,
2023); it is believed that the change in flow state can
also affect heat transfer performance of fabric (Cai et
al., 2024). Such an effect is not considered in the
conventional thermal characterization of fabrics.
On the other hand, current literature lacks
systematic experimental measurements of the local
convective heat transfer coefficient. Human limbs can
be approximated as cylindrical geometries, where
fabrics experience highly non-uniform flow and
thermal conditions along different circumferential
angles (Θ) at high wind speed (Cai et al., 2025).
Relying solely on overall heat transfer coefficients is
insufficient to accurately estimate fabrics'
thermoregulatory behavior. Although some studies
(Sobera et al., 2003; Gibson et al., 2009) employed
CFD simulations by simplifying fabrics as porous
materials to estimate local Nusselt number, as shown
in Figure 1, such models fail to capture the detailed
structural features of actual fabrics and provide
limited practical guidance.
Figure 1: Physical model of limb-air gap-fabric-air flow
system (Gibson et al., 2009).
In this study, the effects of stretch ratio and wind
speed on the thermal insulation and convective heat
transfer coefficient of fabrics were systematically
investigated. Local measurements were conducted to
elucidate the detailed heat transfer mechanisms, while
global values were analyzed to enable direct
comparison between the two tested fabrics.
2 METHODOLOGY
2.1 Wind Tunnel Facility
The experiment was conducted using an open-jet
wind tunnel in the Aerodynamics and Acoustics
Facility at The Hong Kong University of Science and
Technology. The wind tunnel has a test section area
of 0.6 × 1.35 m
2
. The flow speed can be adjusted
between 0 and 36 km/h.
icSPORTS 2025 - 13th International Conference on Sport Sciences Research and Technology Support
70
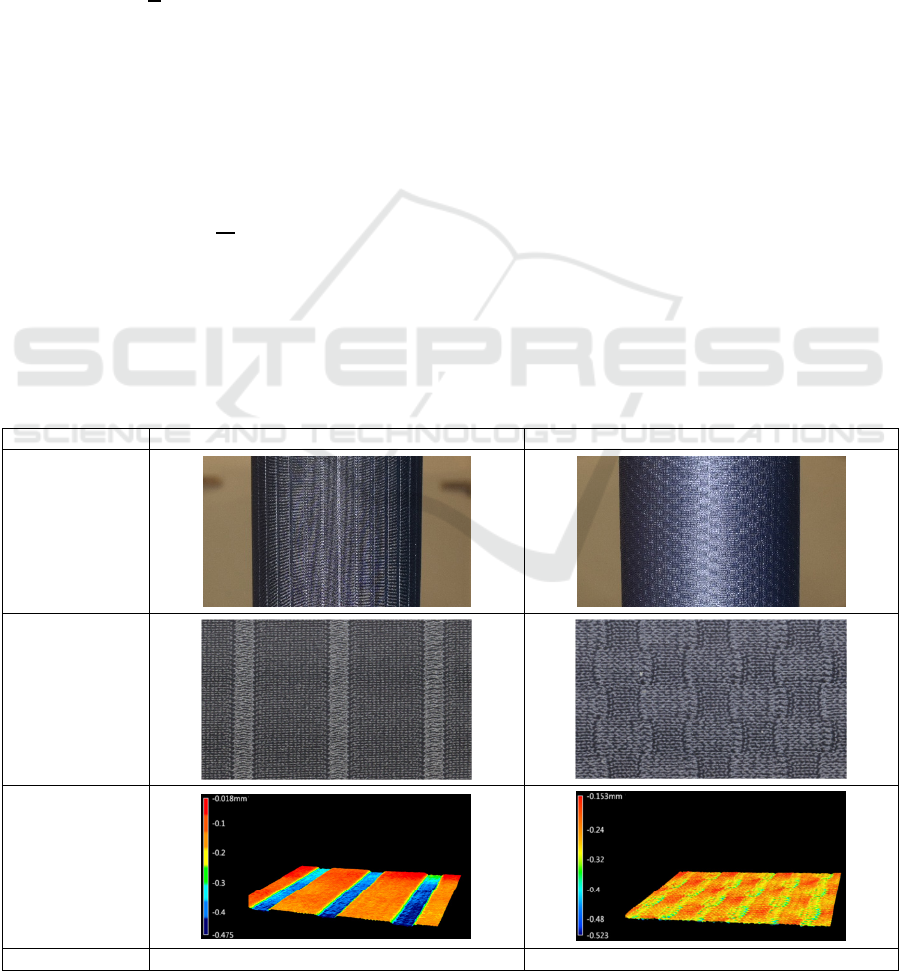
2.2 Sample Characteristics
In this work, two types of fabrics were selected for
investigation (named Fabric A and Fabric B,
respectively). The fabrics' pattern, 3D profile, and
global surface roughness (Sa) were measured by a 3D
optical profilometer (VR-6000, KEYENCE, Osaka,
Japan), as shown in Table 2. The Sa represents the
average of the absolute values of surface height
deviations from the mean plane over a specified area:
𝑆𝑎=
1
𝐴
|
𝑧
𝑥,𝑦
|
d𝑥d𝑦
(1)
To investigate the thermal performance of
sportswear under varying levels of tightness, this
study adopts the stretch ratio (SR) as a quantitative
measure and examines the variations of the
convective heat transfer coefficient h and thermal
insulation I
t
with respect to SR. The stretch ratio of
fabric is defined as follows (Li et al., 2025):
SR=
𝑃
𝑃
(2)
where 𝑃
is the original perimeter of fabric, and 𝑃 is
the perimeter of fabric after covering on the cylinder.
Obviously, the larger the SR is, the tighter the
sportswears are.
The lateral orientation corresponds to the
direction orthogonal to the longitudinal grooves. To
ensure consistency across measurements, fabric
samples were mounted onto the cylindrical surface
such that the grooves aligned with the cylinder’s axis
and remained perpendicular to the airflow. The two
cut edges of each fabric piece were stitched together,
with the seam positioned at the rear of the cylinder to
minimize its impact on the surrounding flow field.
2.3 Experimental System
The system is composed of four primary components:
the test section, thermal control system, and data
acquisition system, as shown in Figure 2. Some
detailed information about instruments and
components are listed in Table 3.
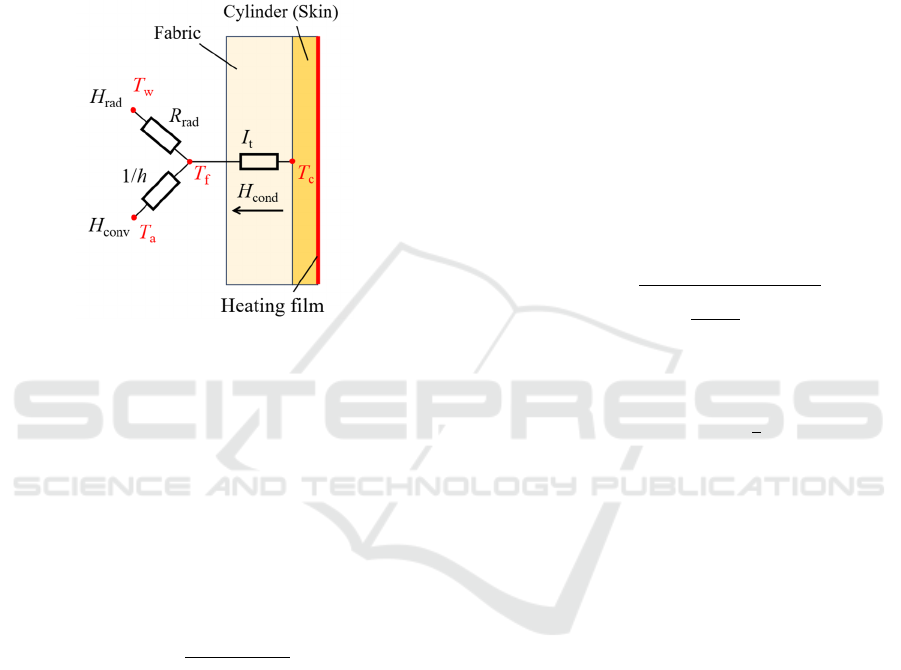
2.3.1 Test Section
This section is a cylinder made by resin. Its outer
surface can be covered with various fabrics, emulating
garments worn on human arms and thighs. The inner
surface of the cylinder is equipped with thermocouple
slots and water outlets. As illustrated in Figure 3, the
T-type thermocouples are installed at 10° intervals to
enable the measurement of temperature distribution as
a function of angular position (θ).
Table 2: Samples' characteristics.
Fabric A B
Covered on
cylinder
Pattern
3D profile
Sa
(μ
m
)
114 76
Localized Thermal Analysis for Sportswear via Wind Tunnel Testing
71
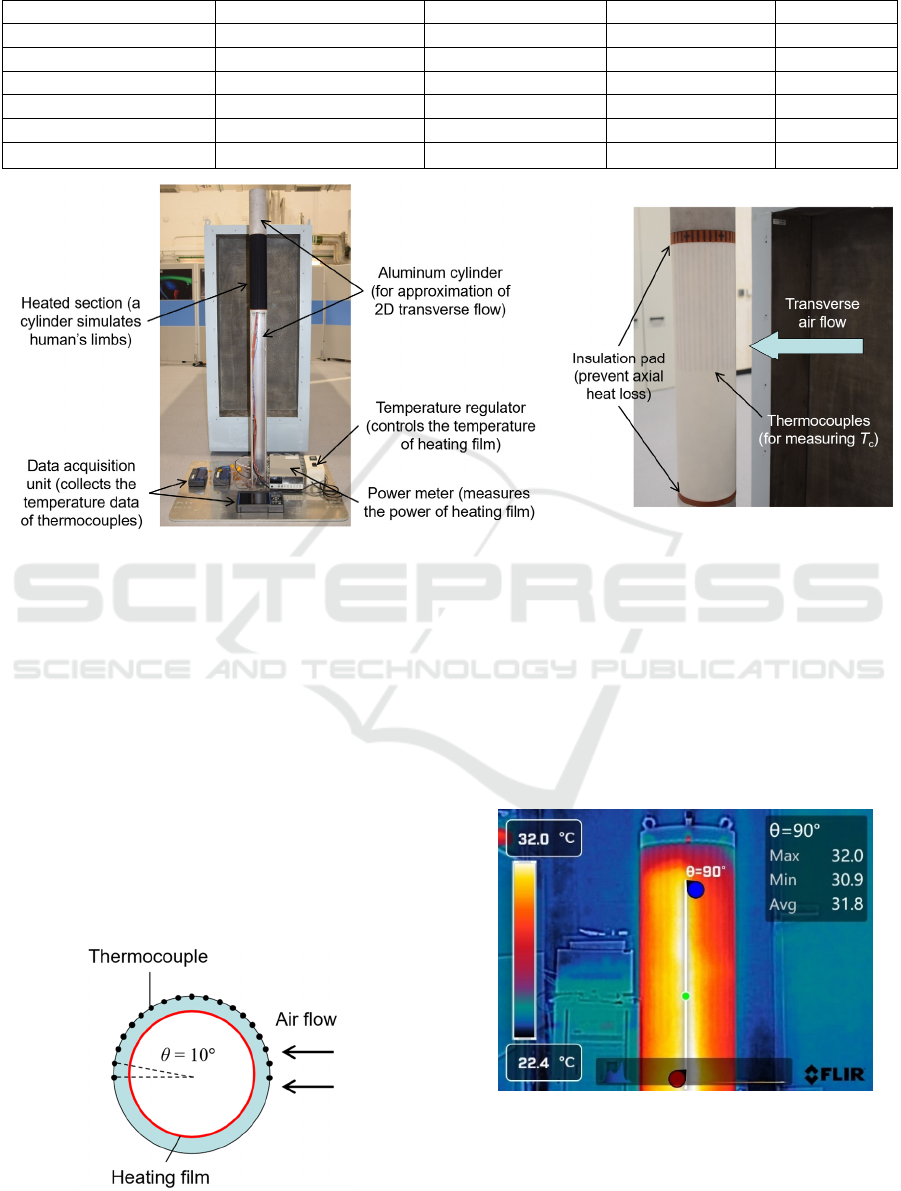
Table 3: Detailed information of the instruments and components used in this work.
Item Model A
pp
licable ran
g
e Accurac
y
Resolution
Thermocouple T-type thermocouple -40
–
125℃ ± 0.5℃
–
Infrared camera FLIR-E5 Pro -20
–
400℃ ± 2%*readin
g
0.1℃
Power mete
r
NAPUI-PM9817 0.01mA
–
20A ± 0.2% 0.001 mW
Tem
p
erature re
g
ulato
r
ANTHONE -10
–
60℃ ± 0.2% 0.1℃
Data acquisition HIOKI-LR8450 -10
–
50℃
–
0.01℃
Optical profilometer
KEYENCE
-VR 6000
-15 – 30℃ 0.4 μm 0.1 μm
Figure 2: Illustration of experimental system.
2.3.2 Thermal Control System
This system simulates the metabolic heat production
of the human body. A heating film adhered to the
inner surface of cylinder maintains at a certain
temperature, which is controlled by the temperature
regulator (ANTHONE, Xiamen, China). The power
of heating film is measured by a power meter
(NAPUI-PM9817, Dongguan, China). With thermal
insulation plates covering both the top and bottom of
the cylinder, we assume the heat solely dissipates
through the lateral surface of cylinder. This
configuration not only aligns with the actual situation
of human limbs but also facilitates temperature
measurement.
Figure 3: Thermocouples distribution on the cylinder.
2.3.3 Data Acquisition System
It records the temperature and humidity data. The
surface and ambient air temperatures are measured
using thermocouples, while the temperature of the
fabrics' outer surface is measured via an infrared
camera (
FLIR-E5 Pro, America
), as shown in Figure 4.
A humidity sensor is used to measure the ambient
humidity.
Figure 4: Average temperature at θ = 90°.
icSPORTS 2025 - 13th International Conference on Sport Sciences Research and Technology Support
72
2.4 Formulation
Under the steady-state condition, the power generated
by the heating film H
0
equals to the heat flux
conducted from the outer surface of cylinder to
fabric’s outer surface (H
cond
). Then the heat flux will
dissipate into the environment via two modes: heat
convection (H
conv
) and thermal radiation (H
rad
).
Energy balance of fabric is shown in Figure 5.
Figure 5: Energy balance of fabric.
The energy balance relationship can be expressed as
follows:
𝐻
=𝐻
=𝐻
+𝐻
(3)
where H
cond
, H
conv
, and H
rad
represent the steady heat
flux through heat conduction, heat convection, and
thermal radiation. In view of the ratio of fabric
thickness to the curvature, heat conduction within the
fabric can be approximated as one-dimensional
planar conduction. The corresponding formula is
given by:
𝐻
=
𝐴
∙
𝑇
𝑇
𝐼
(4)
where I
t
is the thermal insulation of fabric. T
c
and T
f
represent temperature of cylinder outer surface and
fabric outer surface, respectively. A
f
represents the
surface area of fabric. The heat convection and
thermal radiation can be calculated as:
𝐻
=ℎ
𝐴
𝑇
𝑇
(5)
𝐻
=
𝐴
𝜀𝜎
𝑇
𝑇
(6)
where h, T
a
, T
w
, ε, and σ represent convective heat
transfer coefficient, air temperature, wall temperature
(for radiant heat exchange), emissivity of fabric, and
Stefan-Boltzmann constant. In this work, the local
and global values of I
t
and h can be calculated
combining equations (3) to (6). For local calculation,
𝑇
and 𝑇
are obtained from line-integrated values at
the corresponding θ. For global calculations, 𝑇
and
𝑇
are determined by averaging the values across all θ
angles.
3 RESULTS AND DISCUSSION
3.1 Bare Cylinder Test
For verification, the convective heat transfer
coefficient ℎ of the bare cylinder is measured under
both natural and forced convection conditions (U
0
=
2, 4, 6, 8 m/s). The results are compared with the
semi-empirical models to validate the accuracy of our
method. For natural convection, we used the
correlation recommended by Churchill et al. for
comparison (Churchill & Chu, 1975):
𝑁𝑢=
⎩
⎪
⎨
⎪
⎧
0.825+
0.387∙𝑅𝑎
/
1+
0.492
𝑃𝑟
/
/
⎭
⎪
⎬
⎪
⎫
(7)
For forced convection, the correlation developed by
Hilpert was selected (Hilpert, 1933):
𝑁𝑢=𝐶∙𝑅𝑒
∙𝑃𝑟
(8)
where C = 0.193 and m = 0.618 when 4000 < Re <
40000; C = 0.027 and m = 0.805 when 40000 < Re <
400000. As shown in Figure 6(a), the h measured in
this work is 2.45 W/(m
2
K) under natural convection,
only 1.92% lower than that of Churchill's correlation.
Error bars represent the standard deviation from the
mean of three independent measurements. Although
the deviation increases with airflow velocity, it
remains within an acceptable range. Thus, our
experimental system provides a reliable and accurate
approach for evaluating the thermal performance of
fabrics. Furthermore, we studied the local h at
different θ on the cylinder, as shown in Figure 6(b).
Our results exhibit good consistency with the
previous experimental data (Bergman et al., 2006).
They pointed out that when Re = 10
4
, the flow
separation occurs at θ ≈ 90°.
3.2 Effect of Stretch Ratio on Fabrics'
Thermal Performance
In this section, the wind speed was fixed at 8 m/s, and
the thermal insulation and convective heat transfer
coefficient were measured for two fabrics under
different stretch ratios (SR = 1.1, 1.4, 1.7, and 2.0).
Localized Thermal Analysis for Sportswear via Wind Tunnel Testing
73
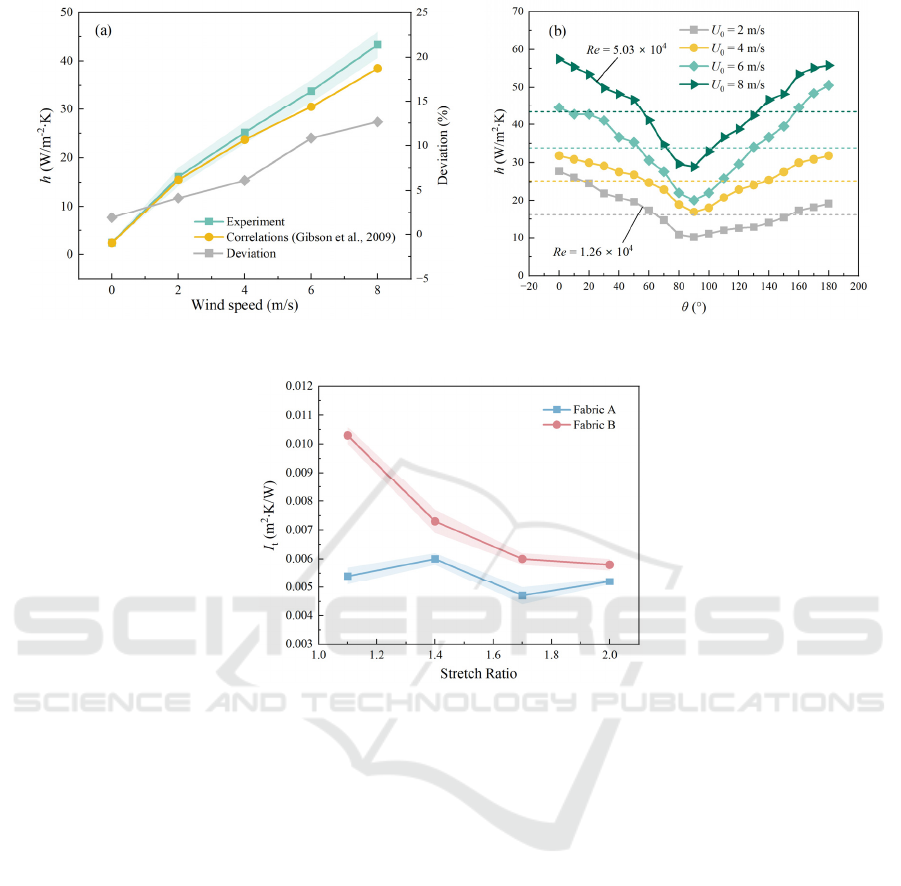
Figure 6: (a) Average and (b) local convective heat transfer coefficient for a bare cylinder.
Figure 7: Comparison of fabrics' thermal insulation at different stretch ratio at 8 m/s.
As shown in Figure 7, the thermal insulation of
Fabric A fluctuated between 0.0047 and 0.006 m
2
·K/W
with no clear variation tendency. In contrast, the
thermal insulation of Fabric B decreased monoto-
nically from 0.0103 to 0.0058 m
2
·K/W with increasing
SR. At all tested SR values, the thermal insulation of
Fabric A remained lower than that of Fabric B.
Subsequently, the local thermal insulation at
different θ was investigated, as illustrated in Figure 8.
Both fabrics exhibited a maximum thermal insulation
at θ = 120°, and a minimum at θ = 0° or 180°. At θ =
0°, which corresponds to the front stagnation point, the
incoming airflow impinges directly on the surface and
enhances the interfibrous heat convection, thereby
reducing thermal insulation. A similar effect occurs at
θ = 180° is due to the flow reattachment and turbulence
in the wake region. In contrast, θ = 120° typically lies
within or just beyond the flow separation zone, where
the local flow velocity near the surface is minimal due
to boundary layer detachment. This leads to weakened
convective heat transfer and hence a local maximum in
thermal insulation.
Notice that for Fabric B, the effect of increasing
SR on the thermal insulation's reduction diminished
when the fabric is very tight. As shown in Figure 8(b),
the curves corresponding to SR = 1.7 and 2.0 were
nearly identical, indicating a saturation effect. This
phenomenon can be explained as follows: thermal
insulation is governed by both heat conduction
through the fibers and convective heat transfer
between the interfibrous air and the fiber surfaces. As
the stretch ratio increases, the fabric becomes thinner,
which reduces its thermal conduction resistance.
Simultaneously, the compression of the fabric
decreases the volume fraction of interfibrous air,
thereby suppressing the internal convection. Beyond
a certain SR (e.g., 1.7), further stretching induces
minimal changes in both thickness and internal air
content, leading to a stabilized thermal insulation
performance. However, the thermal insulation of
Fabric A does not stabilize with the increasing SR.
The underlying physical mechanism will be explored
in future studies.
icSPORTS 2025 - 13th International Conference on Sport Sciences Research and Technology Support
74
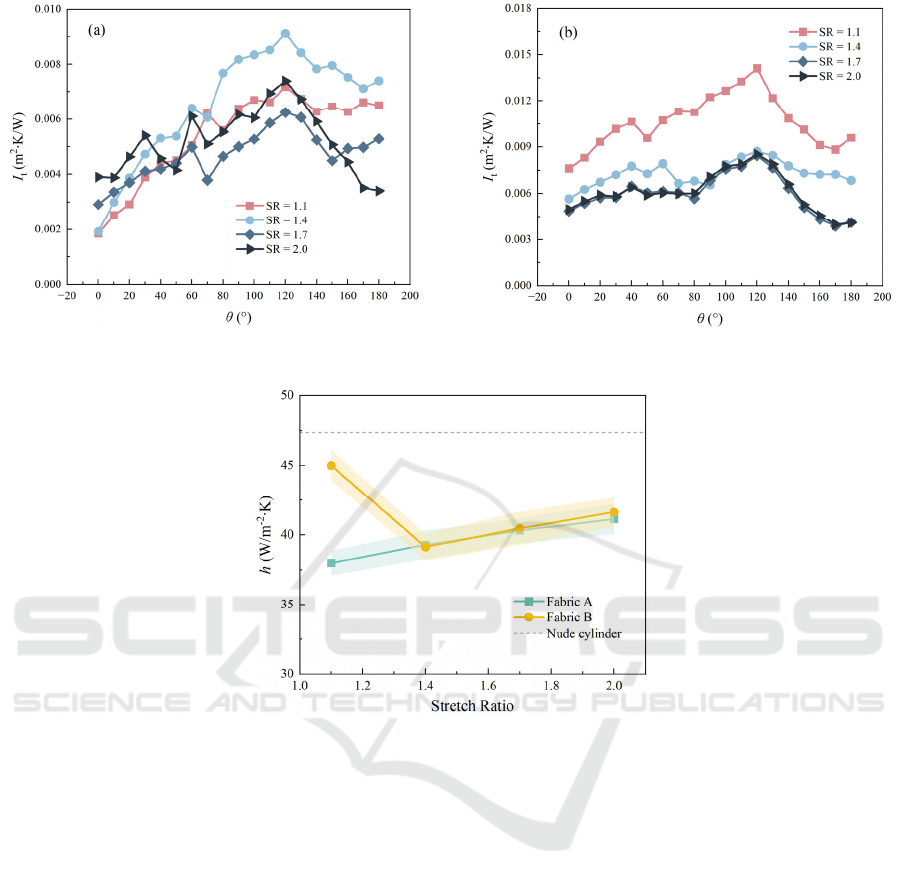
Figure 8: Local value of thermal insulation for (a) Fabric A and (b) Fabric B at different stretch ratio at 8 m/s.
Figure 9: Comparison of convective heat transfer coefficient at different stretch ratio at 8 m/s.
SR also influences the convective heat transfer
coefficient of fabric surface. As shown in Figure 9,
the convective heat transfer coefficient of Fabric A
increases monotonically with SR, with an overall rise
of 8.3% from SR = 1.1 to 2.0. In contrast, although
Fabric B exhibits a similar increasing trend from SR
= 1.4 to 2.0 and shows comparable values to Fabric
A, a significant decrease of 13% is observed when SR
increases from 1.1 to 1.4.
Local analysis reveals the primary cause of the
variations in global value of h. As shown in Figure
10(a), the influence of SR on the convective heat
transfer coefficient of Fabric A is mainly
concentrated within the range of θ = 0°-80°, while the
region from 80°-180° remains almost unaffected. A
similar trend can be observed for Fabric B; however,
at SR = 1.1, its local ℎ in the range of 80°-180° are
significantly higher than those at other SR values,
which accounts for the noticeably higher global h
value. Additionally, it is noted that most curves in
Figure 10 exhibit a minimum at θ = 80°, which is
different from the bare cylinder case where the
minimum occurs at θ = 90°. It suggests that fabric
structure can influence the separation position.
3.3 Effect of Airflow Velocity on
Fabrics' Thermal Performance
In this section, SR is fixed at 1.4 to investigate the
thermal insulation and convective heat transfer
coefficient under varying airflow velocities (U
0
= 2,
4, 6, 8 m/s). As shown in Figure 11(a), the thermal
insulation of both fabrics decreases with an increasing
airflow velocity. This is because, although airflow
does not affect the intrinsic thermal conductivity of
the fabric, the overall thermal insulation is governed
by both heat conduction through the fibers and heat
convection of the interfibrous air. Higher airflow
enhances inter-fiber convection, thereby reducing the
thermal insulation. Additionally, Figure 11(a) shows
that Fabric A exhibits lower thermal insulation than
Localized Thermal Analysis for Sportswear via Wind Tunnel Testing
75
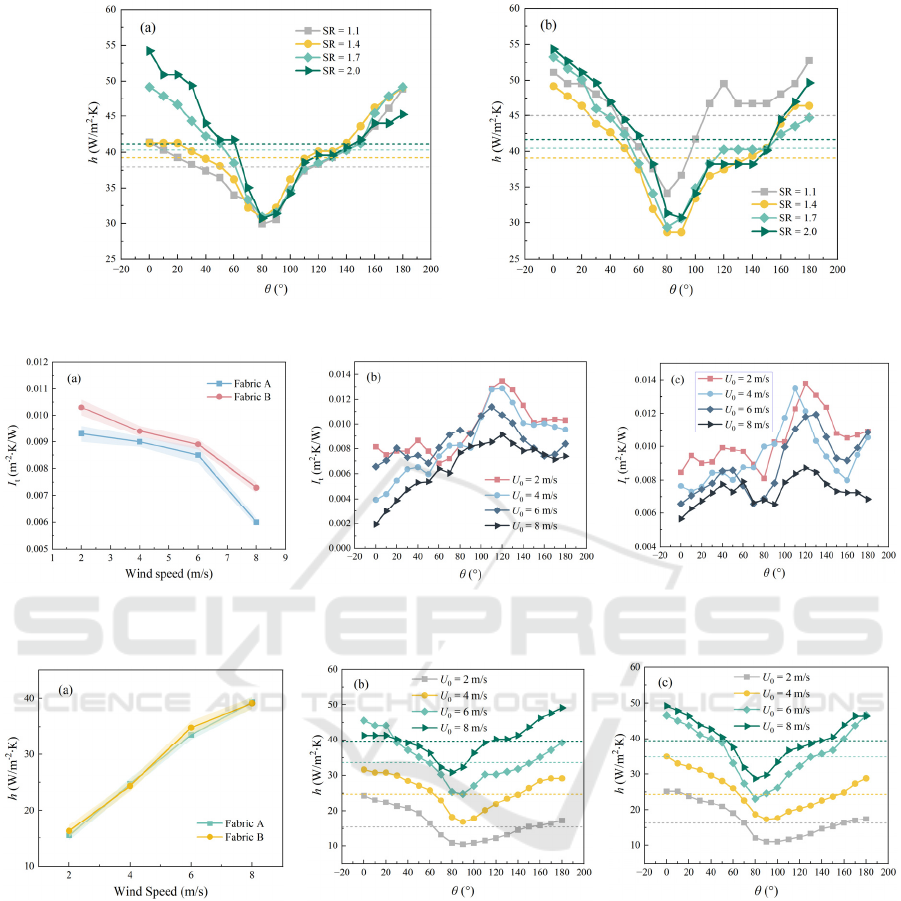
Figure 10: Local convective heat transfer coefficient for (a) Fabric A and (b) Fabric B at different stretch ratio at 8 m/s.
Figure 11: Relationship between thermal insulation and wind speed for fabrics A and B (SR = 1.4). (a) Global values
comparison; (b) local value of Fabric A; (c) local value of Fabric B.
Figure 12: Relationship between convective heat transfer coefficient and wind speed for fabrics A and B (SR = 1.4). (a)
Global values comparison; (b) local value of Fabric A; (c) local value of Fabric B.
Fabric B throughout all the tested velocities. Figure
11(b) and (c) present the local distributions of thermal
insulation, from which a similar conclusion to that in
Section 3.2 can be drawn: the local maximum occurs
near θ = 120°.
Figure 12 shows that the convection heat transfer
performance of the two fabrics is nearly identical
across all airflow velocities. Figure 12(b) and (c)
indicate that within the range of 2–8 m/s, both fabrics
maintain a laminar boundary layer, with clear
evidence of flow separation. Notably, at lower airflow
velocities (below 4 m/s), the separation point appears
near θ = 90°, while at higher velocities, it shifts
forward to approximately θ = 80°. This phenomenon
is consistent with the previous results (Bergman,
2006).
3.4 Proportion of Different Thermal
Resistances
This study focuses on heat conduction through the
fabric and convective heat transfer at its surface.
Therefore, radiative heat transfer is neglected in the
icSPORTS 2025 - 13th International Conference on Sport Sciences Research and Technology Support
76
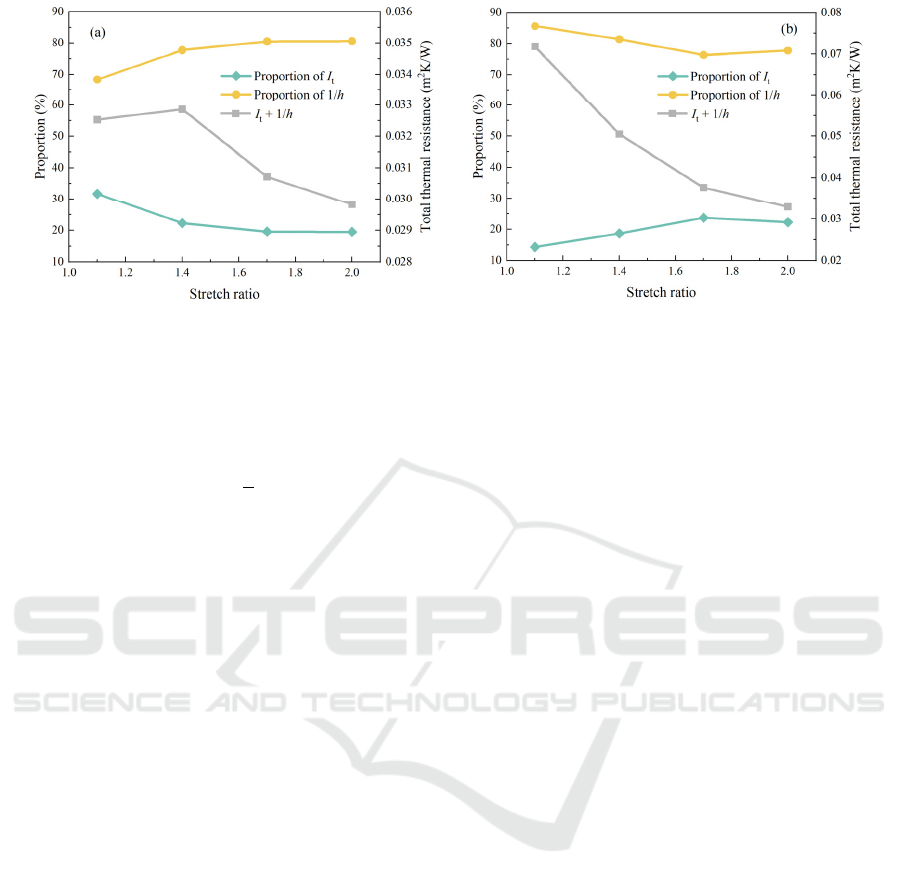
Figure 13: Total thermal resistance and the proportions of thermal insulation and convective thermal resistance as a function
of (a) stretch ratio and (b) wind speed.
current analysis. The thermal insulation and
convective thermal resistance (1/h) are in series to
obtain the total thermal resistance:
𝑅
=𝐼
+
1
ℎ
(9)
Taking Fabric B as an example, we examine how
the total thermal resistance varies with SR and wind
speed, as well as the corresponding changes in the
proportion of each thermal resistance. As shown in
Figure 13(a), the total thermal resistance of Fabric B
tends to decrease with increasing SR. Meanwhile, the
percentage of convective thermal resistance increases
monotonically from 68% to 80%. Figure 13(b) shows
that although the proportion of convective resistance
slightly decreases with increasing wind speed, it
consistently accounts for more than 78% of the total
thermal resistance. These results indicate that within
the studied range (U
0
= 2 – 8 m/s, SR = 1.1 – 2.0),
enhancing convective heat transfer is a more effective
strategy for improving Fabric B's overall thermal
transfer performance of the fabric.
4 CONCLUSIONS
A thermal cylinder platform fixed in the wind tunnel
was developed to evaluate the heat transfer
performance of sportswear fabrics under varying SR
and wind speeds. The key findings are summarized as
follows:
The I
t
of Fabric B decreased with increasing SR,
while Fabric A showed no clear trend. An increase in
SR generally enhanced the h for both fabrics,
although Fabric B experienced a notable drop in h
from SR = 1.1 to 1.4.
Higher wind speeds led to the reduction in I
t
and
increase in h for both fabrics. Across all wind speeds
tested, Fabric A consistently exhibited lower global I
t
than Fabric B, while the global h of both fabrics
remained nearly identical.
Both fabrics exhibited the maximum I
t
at θ = 120°
and minimum values at θ = 0° or 180°. With
increasing wind speed, the flow separation point
shifted toward the position with lower θ.
ACKNOWLEDGEMENTS
This work is partially supported by the Hong Kong
Innovation and Technology Commission (No.
ITS/101/23FP). The study was conducted in the
Aerodynamics Acoustics & Noise Control
Technology Centre (aantc.ust.hk).
REFERENCES
ASTM International. (2016). Standard test method for
measuring the evaporative resistance of clothing using
a sweating manikin (ASTM F2370–16). West
Conshohocken, PA: ASTM International.
ASTM International. (2022). Standard test method for
measuring the thermal insulation of clothing using a
heated manikin (ASTM F1291–22). West
Conshohocken, PA: ASTM International.
Bergman, T. L., Lavine, A. S., Incropera, F. P., et al. (2006).
Fundamentals of heat and mass transfer (7th ed.). Wiley.
Cai, X. Y., Li, H. Z., Ma, T., et al. (2024). Size effect on
thermal transport performance of inserted Cu/Cu
3
Sn
bilayer. International Journal of Heat and Mass Transfer,
218, 124784. https://doi.org/10.1016/j.ijheatmasstrans
fer.2023.124784.
Cai, X. Y., Li, H. Z., Zhang, J. Q., et al. (2025). Mechanism
of interfacial thermal resistance variation in
Localized Thermal Analysis for Sportswear via Wind Tunnel Testing
77

diamond/Cu/CNT tri-layer during thermal cycles.
International Journal of Thermal Sciences, 207C,
109380. https://doi.org/10.1016/j.ijthermalsci.2024.109
380
Churchill, S. W., & Chu, H. H. S. (1975). Correlating
equations for laminar and turbulent free convection from
a horizontal cylinder. International Journal of Heat and
Mass Transfer, 18, 1323–1329. https://doi.org/10.1016/0
017-9310(75)90222-7.
Cui, Z. Y., Fan, J. T., & Wu, Y. S. (2016). A comparative
study on the effects of air gap wind and walking motion
on the thermal properties of Arabian Thawbs and
Chinese Cheongsams. Ergonomics, 59(8), 999–1008.
https://doi.org/10.1080/00140139.2015.1111428.
Domenico, I. D., Hoffmann, S. M., & Collins, P. K. (2022).
The role of sports clothing in thermoregulation,
comfort, and performance during exercise in the heat:
A narrative review. Sports Medicine – Open, 8, 58.
https://doi.org/10.1186/s40798-022-00449-4.
Douzi, W., Dupuy, O., Theurot, D., et al. (2020). Per-
cooling (using cooling systems during physical
exercise) enhances physical and cognitive performance
in hot environments: A narrative review. International
Journal of Environmental Research and Public Health,
17, 1031. https://doi.org/10.3390/ijerph17031031.
Fan, J. T., & Tsang, H. W. K. (2008). Effect of clothing
thermal properties on the thermal comfort sensation
during active sports. Textile Research Journal, 78(2),
111–118. https://doi.org/10.1177/0040517508080046.
Gibson, P. (2009). Modeling heat and mass transfer from
fabric-covered cylinders. Journal of Engineered Fibers
and Fabrics, 4(1), 1–8. https://doi.org/10.1177/1558925
00900400102.
Hilpert, R. (1933). Heat transfer from cylinders.
Ingenieurwes, 4, 215.
Hu, S. R., Zhao, M. M., & Li, J. (2016). Effects of wind
direction on sportswear thermal insulation with various
ease allowance. International Journal of Clothing
Science and Technology, 28(4), 492–502.
https://doi.org/10.1108/IJCST-11-2015-0126.
Kumar, C. B. S., & Kumar, B. S. (2022). Study on thermal
comfort properties of Eri silk knitted fabrics for
sportswear application. Journal of Natural Fibers,
19(14), 9052–9063. https://doi.org/10.1080/15440478.2
021.1982110.
Kumar, D. V., & Raja, D. (2021). Study of thermal comfort
properties on socks made from recycled polyester/virgin
cotton and its blends. Fibers and Polymers, 22(3), 841–
846. https://doi.org/10.1007/s12221-021-0471-6.
Li, X. R., Mao, J. Q. and Zhou, P. (2025). Aerodynamic and
Acoustic Evaluation of a Cylinder Covered by Stretched
Grooved Fabric. AIAA Journal, https://doi.org/10.25
14/1.J065006.
Lu, Y. H., Wang, F. M., Peng, H., et al. (2016). Effect of
sweating set rate on clothing real evaporative resistance
determined on a sweating thermal manikin in a so-
called isothermal condition (T
manikin
= T
a
= T
r
).
International Journal of Biometeorology, 60, 481–488.
http://dx.doi.org/10.1007/s00484-015-1029-3.
Mukhopadhyay, A., Preet, A., & Midha, V. (2018). Moisture
transmission behavior of individual component and
multi-layered fabric with sweat and pure water. The
Journal of The Textile Institute, 109(3), 383–392.
https://doi.org/10.1080/00405000.2017.1348435.
Noshrodkoli, M. R., Mousazadegana, F., Gharehaghaji, A.,
et al. (2024). How porosity of the middle layer can affect
the comfort properties of multi-layer sportswear. The
Journal of The Textile Institute. https://doi.org/10.1080/
00405000.2024.2351668.
Özkan, E. T., Kaplangiray, B., Şekir, U., et al. (2023).
Investigation of the thermal comfort of the sportswear by
standing thermal manikin and thermal imaging
techniques. Journal of Engineered Fibers and Fabrics,
18, 1–12. https://doi.org/10.1177/15589250231180248.
Preet, A., Mukhopadhyay, A., & Midha, V. K. (2023). Impact
of varying lactate concentration in sweat on thermo-
physiological comfort of multi-layered ensembles.
International Journal of Clothing Science and
Technology, 35(2), 266–276. https://doi.org/10.1108/
IJCST-12-2021-0176.
Reilly, T., Drust, B., & Gregson, W. (2006).
Thermoregulation in elite athletes. Current Opinion in
Clinical Nutrition and Metabolic Care, 9(6), 666–671.
https://doi.org/10.1097/01.mco.0000247475.95026.a5.
Saeed, M. A., Safdar, F., Basit, A., et al. (2022).
Development of thermally comfortable clothing for hot
and humid environment. Journal of Natural Fibers,
19(14), 7674–7686. https://doi.org/10.1080/15440478.2
021.1958404.
Sobera, M. P., Kleijn, C. R., & Van den Akker, H. E. A.
(2003). Convective heat and mass transfer to a cylinder
sheathed by a porous layer. AIChE Journal, 49(12),
3018–3028. https://doi.org/10.1002/aic.690491204.
Tamsaki, A., David, T., & David, S. (2023). Measuring
convective heat transfer coefficients and thermal
resistance for protective fabrics using a heated cylinder
in a wind tunnel. The Journal of The Textile Institute,
114(12), 1909–1917. https://doi.org/10.1080/004050
00.2022.2150956.
Tesinova, P., & Atalie, D. (2022). Thermal comfort
properties of sport fabrics with dependency on structure
parameters and maintenance. Fibers and Polymers,
23(4), 1150–1160. https://doi.org/10.1007/s12221-022-
4160-x.
Wang, F. M., Ferraro, S., Lin, L. Y., et al. (2012). Localised
boundary air layer and clothing evaporative resistances
for individual body segments. Ergonomics, 55(7), 799–
812. https://doi.org/10.1080/00140139.2012.668948.
Wang, F. M., Lai, D. D., Shi, W., et al. (2017). Effects of
fabric thickness and material on apparent ‘wet’
conductive thermal resistance of knitted fabric ‘skin’ on
sweating manikins. Journal of Thermal Biology, 70, 69–
76. http://dx.doi.org/10.1016/j.jtherbio.2017.03.004.
Zheng, C. T., Zhou, P., Zhong, S. Y., et al. (2021). An
experimental investigation of drag and noise reduction
from a circular cylinder using longitudinal grooves.
Physics of Fluids, 33, 115110. https://doi.org/10.1063/
5.0070959.
Zheng, C. T., Zhou, P., Zhong, S. Y., et al. (2023). On the
cylinder noise and drag reductions in different Reynolds
number ranges using surface pattern fabrics. Physics of
Fluids, 35, 035111. https://doi.org/10.1063/5.0138074.
icSPORTS 2025 - 13th International Conference on Sport Sciences Research and Technology Support
78
