
Multiple-Branch Convolutional Neural Network for SSEC Daily
Return Prediction
Shengxi Jiang
a
School of Economics Management, Tongji University, Shanghai, China
Keywords: Deep Learning, Stock Market Return, SSEC.
Abstract: This study proposes a Multiple-branch Convolutional Neural Network (MBCNN) model to predict the daily
return direction of the Shanghai Securities Composite Index (SSEC). Due to the complexity and volatility of
financial markets, traditional machine learning methods such as Support Vector Machine (SVM), Random
Forest (RF), Logistic Regression (LR), and Decision Tree (DT) often face limitations in capturing intricate
patterns. To address this, the model leverages multiple feature branches, incorporating historical price data,
global market indicators, and other financial metrics. The effectiveness of MBCNN is evaluated against
classical machine learning approaches, with results demonstrating superior performance in both accuracy and
F-measure metrics. Additionally, the study explores the impact of Principal Component Analysis (PCA) on
model performance, revealing that PCA does not enhance prediction accuracy. Experimental results confirm
that MBCNN outperforms traditional models, offering improved classification capabilities and robustness.
These findings provide valuable insights and a foundation for future research on stock market trend prediction.
1 INTRODUCTION
The capacity to predict trends in stock market indices
is crucial for shaping economic policies and guiding
investment choices (Ayyildiz & Iskenderoglu, 2024).
By predicting the SMI trends, firms can optimize their
planning processes, while investors can enhance the
efficiency of their stock trading activities (Akyildirim
et al., 2022). However, it is quite difficult to forecast
the stock market's price movement because of its
great volatility, dynamic nature, and complexity.
Many scholars have studied this issue. In the
“Efficient Markets Hypothesis”, Nevasalmi’s stated
that all the information of the stock has been reflected
in the current stock price, so the stock price has
nothing to do with historical information, and it is
impossible to predict its price trend. However, the
validity of the Efficient Markets Hypothesis has been
debated in many studies (Nevasalmi, 2020).
According to the Adaptive Market Hypothesis,
markets are flexible and change throughout time,
alternating between efficiency and inefficiency at
various points in time (Lo, 2004). Therefore,
incorporating historical data can increase the
accuracy of stock trend forecast.
a
https://orcid.org/0009-0002-2578-8714
Several researchers have used machine learning to
the subject of stock prediction as these algorithms
have produced good results in a variety of study
domains. Such as Support Vector Machine (SVM)
(Xiao et al., 2020), Artificial Neural Network (ANN)
(Chen et al., 2017) and random forest (RF) (Weng et
al., 2018), Because of their superior generalization
capabilities, these machine learning algorithms were
successfully utilized to predict financial markets.
Currently, deep learning algorithms, such as long
short-term memory (LSTM), time convolutional
network (TCN) and convolutional neural network
(CNN), are also used in this fields. Ruize Gao et al.
employ CNN to deal with the implications of
evaluating several markets on the goal of market
stock prediction and successfully enhance accuracy
when compared to typical machine learning methods
(Gao et al., 2022).
However, the outcomes of these algorithms are
significantly influenced by the input variables (Gao et
al., 2022). Therefore, many scholars have made a lot
of attempts at feature engineering. Xiao Zhong et al.
add more than 60 relevant features and use Principal
Component Analysis (PCA) to process data and it
significantly improves the model effect (Zhong &
Jiang, S.
Multiple-Branch Convolutional Neural Network for SSEC Daily Return Prediction.
DOI: 10.5220/0013686200004670
Paper published under CC license (CC BY-NC-ND 4.0)
In Proceedings of the 2nd International Conference on Data Science and Engineering (ICDSE 2025), pages 265-270
ISBN: 978-989-758-765-8
Proceedings Copyright © 2025 by SCITEPRESS – Science and Technology Publications, Lda.
265
Enke, 2019). Ayyildiz et al. combine a variety of
machine learning models with the k-nearest
neighbors (KNN) to forecast changes in stock prices
(Ayyildiz & Iskenderoglu, 2024).
The aim of this study is to predict the daily return
direction of the Shanghai Securities Composite Index
(SSEC) by employing deep learning algorithm. In this
study, a multiple-branch Convolutional neural
network is approached and compared with four
classical machine learning methods including SVM,
RF, Logistic Regression (LR) and Decision tree (DT).
Also, PCA is attempted to be combined with machine
learning algorithms in the hope of improving model
accuracy.
This study consists of five parts. In the second
part, the dataset used in the study is explained. In the
third part, the deep learning algorithm used in this
study is introduced. In the fourth part, the
experimental results of the algorithm are discussed.
Eventually, in the fifth part, the conclusion of the
study is explained.
2 DATA DESCRIPTION
2.1 Introduction of SSEC
This research concentrates on the Shanghai Securities
Composite Index (SSEC), which monitors the
aggregated performance of both A-share and B-share
securities traded on the Shanghai exchange, offering
vital insights into the operational dynamics of China's
capital markets. This research selects a time range
from June 1, 2018 to January 1, 2023 to eliminate bias
produced by a brief amount of time. The dataset
originates from finance.yahoo.com. In Table 1, part
of dataset for the SSEC is presented.
Table 1: Part of dataset for the SSEC.
Date Close High Low Open Volume Stock
2018-06-01 3075.136963 3102.087891 3059.785889 3084.753906 129900 000001.SS
2018-06-04 3091.190918 3098.4021 3076.993896 3083.427002 114600 000001.SS
2018-06-05 3114.206055 3114.769043 3080.045898 3088.008057 118700 000001.SS
2018-06-06 3115.179932 3117.524902 3103.532959 3109.175049 120200 000001.SS
2018-06-07 3109.499023 3128.715088 3105.577881 3121.184082 127800 000001.SS
2.2 Target
This study's prediction target is the daily return
direction. Equations (1), (2), and (3) are used to
compute the three sorts of returns: 𝑅
,
, 𝑅
,
, and
𝑅
,
.
𝑅
,
=
𝐶𝑙𝑜𝑠𝑒
−𝐶𝑙𝑜𝑠𝑒
𝐶𝑙𝑜𝑠𝑒
1
𝑅
,
=
𝑂𝑝𝑒𝑛
−𝐶𝑙𝑜𝑠𝑒
𝐶𝑙𝑜𝑠𝑒
2
𝑅
,
=
𝐶𝑙𝑜𝑠𝑒
−𝑂𝑝𝑒𝑛
𝑂𝑝𝑒𝑛
3
The close and open prices of the SSEC on trading
day t are shown by the variables 𝐶𝑙𝑜𝑠𝑒
and 𝑂𝑝𝑒𝑛
,
respectively. Most of the current studies focus on the
prediction of 𝑅
,
, and few predictions
of 𝑅
,
. However, it is also very important for
investors to determine the trend of the stock's opening
price on the next day, so the prediction target of this
study is the direction of 𝑅
,
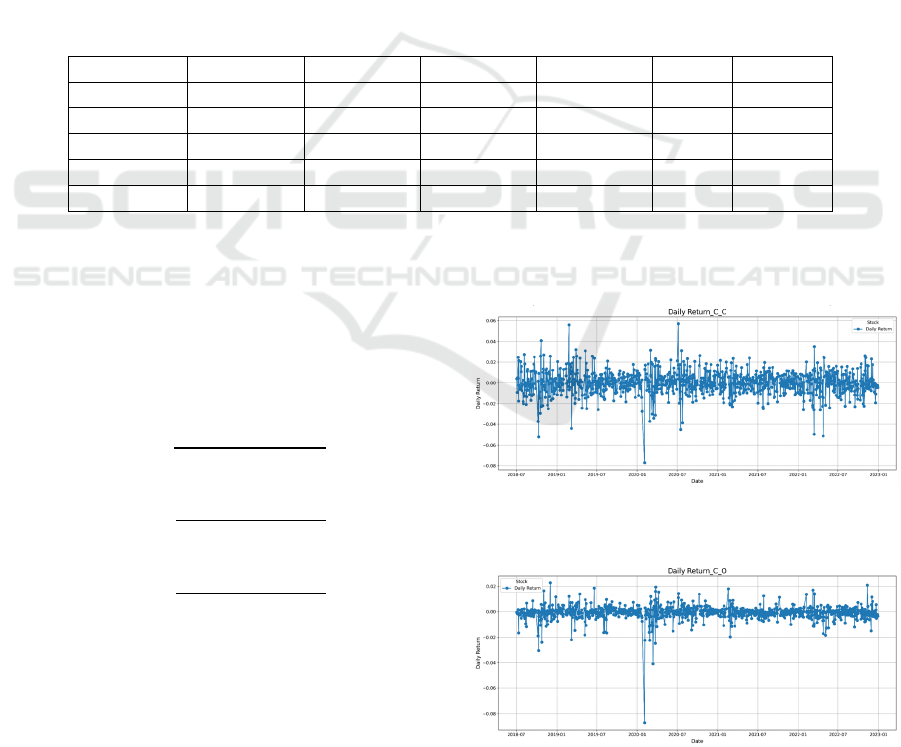
. Figures 1 and 2
show the line graphs of 𝑅
,
and 𝑅
,
over time,
respectively, from which can find that the fluctuation
of 𝑅
,
is smaller compared to that of 𝑅
,
.
Figure 1: Plot of 𝑅
,
versus time. (Picture credit:
Original)
Figure 2: Plot of 𝑅
,
versus time. (Picture credit:
Original)
ICDSE 2025 - The International Conference on Data Science and Engineering
266
2.3 Features
According to the imperfect efficient market theory,
the more thorough the historical information added,
the more accurate will be. Therefore, this study not
only considers the historical price information of
SSEC, including basic information, the daily return,
the relative difference in percentage and the
exponential moving average, but also takes global
market information, including other 5 major markets,
top 9 companies’ information in SSEC, and other
relevant information like gold and oil price, rate
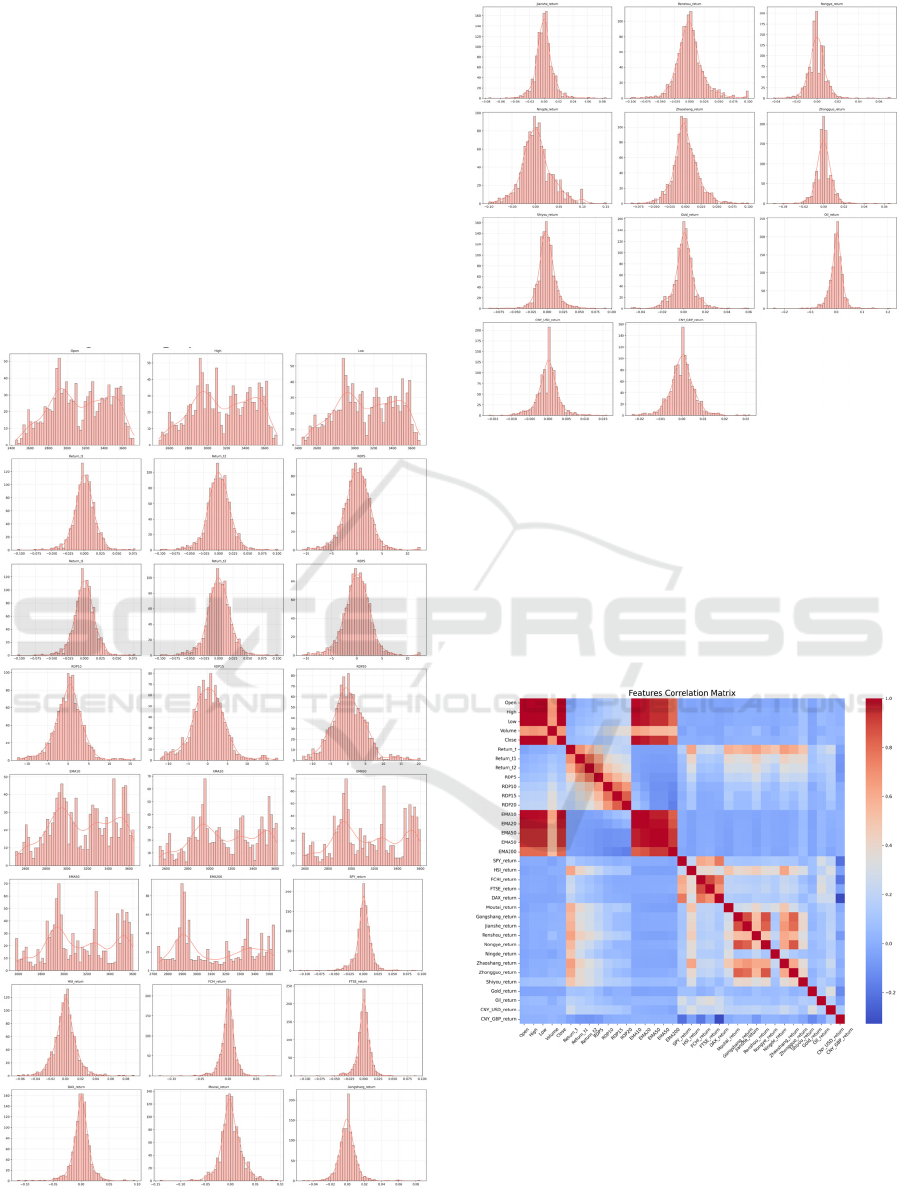
between countries into account. Total 35 features.
Then, this paper analyses the distribution of each
feature. Figure 3 displays the results.
Figure 3: Distribution of feature. (Picture credit: Original)
From the Figure 3, it can be found that the
distribution of most features is close to normal
distribution, indicating that the data is relatively good.
Then, this paper explored the correlation between
features, and the specific results are shown in Figure
4. The Figure 4 reveals that the correlation coefficient
between features in the same group is lower. This
analysis also provides a basis for subsequent feature
branch selection.
Figure 4: Correlation between features of thermal map.
(Picture credit: Original)
2.4 Principal Component Analysis
Principal Component Analysis (PCA) is a
dimensionality reduction technique that is widely
utilized in machine learning. The fundamental
Multiple-Branch Convolutional Neural Network for SSEC Daily Return Prediction
267

principle involves projecting high-dimensional
datasets via linear dimensionality reduction, while
optimally preserving essential feature characteristics
and reducing the impact of data redundancy and noise
through variance-maximizing coordinate
transformations.
In this study, PCA is used to reduce the
dimensionality of the original features, and then the
new features are input into the four machine learning
models for prediction including SVM, RF, LR and
DT. The performance of these four improved models
will also be compared with the model presented in
this paper.
3 MULTIPLE-BRANCH
CONVOLUTIONAL NEURAL
NETWORK
3.1 Convolutional Neural Network
Convolutional Neural Network (CNN) is a deep
learning model designed for processing structured
data (e.g., images and time series). The core feature
of CNN is the use of convolutional operations to
extract the local features of the data, and then
progressively distill them from the low-level features
to high-level features through a multilayer network.
The network consists of a convolutional layer, an
activation function, a pooling layer and a fully
connected layer. The convolutional layer uses
convolutional kernels to extract features from local
regions of the input data, capturing local spatial
correlations while reducing the number of
parameters.
3.2 Framework of MBCNN
In this study, considering that the original features
contain several different dimensional features,
Multiple-branch Convolutional neural network
(MBCNN) is used to perform prediction. The original
features will be divided into 5 groups, each group of
features will be processed by different convolutional
units and standardized. The convolutional
architecture employs weight-sharing branches to
establish global feature correlations and a
convolutional unit is used to extract multiple features.
Then data will enter the Concatenation layer and go
through a dense layer, finally an output layer. The
detailed network structure is shown in Figure 5.
Figure 5: The framework of MBCNN. (Picture credit:
Original)
3.3 Feature Extraction Block of
MBCNN
The features in Branch (1) include important
historical price information ('Open', 'High', 'Low',
'Volume','Close','Return_t','Return_t1','Return_t2').
The features in Branch (2) include the rest historical
price information
('RDP5','RDP10','RDP15','RDP20','EMA10',
'EMA20', 'EMA50', 'EMA50', 'EMA200'). The
reason for dividing the historical information into two
different branches for extraction is that the
information in branch (1) is that the recent
performance of the stock index contains more key
information. The features in Branch (3) include other
major markets information
('SPY_return','HSI_return','FCHI_return','FTSE_retu
rn','DAX_return'). The features in Branch (4) include
information of top 9 companies in SSEC. The features
in Branch (5) include other important information
('Gold_return','Oil_return','CNY_USD_return','CNY
_GBP_return'). Then, to better extract features, this
paper chooses 1-dimension (1D) convolutional unit,
since it has a significantly lower computing cost than
2-dimensional (2D) CNN and is more suitable for
processing time-series data, (Gao et al., 2022). After
that, each block's outputs are normalized by a
normalization layer. The entire features extraction
process is completed.
ICDSE 2025 - The International Conference on Data Science and Engineering
268

4 EXPERIMENT
4.1 Experimental Setting
In this study, four traditional machine learning
models, including DT, SVM, RF, LG, will be
compared and experimented with the MBCNN
proposed in this paper, and their prediction
performances will be evaluated comprehensively by
different metrics. The ratio of the test set for all
experiments was 0.2 and specific experimental
settings can be found in Tables 2 and Table 3.
Table 2: Experimental settings of comparing models.
Comparing
models
Parameter
DT Max depth: 5.
RF Max depth: 5; the number of trees: 100.
SVM Kernel function: rbf; C: 1; degree: 3.
LR
Max iter: 1000; solver: lbfgs; C: 1;
Penalt
y
: l2.
Table 3: Experimental settings of MBCNN.
Parameter Value
Optimizer Adam
Loss Function Binary crossentropy
Metrics Accuracy
learning rate 0.001
Epochs 100
Batch Size 32
Validation weight 0.2
Test weight 0.2
Class Weights balanced
4.2 Evaluation Metric
This study uses accuracy to assess the performance of
the various models. However, the data set contains
unbalanced data, so the F-measure is chosen as the
second assessment metric (Gunduz et al., 2017;
Hoseinzade & Haratizadeh, 2019).
The source of accuracy and F-measure is the
confusion matrix, which compiles the numbers of
cases that were categorized properly and improperly.
True positive (TP) refers to situations when both the
actual and projected outcomes are “up”, and true
negative (TN) refers to situations where both
predictions and actual results are “down”. False
positive (FP) happens when the real result is “down”
but the forecast is “up”, and false negative (FN)
happens when the actual result is “up” and the
prognosis is “down”. They are calculated by the
Equation (4), Equation (5), Equation (6), Equation
(7).
Precision =
𝑇𝑃
𝑇𝑃 + 𝐹𝑃
4
Recall =
𝑇𝑃
𝑇𝑃 + 𝐹𝑁
5
F−Measure=
2 × 𝑃𝑟𝑒𝑐𝑖𝑠𝑖𝑜𝑛 × 𝑅𝑒𝑐𝑎𝑙𝑙
𝑃𝑟𝑒𝑐𝑖𝑠𝑖𝑜𝑛 + 𝑅𝑒𝑐𝑎𝑙𝑙
6
Accuracy =
𝑇𝑃 + 𝑇𝑁
𝑇𝑃+𝑇𝑁+𝐹𝑃+𝐹𝑁
7
4.3 Experimental Result
Table 4 shows the results of the experiment. In
Accuracy metric, MBCNN improves 6.90%, 1.31%,
6.16% and 1.31% over DT, RF, SVM and LR,
respectively. On the F-Measure metric, MBCNN
improves 10.83%, 2.87%, 7.99% and 3.47% over DT,
RF, SVM and LR, respectively. These results show
that MBCNN has better overall performance than
traditional machine learning models in classification
tasks. The data processed by PCA did not have the
expected effect on the prediction performance of the
machine learning models, and this paper argues that
it is related to the structure of the data used, and that
PCA lost the key information of the data or
introduced noise in the process of dimensionality
reduction, which led to a decrease in the prediction
effect of the model.
Table 4: The experimental results.
Model Accuracy Precision Recall F-Measure
DT 0.725 0.662 0.642 0.646
PCA+DT 0.637 0.533 0.728 0.615
RF 0.765 0.726 0.691 0.696
PCA+RF 0.686 0.586 0.716 0.644
SVM 0.730 0.659 0.667 0.663
PCA+SVM 0.642 0.541 0.654 0.592
LR 0.765 0.720 0.667 0.692
PCA+LR 0.662 0.570 0.605 0.587
MBCNN 0.775 0.804 0.852 0.716
To further evaluate the predictive performance of
MBCNN, Receiver Operating Characteristic (ROC)
curves are plotted for each model. The ROC curve is
an important tool used to evaluate the performance of
a binary classification model. It calculates the True
Positive Rate (TPR) and False Positive Rate (FPR)
Multiple-Branch Convolutional Neural Network for SSEC Daily Return Prediction
269
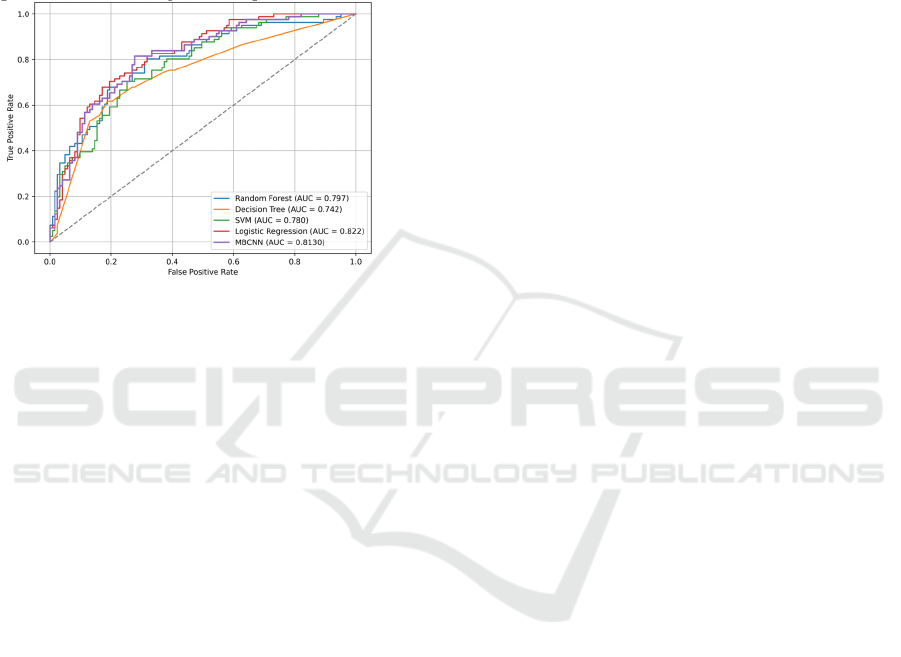
with different thresholds and plots the relationship
between them to measure the overall performance of
the classifier. From Figure 6, it can be seen that the
curve of MBCNN lies above three other traditional
machine learning models, suggesting that it has a
higher TRP at different thresholds and a lower FPR.
And then LR has higher AUC values than MBCNN,
indicating that for the LR model, positive samples are
overall more likely to be assigned higher predictive
probabilities than negative samples.
Figure 6: ROC curves of each model. (Picture credit:
Original)
5 CONCLUSION
In this paper, a deep learning model is proposed to
predict the return direction of SSEC by integrating
different groupings of feature divisions. The first
contribution of this paper is to predict the 𝑅
,
direction of SSEC using deep learning techniques,
which helps investors to make modifications to their
investment decisions for the next day to cope with
changes in the stock market. Second, in this study, the
effect of applying PCA for data processing on model
performance was investigated, which is not able to
improve models’ performance. Third, this paper
proposes the MBCNN model to predict the return
direction of SSEC by extracting 35 features through
multiple branches. And this model is compared with
four traditional machine learning models and the
experimental results show that the model proposed in
this study outperforms the traditional models in terms
of prediction accuracy and F-measure. In terms of
ROC curve performance, the MBCNN model is also
excellent, with AUC=0.812>0.8, which is slightly
lower than that of the LR model (AUC=0.822) but
much better than the other three models.
However, from the results of the ROC curves, it
can be concluded that the shortcoming of this study is
that the performance of the MBCNN model is not as
stable as that of the LR model. Although MBCNN
outperforms LR at a threshold of 0.5, the overall
positive and negative prediction discrimination rate is
not as good as LR. Therefore, Future research can
further improve the branch network structure to make
it better adapt to the input data structure and improve
the prediction performance. Meanwhile, in this
research, PCA did not improve model performance,
most likely because PCA was not applicable to the
data structure of this study. In the future, the people
can further explore the effect of adding
dimensionality reduction algorithms, such as PCA
and KNN, on the performance of the model in the
case of multi-feature.
REFERENCES
Akyildirim, E., Bariviera, A. F., Nguyen, D. K., & Sensoy,
A., 2022. Forecasting high-frequency stock returns: A
comparison of alternative methods. Annals of
Operations Research, 313, 639–690.
Ayyildiz, N., & Iskenderoglu, O., 2024. How effective is
machine learning in stock market predictions. Heliyon,
10(2), e24123.
Chen, H., Xiao, K., Sun, J., & Wu, S., 2017. A double-layer
neural network framework for high-frequency
forecasting. ACM Transactions on Management
Information Systems, 7(4), 1–17.
Gao, R., Zhang, X., Zhang, H., Zhao, Q., & Wang, Y.,
2022. Forecasting the overnight return direction of
stock market index combining global market indices: A
multiple-branch deep learning approach. Expert
Systems with Applications, 194, 116506.
Gunduz, H., Yaslan, Y., & Cataltepe, Z., 2017. Intraday
prediction of Borsa Istanbul using convolutional neural
networks and feature correlations. Knowledge-Based
Systems, 137, 138–148.
Hoseinzade, E., & Haratizadeh, S., 2019. CNNpred: CNN-
based stock market prediction using a diverse set of
variables. Expert Systems with Applications, 129, 273–
285.
Lo, A. W., 2004. The adaptive markets hypothesis. Journal
of Portfolio Management, 30(5), 15–29.
Nevasalmi, L., 2020. Forecasting multinomial stock
returns using machine learning methods. The Journal
of Finance and Data Science, 6, 86–106.
Weng, B., Lu, L., Wang, X., Megahed, F. M., & Martinez,
W., 2018. Predicting short-term stock prices using
ensemble methods and online data sources. Expert
Systems with Applications, 112, 258–273.
Xiao, C., Xia, W., & Jiang, J., 2020. Stock price forecast
based on combined model of ARIMA-LS-SVM. Neural
Computing and Applications, 32, 5379–5388.
Zhong, X., & Enke, D., 2019. Predicting the daily return
direction of the stock market using hybrid machine
learning algorithms. Financial Innovation, 5(1), 1–20.
ICDSE 2025 - The International Conference on Data Science and Engineering
270
