
Purchase Intention Analysis of Online Shoppers Based on Machine
Learning and K-Means Clustering
Qi Jiang
a
Department of Economic, Wenzhou Kean University, Zhejiang, China
Keywords: Purchase Intention Analysis, Online Shoppers, Machine Learning, K-Means Clustering.
Abstract: With the rapid development of e-commerce, online retailers are faced with the challenge of accurately pushing
and retaining customers. This study combines machine learning and K-means clustering technology to analyze
and predict online shoppers' purchase intentions using user behavior data. By analyzing a dataset of 12,330
user sessions, the study not only explored the key factors influencing purchase intent, but also used the
SMOTE technique to address the category imbalance in the dataset. The study used a variety of machine
learning models, including random forests, Extreme Gradient Boosting (XGBoost), and artificial neural
networks (ANN), while segmenting users through K-means clustering to identify groups with different
purchase intentions. The metrics included accuracy, recall, accuracy and F1 scores. The results show that the
random forest model has the best performance in all indexes, especially in the recall rate, showing a strong
ability to identify purchase intention. At the same time, through K-means clustering, users are successfully
divided into different groups, thus providing a more accurate personalized marketing strategy for the e-
commerce platform. This research provides the theoretical basis and practical guidance for the precision
marketing of e-commerce platforms.
1 INTRODUCTION
Nowadays, online shopping has gradually become the
main way of shopping for modern people. Compared
with traditional offline shopping, the influencing
factors and consumption habits of online shopping
have changed dramatically. In online shopping,
consumers are unable to intuitively access the goods
as in offline shopping, lack direct communication
with sales staff, and Sales staff can rely on their own
experience and ability to promote the purchase
conversion rate (Moe, 2003). It is not affected by the
site environment and other customer behavior.
Therefore, in this de-physicalized and de-
personalized shopping scenario, how to accurately
push personalized content to consumers and
maximize the retention of those potential customers
who enter the shopping page has become a core
challenge for online retailers.
Existing research has focused on predicting
purchase intentions by analyzing user behavior data.
Moe studied the behavior of online shoppers and
proposed a framework that divided users into buying,
a
https://orcid.org/0009-0009-8342-1807
searching and browsing (Moe, 2003). By using the
navigation clickstream data of online stores, he
analyzed the behavior patterns of different user
groups, thus providing a theoretical basis for accurate
personalized recommendations. Mobasher et al.
further explored the personalized recommendation
system based on Web data (Mobasher, Dai, Luo, &
Nakagawa, 2002). By discovering and evaluating the
concept of aggregate usage files, Mobasher et al.
proposed a method to generate a user interest model
by aggregating user behaviors, which provided
important support for the development of the field of
Web personalized recommendation(Mobasher et al.,
2002). In addition, Sakar et al. used multi-layer
perceptron (MLP) and long short-term memory
(LSTM) recurrent neural networks to propose a
method to predict online shoppers' purchase
intentions in real time. Similarly, Fernandes and
Teixeira used clickstream data to analyze online
purchase intention. The research shows that users'
purchase decisions can be effectively predicted by in-
depth analysis of their browsing behavior, which
provides a new idea for personalized
Jiang, Q.
Purchase Intention Analysis of Online Shoppers Based on Machine Learning and K-Means Clustering.
DOI: 10.5220/0013686100004670
Paper published under CC license (CC BY-NC-ND 4.0)
In Proceedings of the 2nd International Conference on Data Science and Engineering (ICDSE 2025), pages 259-264
ISBN: 978-989-758-765-8
Proceedings Copyright © 2025 by SCITEPRESS – Science and Technology Publications, Lda.
259
recommendation system(Fernandes & Teixeira,
2015). In terms of e-commerce website design,
Carmona et al. applied Web mining technology to
study how to improve user experience and purchase
conversion rate by optimizing website
design(Carmona et al., 2012). In addition, Cho et al.
analyzed the hesitation behavior in online shopping,
pointing out that users often face difficulties in
choosing during the shopping decision-making
process, and website design should reduce this
hesitation emotion to improve the purchase
conversion rate(Cho, Kang, & Cheon, 2006). Awad
and Khalil predicted users' Web browsing behavior
by applying the Markov model and analyzed the
relationship between users' historical behavior and
future behavior(Awad & Khalil, 2012). Through this
model, they were able to predict the user's next
behavior, which provided data support for
personalized recommendations and advertising.
Budnikas proposed a recommendation system based
on machine learning to predict whether a user will
complete a purchase by analyzing electronic
transaction data (Budnikas, 2015).
This study analyzes and predicts online shoppers'
purchase intentions by combining machine learning
methods and K-means clustering technology. Based
on a sample of 5,000 random user behavior sessions,
this paper will adopt the oversampling technique,
which can solve the problem of positive and negative
sample imbalance. After that, this paper first uses K-
means clustering to divide users into different groups
in order to better understand the differences in
purchase intent between different groups. Based on
this, multiple machine learning models, including
random forests, Extreme Gradient Boosting
(XGBoost) and artificial neural networks (ANN), are
used for training and prediction. The core goal of the
research is to identify the key factors that influence
purchase decisions and select the most suitable model
for the prediction of purchase intention by comparing
the performance of different models. At the same
time, through cluster analysis, the purchase intention
characteristics of different groups are studied to
provide more detailed customer segmentation and
personalized marketing strategies for e-commerce
platforms.
2 DATA AND METHOD
This paper mainly adopts machine learning, with
revenue as the target variable and other variables as
input variables. This research chose six different
models for calculation and comparison and finally got
the result.
2.1 Data Description
12,330 sessions' worth of feature vectors make up the
dataset. To prevent trends in any specific activity,
special date, user profile, or time period, this dataset
is constructed so that each session belongs to a
different user throughout a year. Another obvious
problem in the data is that nearly 84.5% (10,422)
were negative class samples, which is a great
imbalance. If directly analyze such samples, the
results may be very different from the actual situation.
Therefore, to balance the final negative and positive
samples of the data, this paper chose to use
oversampling in SMOTE to finally balance the
samples, which will be introduced in detail in data
pre-processing.
First of all, this paper chooses to describe all the
numerical variables. There are 10 numerical variables
in total. This paper calculates their maximum and
minimum values and mean values shown in Table 1.
Through these figures, you can learn about the
customer's browsing time, page count, habits, etc.
This can create an overall understanding of the data.
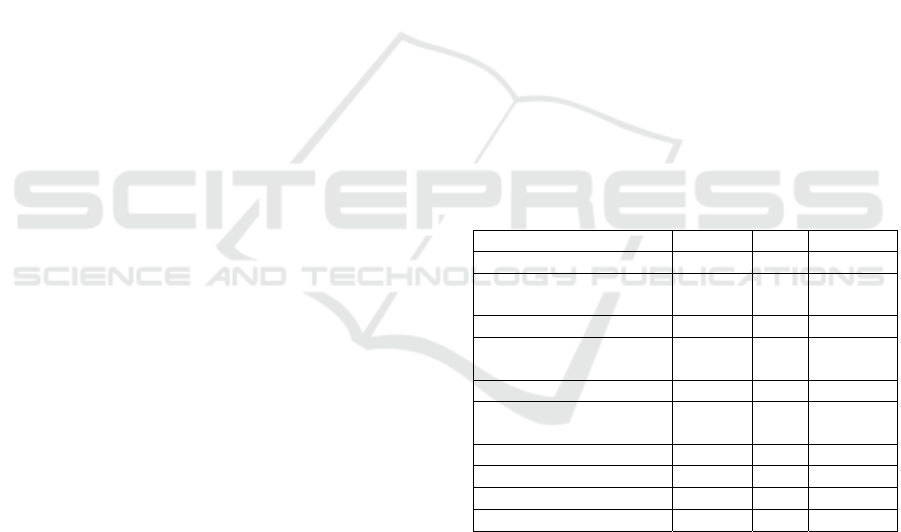
Table 1: Description of Numerical Variables.
MEAN MIN MAX
ADMINISTRATIVE 2.32 0.00 27.00
ADMINISTRATIVE
DURATION
80.82 0.00 3398.75
INFORMATIONAL 0.50 0.00 24.00
INFORMATIONAL
DURATION
34.47 0.00 2549.37
PRODUCT RELATED 31.73 0.00 705.00
PRODUCT RELATED
DURATION
1194.75 0.00 63973.52
BOUNCE RATES 0.02 0.00 0.20
EXIT RATES 0.04 0.00 0.20
PAGE VALUE 5.89 0.00 361.76
SPECIAL DAY 0.06 0.00 1.00
The purpose of this paper is to distinguish
different types of people, so as to identify potential
users for more personalized services. Therefore, the
variables used in K-Means in this paper are variables
that are closely related to customer segmentation, not
all variables in the data. As is shown in Table 2,
Administrative Duration, Informational Duration,
Product Related Duration, Bounce Rates, Exit Rates,
and Revenue. Among the 6 variables, all are numeric
variables except Revenue, which is a categorical
variable. These variables mainly concern users'
browsing time, interaction rate, exit rate, and whether
ICDSE 2025 - The International Conference on Data Science and Engineering
260
to buy on different interfaces. Through these
variables, this paper divide customers into different
groups and analyze which groups will be potential
users. This paper randomly selects and iterates four
random points to form four clusters.
Table 2: Variable of K-Means Clustering.
Feature Description Type
Administrative
Duration
Time spent on
account management
p
ages
Numerical
Informational
Duration
Time spent on
information pages
Numerical
Product Related
Duration
Time spent on
product-related
p
ages
Numerical
Bounce Rates
Average bounce rate
value of the pages
visite
d
by
the visito
r
Numerical
Exit Rates
Average exit rate
value of the pages
visite
d
by
the visito
r
Numerical
Revenue Bu
y
it or not Cate
g
orical
2.2 Data Pre-processing
After the preliminary browsing of the data, it can be
found that there are no errors in the whole data, the
data is complete, the data is large, and it is suitable for
research. In model training, this paper will select 70%
of the data for training and the remaining 30% for
testing. In order to solve the balance problem and
reduce the training time and ensure accuracy, this
paper adopts the method of random sampling to first
draw 5000 random samples, and then oversampling is
used to maintain the balance of positive and negative
samples.
2.3 Method
To make the final K-Means Clustering model can be
used to predict different populations separately. In
this paper, we will compare three models, two of
which are traditional models, Random Forest and
XGboost, while this paper chooses ANN for the deep
learning model.
2.3.1 Random Forest
Random forest is an ensemble learning algorithm
based on decision trees that improve generalization
by building multiple independent trees in parallel and
combining voting (classification) or averaging
(regression) results (Breiman, 2001). RF has shown
good performance under different requests,
outperforming many other classification algorithms
(Subudhi, Dash, & Sabut, 2020) . Its core lies in dual
randomness: during the training of each tree, the data
is randomly selected through Bootstrap sampling,
while only some features are randomly selected when
the node is split, to reduce the risk of overfitting. The
model naturally supports "data out of the bag" (OOB)
validation, evaluating performance without the need
to divide additional validation sets and output feature
importance rankings. The advantages are strong anti-
noise, processing high-dimensional data and missing
values, and training can be parallelized, but the effect
is limited in the face of high-dimensional sparse data
(such as text), and the prediction speed is slow when
the number of trees is large.
2.3.2 XGBoost
XGBoost is an iterative algorithm based on a gradient
lifting framework, which gradually optimizes
residuals by sequentially training weak classifiers
(such as decision trees), and finally outputs the
predicted results in a weighted summing manner
(Chen & Guestrin, 2016). The core optimization
includes the introduction of L1/L2 regularization to
prevent overfitting, the use of second-order
derivatives to accelerate the convergence of loss
functions, and the pre-ordering of feature loci and
automatic processing of missing values at the
engineering level to greatly improve training
efficiency. This model performs well in structured
data tasks and supports custom loss functions and
parallel computation. However, it is sensitive to
outliers due to its dependence on residual iteration,
and needs to fine-adjust the learning rate, tree depth
and other parameters. The training time increases
significantly with the growth of the data scale.
2.3.3 ANN
By simulating the structure of biological neurons,
ANN is composed of multi-layer nonlinear
transformation units and realizes complex pattern
learning with the help of activation functions (LeCun,
Bengio, & Hinton, 2015). It calculates the prediction
result by forward propagation, then adjusts the weight
parameters by backpropagation and gradient descent
algorithm. ANN is particularly good at processing
unstructured data such as images, voice, and text, and
deep network variants perform well in specific fields,
but they rely on massive annotated data and powerful
computing power, so the model interpretation is poor,
and there is a "black box" problem.
Purchase Intention Analysis of Online Shoppers Based on Machine Learning and K-Means Clustering
261
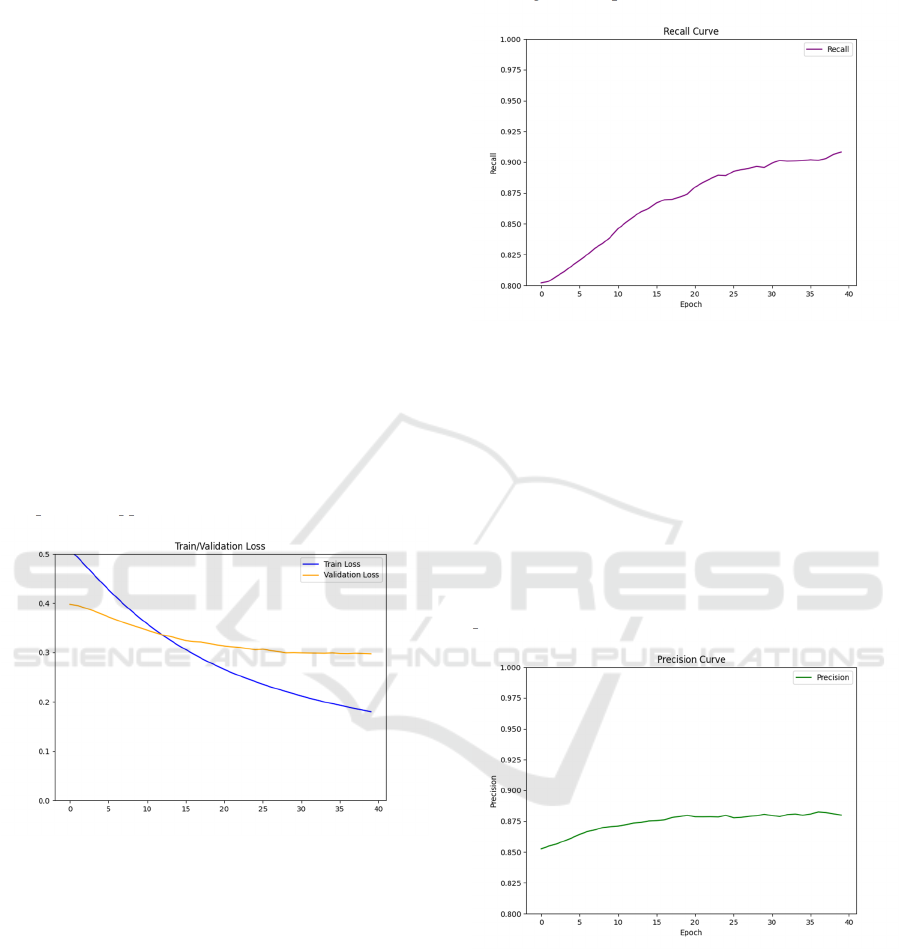
3 RESULTS
This paper trains a deep learning model under the
PyTorch framework to perform binary classification
tasks and calculate and store Train loss, Validation
loss, Precision and Recall at each epoch. The training
went through a total of 40 epochs, resulting in Figures
1, 2, and Figure 3.
3.1 Classification Results and Analysis
During training, both the training and validation
losses showed a reasonable downward trend. The
training loss decreased rapidly, indicating effective
learning and optimization of the decision boundary.
The validation loss also decreased initially and
stabilized towards the end, suggesting good
generalization and no clear overfitting. A stable
validation loss is a sign that the model maintains high
prediction accuracy even with new data. Overall, the
loss curve indicates that the dataset is well-suited for
the model, allowing for effective learning and
providing a solid foundation for further optimization
and practical application.
Figure 1: Trian/Validation Loss. (Picture credit: Original).
The recall curve (Figure 2) shows a steady
increase from 0.80 to 0.92, indicating the model’s
strong ability to identify positive samples and reduce
false negatives. A higher recall rate is crucial in
certain tasks, ensuring sensitivity to positive samples
and minimizing errors. The improvement in recall
suggests the dataset supports learning relevant
positive features, allowing the model to effectively
identify them without sacrificing accuracy. This
balance between accuracy and recall demonstrates
that the dataset is suitable for the classification task,
ensuring reliable performance.
Figure 2: Recall Curve. (Picture credit: Original).
The Precision curve (Figure 3) shows that the
accuracy increased from 0.85 and stabilized around
0.89 after 20 training rounds, indicating the model’s
high accuracy in predicting positive samples. This
stability suggests the model has fully learned the key
features to differentiate between positive and
negative classes. The clear feature expression of the
dataset supports effective model learning, ensuring
reliable classification with high precision. Thus, the
dataset is well-suited for tasks requiring precise
predictions.
Figure 3: Precision Curve. (Picture credit: Original).
In this paper, three models, Random Forest,
XGBoost, and ANN, are selected for comparison.
Finally, the most suitable Model is selected by
comparing the values of Model accuracy, model F1-
Score, Recall, and Precision.
ICDSE 2025 - The International Conference on Data Science and Engineering
262
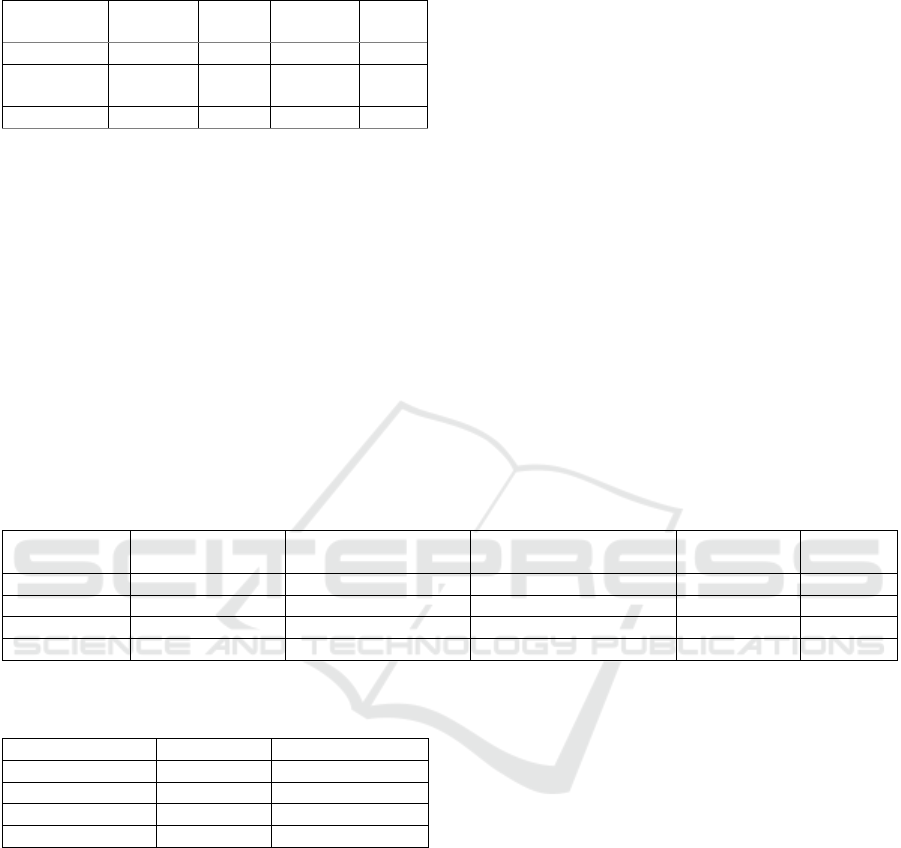
Table 3: Results of Model.
Model Accuracy
F1-
Score
Precision Recall
XGBoost 0.925 0.928 0.913 0.944
Random
Forest
0.926 0.929 0.909 0.951
Ann 0.907 0.908 0.918 0.900
As can be seen from the model results in Table 3,
the performance of three models, XGBoost, Random
Forest and ANN, is different in a number of
evaluation indicators. In terms of Model Accuracy,
random Forest performed best at 0.926, followed by
XGBoost at 0.925, while artificial neural network
accuracy was slightly lower at 0.907. On the Model
F1-score, Random Forest again scored slightly higher
than XGBoost's 0.928 at 0.929, while the artificial
neural network's F1 Score of 0.908 was lower by
comparison.
In terms of Precision, XGBoost and Random
Forest are very close at 0.913 and 0.909 respectively,
while the artificial neural network is slightly more
accurate than the other two models at 0.918. For
Recall, Random Forest has the most outstanding
performance, reaching 0.951, while XGBoost has the
recall rate of 0.944, and ANN has the lowest recall
rate, reaching 0.900.
In summary, Random Forest has the best
performance in the three key indicators of model
accuracy, F1 score and recall rate, especially in the
recall rate, which is suitable for scenarios requiring
high recall rate. XGBoost's performance in F1 scores
and recall rates is also closer to random Forest, and it
is better than Random Forest in accuracy rate, so it
may be more beneficial for application scenarios that
emphasize accuracy rate. Although the artificial
neural network is slightly higher in terms of accuracy
rate, its comprehensive performance is not as good as
the other two models. Therefore, based on the results
of this model evaluation, random forest can be
considered as the optimal model and suitable as the
final choice.
3.2 Clustering Results and Analysis
Table 4: Four Clustering.
ADMINISTRATI
VE DURATION
INFORMATIONAL_
DURATION
PRODUCTRELATED_
DURATION
BOUNCERA
TES
EXITRA
TES
CLUSTER 0 44.696 15.263 960.671 0.008 0.028
CLUSTER 1 335.347 938.524 7020.767 0.007 0.019
CLUSTER 2 2.430 0.000 39.486 0.180 0.187
CLUSTER 3 314.061 83.942 3637.348 0.005 0.017
Table 5: K-Means Clustering.
Count Accurac
y
Cluster 0 4631 0.8166
Cluster 1 117 0.7917
Cluster 2 291 0.9813
Cluster 3 905 0.8122
Table 4 and Table 5 show the K-Means results. In
the research of user behavior based on K-means
Cluster analysis, Cluster 0 shows the characteristics
of user behavior with low interest. Users in this group
often do quick browsing on e-commerce platforms,
but there are no obvious signs of deep interaction.
They performed lower on both Administrative and
ProductRelated metrics, as well as lower
ProductRelated_Duration, which indicates less
interest in specific products. In addition, these users
have higher ExitRates, meaning that they leave soon
after viewing the page without engaging in in-depth
exploration and interaction. Overall, Cluster 0 users
browse frequently but lack clear purchase intentions.
The model prediction accuracy of this group is
0.9342, which is better.
Cluster 1 users show strong purchase intent and
deep engagement, with high Administrative and
ProductRelated feature values, and a significant
increase in ProductRelated_Duration, indicating they
spend more time browsing products. They also have
higher PageValues and lower ExitRates, suggesting a
higher likelihood of making a purchase. The model
prediction accuracy for this group is 0.9167,
demonstrating strong performance.
Cluster 2 users, on the other hand, show low
interest and purchase intent, with extremely low
ProductRelated_Duration and high ExitRates,
indicating they quickly leave the platform without
engaging much. Despite their limited interaction, the
model's prediction accuracy for this group is excellent
at 0.9831.
Cluster 3 users are high-potential buyers,
displaying strong interest and engagement. They
spend more time on the platform, especially on
product-related pages, and show lower ExitRates,
Purchase Intention Analysis of Online Shoppers Based on Machine Learning and K-Means Clustering
263

0.8564, their high potential makes them a valuable
target.
In summary, these insights into user behavior can
guide e-commerce platforms in implementing
targeted, personalized marketing strategies to
optimize conversion rates and improve user
satisfaction.
4 CONCLUSIONS
This study combines machine learning and K-means
clustering technology to analyze online shoppers'
purchase intentions and proposes a data-driven
decision model to optimize precision marketing
strategies for e-commerce platforms. Through the
analysis of user session data, the study found that K-
means clustering can effectively identify the purchase
intention of different groups, and then help the e-
commerce platform to conduct more detailed user
grouping. In addition, by comparing the performance
of models such as Random Forest, XGBoost, and
ANN, the study shows that Random Forest
outperforms on metrics such as accuracy, recall, and
F1 scores, especially when it comes to identifying
potential buying users.
However, there are some limitations in this study.
First, the limited number of features in the data set
may not fully capture all the factors that influence
user behavior. Second, while K-means clustering
methods can effectively group users, more advanced
clustering algorithms or deep learning methods may
need to be further explored when dealing with highly
complex and diverse user behaviors.
Going forward, with the development of big data
technology and deep learning methods, research can
be expanded to larger data sets and incorporate more
user behavioral characteristics, such as social media
data, consumer reviews, etc. In addition, future
research can further optimize recommendation
systems and personalized marketing strategies to
provide e-commerce platforms with more effective
customer relationship management and market
competitiveness enhancement solutions. This study
provides important theoretical basis and practical
indicating they are likely comparing products and
nearing a purchasing decision. Although the
prediction accuracy for this group is slightly lower at
guidance for e-commerce platform in improving
conversion rate and user satisfaction.
REFERENCES
Awad, M. A., & Khalil, I. (2012). Prediction of user’s web-
browsing behavior: application of Markov model. IEEE
Trans Syst Man Cybern B Cybern, 42(4), 1131–1142.
Breiman, L. (2001). Random forests. Machine learning, 45,
5-32.
Budnikas, G. (2015). Computerised recommendations on e-
transaction finalisation by means of machine learning.
Stat. Transit. 16(2), 309–322.
Carmona, C. J., Ramírez-Gallego, S., Torres, F., Bernal, E.,
del Jesús, M. J., & García, S. (2012). Web usage mining
to improve the design of an e-commerce website:
OrOliveSur.com. Expert Syst Appl, 39(12), 11243–
11249.
Chen, T., & Guestrin, C. (2016, August). XGBoost: A
scalable tree boosting system. In Proceedings of the
22nd ACM SIGKDD International Conference on
Knowledge Discovery and Data Mining (pp. 785-794).
Cho, C. H., Kang, J., & Cheon, H. J. (2006). Online
shopping hesitation. CyberPsychol Behav, 9(3), 261–
274.
Fernandes, R. F., & Teixeira, C. M. (2015). Using
clickstream data to analyze online purchase intentions.
Master’s thesis, University of Porto.
LeCun, Y., Bengio, Y., & Hinton, G. (2015). Deep learning.
Nature, 521(7553), 436-444.
Mobasher, B., Dai, H., Luo, T., & Nakagawa, M. (2002).
Discovery and evaluation of aggregate usage profiles
for web personalization. Data Min Knowl Discov, 6(1),
61–82.
Moe, W. W. (2003). Buying, searching, or browsing:
differentiating between online shoppers using in-store
navigational clickstream. J Consum Psychol, 13(1–2),
29–39.
Sakar, C. O., Polat, S. O., Katircioglu, M., & Kastro, Y.
(2019). Real-time prediction of online shoppers’
purchasing intention using multilayer perceptron and
LSTM recurrent neural networks. Neural Computing
and Applications, 31(10), 6893-6908.
Subudhi, A., Dash, M., & Sabut, S. (2020). Automated
segmentation and classification of brain stroke using
expectation-maximization and random forest classifier.
Biocybern. Biomed. Eng., 40(1), 277–289.
Suchacka, G., & Chodak, G. (2017). Using association rules
to assess purchase probability in online stores. IseB,
15(3), 751–780.
ICDSE 2025 - The International Conference on Data Science and Engineering
264
