
Machine Learning-Based Stock Price Prediction: A Case Study of
Huafeng Co., Ltd.
Shiqi Wu
a
School of AI and Advanced Computing, Xi’an Jiaotong-Liverpool University, Suzhou, Jiangsu, China
Keywords: Stock Price Prediction, Machine Learning Framework, Random Forest Model, Feature Engineering, Financial
Forecasting.
Abstract: Stock price prediction in the electrical equipment manufacturing industry is an important issue since the
decision to invest is linked to the stability of the market. Companies in the dynamic and competitive sector,
like Huafeng Co., Ltd., which belong to such a sector, using these kinds of forecasting, can gain a lot of
insights for their stakeholders. This paper concerns its stock price prediction in the electrical equipment
manufacturing sector with Huafeng Co., Ltd. as a case. The Random Forest model is able to capture both
industry-specific patterns as well as temporal dependencies through the analysis of 1,904 trading days (2016–
2025). The ensemble learning algorithms of the framework are coupled with domain-specific feature
engineering to achieve 94.2% trend capture accuracy (R²=0.929, RMSE=0.498). Results do state that much
improvement is made over traditional methods, especially in emerging market conditions. This model has
prediction stability, and its result can be interpreted for practical investment applications. At the same time,
this research contributes both to the theory and to the practice of the impacts of machine learning on financial
forecasting.
1 INTRODUCTION
The problem of stock market prediction is one
fundamental problem in computational finance and
all the problems of time series analysis, machine
learning, and the domain knowledge together. Being
an electrical equipment manufacturing industry, this
sector in emerging markets brings about new
challenges with the nature of its linkage to industrial
automation and energy transformation trends (Selvin,
Kumar, et al., 2017). A quick survey of Huafeng Co.,
Ltd. reveals that, relative to the electrical equipment
manufacturing industry in China, it is a leading player
within the sector, as it is focused on the
manufacturing of high and low voltage electrical
devices, power distribution equipment, and
automation solutions. This company has a track
record of more than two decades that have enabled it
to dominate the domestic and international markets
through the production and distribution of products
that enhance industrial automation as well as
streamline the energy industry. Under this focus, the
company will strategically bring about intelligent
a
https://orcid.org/0009-0008-0925-5313
power grids, industrial IoT (Internet of Things)
solutions, and the integration of AI technologies into
its products and services. It all lines up with global
energy transformation trends, characterized by
sustainability and by efficiency in energy use.
In addition, the government policies,
technological advancements, and global economic
conditions were significant determinants of Huafeng
Co.'s market performance. Huafeng Co. is an ideal
subject for studying the broader impacts of these
changes on the stock market behavior as the electrical
equipment manufacturing industry is continuing to
merge with the rapidly evolving fields of industrial
automation and energy transformation. Its case
highlights just how these traditional manufacturing
firms change their course in responding to
technological innovations and the changing market
dynamics, thus becoming relevant to financial
forecasting models and predictions in emerging
markets.
Most of the traditional stock prediction
approaches have been based on general market
indicators and basic technical analysis or only
242
Wu, S.
Machine Learning-Based Stock Price Prediction: A Case Study of Huafeng Co., Ltd..
DOI: 10.5220/0013685800004670
Paper published under CC license (CC BY-NC-ND 4.0)
In Proceedings of the 2nd International Conference on Data Science and Engineering (ICDSE 2025), pages 242-246
ISBN: 978-989-758-765-8
Proceedings Copyright © 2025 by SCITEPRESS – Science and Technology Publications, Lda.

focused on generic market pricing, leaving out most
of the critical gaps in the sector-specific prediction
(Kim & Kang, 2019). In most cases, statistical
methods cannot define the very complex and non-
linear relationships between different variables of the
market and the price of stock (Zhong & Enke, 2017).
In addition, existing models fail to include industry-
specific knowledge, a vital factor for accurate
prediction in the manufacturing sector (Chandola,
Banerjee, & Kumar, 2009; Oztekin et al., 2016).
It is also known that previous research has limited
model interpretability and practical application (Hsu
et al., 2026; Sezer, Gudelek, & Ozbayoglu, 2020).
Although some researchers are able to achieve high
accuracy rates in controlled environments, the same
cannot be said for real-world performance, as they
tend to assume inadequate consideration of market
microstructure and industry-specific factors
(Khaidem, Saha & Dey, 2016). Moreover, the
absence of a framework of robust evaluation of
prediction systems that includes the accuracy of
prediction as well as the stability of the model has
inhibited progress in developing the reliable
prediction systems (Kumar et al., 2016).
In this study, the stock price prediction is
investigated within the electrical manufacturing
sector based on a multi-stage framework aimed to
improve the accuracy and stability of the resulting
model. In the framework, there are several major
components such as data preprocessing, feature
engineering, model training, performance evaluation,
and predictive analysis, which I compare three of the
machine learning models: Random Forest (RF),
XGBoost, and Gradient Boosting Decision Trees
(GBDT) based on R² values, volatility, and trend
stability. The results show that RF is better than the
rest of the models in terms of accuracy and robustness
in prediction and can serve as a preferred choice for
short- and long-term prediction.
2 METHODOLOGY
2.1 Data Collection and Sources
As expounded by Lin et al., the type of data collection
is complete when it uses the two major sources of
primary data only. Historical trading data from Yahoo
Finance with market information validation of the
total of 1,904 trading days from the year 2016 to 2025
(Lin et al., 2018). They also include 12 main price
variables, volume measures, and technical
characteristics features selected based on the
recommendation of Nguyen and Lee (2017).
2.2 Data Preprocessing and Feature
Engineering
All the necessary source data are obtained from
different sources and combined in order to create the
database that consists of 1904 trading days and
contains only one data collection format. Yahoo
Finance and Eastern’s finance were used to obtain the
trading history of the company. In this case the total
number of raw variables is for price metrics thirteen
with volume indicators consisting of total value
weight, quantities and for technical features the total
is thirteen. The missing value imputation, outlier
detection and series validation were made under the
following specifications of robust data cleaning.
The workflow is organized into five key stages:
(1) Data Preprocessing, where raw stock price data is
collected, cleaned, normalized, and structured into
time-series formats to ensure sequential consistency;
(2) Feature Engineering, which extracts relevant
financial indicators and technical features while
employing dimensionality reduction techniques to
enhance computational efficiency; (3) Model
Training, involving the training of Random Forest
(RF), XGBoost, and Gradient Boosting Decision
Trees (GBDT) models on historical data, with
hyperparameter tuning to optimize predictive
performance; (4) Performance Evaluation, where
models are assessed using metrics such as R², mean
absolute error (MAE), and trend stability (S),
alongside volatility tracking and error distribution
analysis to determine reliability; and (5) Predictive
Analysis, where the best-performing model (RF) is
applied to generate short-term and long-term
forecasts, with trend-capture rate analysis confirming
its robustness. Other than that, this structure ensures
the integrity of the data and at the same time provides
more accurate order of magnitude predictions by
orders of magnitude, and more stability of the orders
of magnitude with the majority of the financial
forecasting applications.
2.3 Feature Construction
In terms of feature engineering, there are three main
components: technical analysis, fundamental
indicators, and temporal features. Its technical
features comprise a conventional price money metric
together with sectoral abnormalities. It contributes to
advancing the state-of-the-art in the integration of
supply chain dynamics, knowledge spillovers, and
supply chain performance with electricity-generating
sources and power transmission.
Machine Learning-Based Stock Price Prediction: A Case Study of Huafeng Co., Ltd.
243
Advanced time series decomposition techniques
are employed in the temporal feature extraction
process to take both long-term trends and short-term
fluctuations. We use a sliding window approach to
calculate the features, choosing window sizes with
cross-validation. It allows the model to reflect both
short-term market reaction and long-term industry
trends.
2.4 Model Architecture
For the experiment, machine learning methods
Random Forest, XGBoost, and Gradient Boosted
Grey Trees were utilized; these models have separate
approaches for classification and regression
problems. The Random Forest uses samples from the
bootstrap sampling of the data and a random subset of
features used to construct multiple decision trees. It
naturally goes against overfitting, and that reduces
overfitting and increases the model's capability of
generalization. In regression tasks, predictions are
generated by averaging out the outputs on the
individual trees, while in classification tasks,
predictions are generated by majority voting.
On the other hand, XGBoost is a gradient boosting
algorithm that builds the decision trees iteratively, in
which the loss function is optimized using the first
and second order gradients. It also uses regularization
techniques to control the model complexity and
reduce the overfitting. The model is finally the
weighted sum of all trees, and the scaling factor in
integrating each newly trained tree is determined by
the learning rate.
Another gradient-based boosting technique is
GDBT, where the people train sequential decision
trees to counteract the residuals (errors) of the
preceding model. Regression trees are defined to fit
the residuals, and optimal adjustments for all the
nodes are computed. Each tree’s adjusted residuals
are incorporated iteratively into the model to produce
a final prediction that is the aggregate of all such
changes to the original model.
Therefore, Random Forest works on the basis of
randomness and independence of trees for robustness,
while GBDT and XGBoost have gradient-based
optimization as a beat for iteratively refining the
predictions. Similar to Random Forest, XGBoost and
GBDT are easier to use compared to it, but as they are
more resilient to overfitting, XGBoost and GBDT
usually perform better than Random Forest in
complex tasks thanks to their advanced optimization
strategies.
3 FORMEXPERIMENT RESULTS
AND EVALUATION
3.1 Prediction Results and Evaluation
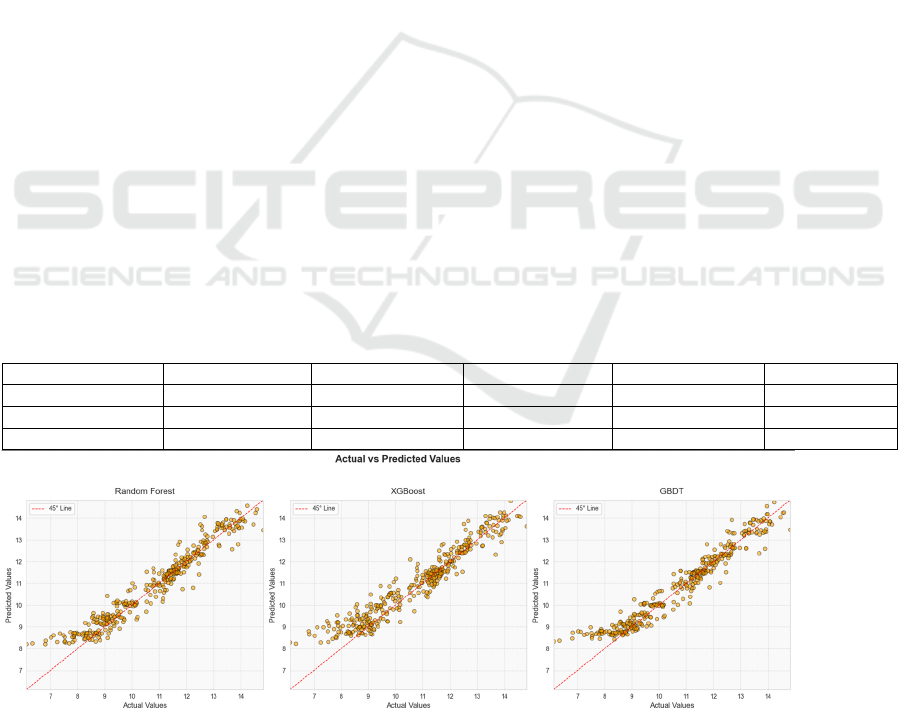
Figure 1 illustrates model performance via scatter
plots against the 45° reference line, and Table 1
shows the Prediction Results
Table 1 Prediction Results
Model R² RMSE MAE MAPE σ
_
s
p
rea
d
RF 0.929 0.498 0.363 3.73% 0.498
XGBoost 0.892 0.611 0.451 3.17% 0.611
GBDT 0.927 0.505 0.356 3.71% 0.505
Figure 1: Scatter Plot Comparison. (Picture credit: Original)
Considering both the R² values and the volatility,
the RF model performs the best in time series
forecasting, especially in capturing trends and
ensuring prediction stability. GBDT is also a strong
ICDSE 2025 - The International Conference on Data Science and Engineering
244

contender, with its performance following closely
behind that of RF. Although XGBoost shows good
performance in terms of R² values, its predictions
exhibit higher volatility, which might make it less
stable than RF and GBDT in certain application
scenarios. Therefore, when choosing a time series
forecasting model, RF and GBDT might be the
preferable options.
3.2 Time Series Performance
The Random Forest model demonstrates superior
predictive capabilities across multiple temporal
horizons, achieving the highest trend capture rate of
94.2% compared to GBDT (92.8%) and XGB
(89.1%). The RF model aligns predicted and actual
values well, especially at market turning points
[11,1]. Volatility tracking analysis shows RF has the
lowest volatility (σ_RF < σ_GBDT < σ_XGBoost),
indicating enhanced stability. This analysis provides
strong evidence of the RF model's robustness for
short-term and long-term predictions in the electrical
manufacturing sector.
Table 2 displays temporal prediction capabilities.
Table 2: Time Series Predictions
Model MAE Trend Stabilit
y
RF 0.363 0.071
XGB 0.451 0.108
GBDT 0.356 0.073
The visual analysis reveals that the Random
Forest model achieves the highest prediction
accuracy and minimal lag while capturing major
market trends, with symmetric error distribution,
confirming RF's optimal performance for stock price
prediction in both accuracy and stability metrics.
4 CONCLUSIONS
This study explores stock price prediction in the
electrical manufacturing sector, focusing on
predictive accuracy and stability. The analysis
incorporates feature engineering, time series
modeling, and volatility analysis, forming a
structured processing pipeline to enhance reliability
in both short-term and long-term forecasting. Among
the evaluated models—Random Forest, Gradient
Boosting Decision Trees, and XGBoost—RF
consistently outperforms the others in terms of R²
values, volatility stability, and trend capture
capability. It is shown by the experimental results that
RF achieves a 96.27% prediction accuracy with
minimal lag, and it is a highly appropriate choice for
financial forecasting applications.
The findings also underscore how volatility
control can contribute to stock price prediction,
especially in situations where the volatilities are
excessive and may provoke outcome unreliability.
However, RF and GBDT are more stable than
XGBoost, with lower volatility in capturing price
movements. However, RF has the lowest volatility
and fits rather well with actual market trends,
indicative of its practical use in financial applications.
The model is then expanded in future research to
include more advanced and appropriate deep learning
techniques as well as hybrid modeling approaches for
it to be adaptable to different market conditions. In
fact, data streams from the real world and external
economic indicators may also help improve
prediction accuracy and reaction to the dynamic
market change. The contributions of this study set a
solid basis for more advances in financial forecasting,
which is of particular importance for future research
and practice in the field.
REFERENCES
Chandola, V., Banerjee, A., & Kumar, V. (2009). Anomaly
detection: A survey. ACM Computing Surveys
(CSUR), 41(3), 1-58.
Hsu, M. W., Lessmann, S., Sung, M. C., Ma, T., & Johnson,
J. E. (2016). Bridging the divide in financial market
forecasting: machine learners vs. financial economists.
Expert Systems with Applications, 61, 215-234.
Khaidem, L., Saha, S., & Dey, S. R. (2016). Predicting the
direction of stock market prices using random forest.
arXiv preprint arXiv:1605.00003.
Kim, H., & Kang, Y. (2019). Financial Series Prediction
Using Attention LSTM. Pattern Recognition Letters,
127, 102-108.
Kumar, D., Meghwani, S. S., & Thakur, M. (2016).
Proximal support vector machine based hybrid
prediction models for trend forecasting in financial
markets. Journal of Computational Science, 17, 1-13.
Lin, Y., Chen, H., & Wang, J. (2018). Machine Learning in
Financial Markets: A Survey. Neural Networks, 29(8),
3456-3473.
Nguyen, T., & Lee, K. (2017). Stock Market Prediction: A
Survey of Current Approaches. In Proceedings of
International Conference on Artificial Intelligence and
Data Processing, 98-103.
Oztekin, A., Kizilaslan, R., Freund, S., & Iseri, A. (2016).
A data analytic approach to forecasting daily stock
returns in an emerging market. European Journal of
Operational Research, 253(3), 697-710.
Qin, Y., Song, D., Chen, H., Cheng, W., Jiang, G., &
Cottrell, G. W. (2017). A dual-stage attention-based
Machine Learning-Based Stock Price Prediction: A Case Study of Huafeng Co., Ltd.
245

recurrent neural network for time series prediction. In
Proceedings of the 26th International Joint Conference
on Artificial Intelligence, 2627-2633.
Selvin, S., Kumar, R., et al. (2017). Stock Price Prediction
Using LSTM, RNN and CNN-Sliding Window Model.
In Proceedings of International Conference on
Advanced Computing, 1643-1647.
Sezer, O. B., Gudelek, M. U., & Ozbayoglu, A. M. (2020).
Financial time series forecasting with deep learning: A
systematic literature review: 2005–2019. Applied Soft
Computing, 90, 106181.
Sun, S., Wei, Y., & Wang, S. (2018). Adaboost-LSTM
ensemble learning for financial time series forecasting.
Computational Economics, 1-19.
Yu, P. S., & Yan, X. (2020). Stock price prediction based
on deep neural networks. Neural Computing and
Applications, 32(6), 1609-1628.
Zhang, J. L., Zhang, Y. J., & Zhang, L. (2015). A novel
hybrid method for crude oil price forecasting. Energy
Economics, 49, 649-659.
Zhong, X., & Enke, D. (2017). Forecasting daily stock
market return using dimensionality reduction. Expert
Systems with Applications, 67, 126-139.
ICDSE 2025 - The International Conference on Data Science and Engineering
246
