
Machine Learning Approach in Lung Cancer Prediction
Zhenjie Gao
a
University of Melbourne, 649 Lonsdale Street, Victoria, Australia
Keywords: Lung Cancer, Classification, Accuracy.
Abstract: As one of the global concerns, cancer has been considered as the most threaten heterogenous disease.
Therefore, predicting cancer is a key determinant to identify potential patients, thus earlier strategies and
interventions can be applied in order to decrease death rate. Machine learning is a robust technique in field of
medication that embodies a huge variety of categorical and predictable approach that provide a platform for
human beings to learn from past events and improve furtherer in the future. In this paper, Logistic regression,
random forest algorithm and K Nearest Neighbours are taken to find the possible relation between lung cancer
and other illnesses. As a result, random forest gained the best overall accuracy of 93%. At the same time,
AUC_ROC score of 98.7% correspondingly by using classification report and ROC_AUC score. The research
provided a version of combining prediction models in cancer symptoms analysis, showing that machine
learning has the potential to cooperate with contemporary medical surgery and achieve a better performance
in the medical therapy of earlier stage of cancer.
1 INTRODUCTION
Cancer, as one of the most threaten disease throughout
the human history, its morbidity has risen sharply
through decades, also become a public issue globally.
In fact, cancer is the main reason responsible to the
increase in mortality rate, it not just stresses the patient
mentally but also causing the economic burden.
Therefore, early prediction and treatment are crucial
for enhancing the chance for them to survive.
Traditional strategies such as physical exam,
laboratory test, imaging test (CT, MRI etc) and biopsy,
although these approaches can relatively help experts
to identify and prescribe, the limitation on
effectiveness and accuracy still need to be considered
comprehensively. Since they might be outmoded,
scholars started to make further investigation in the
function of applying machine learning techniques on
predicting cancer (Mokoatle, 2023).
In several studies, researchers like Alireza and Bita
used support vector machines classifier models to
diagnose breast cancer and derived an overall
accuracy of 98.80% and 96.33% respectively (Osareh,
2010); C. Anil Kumar and other authors stated that by
using SMOTE method to predict lung cancer can get
a 98.8% of accuracy when comparing to existing
a
https://orcid.org/0009-0006-3121-5006TT
method (Kumar, 2022); Konstantina Kourou indicated
methods like Bayesian Networks, Support Vector
Machines and Decision Trees have been widely used
in cancer experiment for the improvement of
predictive models, resulting in effective and precise
decision making (Kourou, 2015). Moreover, Md.
Rezwanul Haque and his team also generated a high
f1 score of nearly 98 percent by using ANN (Islam,
2020).
The paper is going to utilize machine learning
model techniques to find potential relationships
between lung cancer and other illnesses, also using f1
score and other relevant standards to perform a rigid
and formal experiment. The whole progress is divided
into three parts, starting from the pre-processing of the
data and move to data analysis, eventually evaluate the
result and establish possible future expectations.
2 DATA AND METHOD
2.1 Data
To begin with, the investigation starts from finding
appropriate data. From various data on cancer, a
group of data that has a moderate size that was
218
Gao, Z.
Machine Learning Approach in Lung Cancer Prediction.
DOI: 10.5220/0013681300004670
Paper published under CC license (CC BY-NC-ND 4.0)
In Proceedings of the 2nd International Conference on Data Science and Engineering (ICDSE 2025), pages 218-221
ISBN: 978-989-758-765-8
Proceedings Copyright © 2025 by SCITEPRESS – Science and Technology Publications, Lda.

published two years ago has been selected- ‘survey
lung cancer’, a csv file derived from Kaggle that
contains the results of people who have lung cancer
and other illness as well (Sandragracenelson, 2023).
This group of data has approximately 300 surveys
consist of both female and male, also showing their
age and corresponding diseases such as chest pain,
yellow fingers and so on. Moreover, it is very
comprehensive for readers to look through the whole
dataset since it only contains YES/NO and integers,
which will best enhance the availability. And the
research will base on pandas to perform further model
prediction (
Evidently AI, 2021).
During the preprocessing of the data, there were
309 rows and 33 columns, which was very surprise
because the original data only contain 16 columns, so
dropping those attributes like smoothness_se that
describes the error or measurement mistake was
necessary (Naji, 2021). Secondly, the researcher
checked the potential duplicates within the data by
using the duplicated().sum() and data.isnull().sum()
to figure out if there are replicated values or null
values, fortunately, the data was clean. However, the
values among the table are categorical when the data
was downloaded from the website, so it need to be
converted into numerical values by using labelcoder
in preprocessing from import of sklearn. To continue,
plotting bar-graphs of 14 diseases in the data in order
to find possible correlations between each illness and
lung cancer, and removed columns that are not
relevant (GENDER','AGE', 'SMOKING',
'SHORTNESS OF BREATH). By the way, it was
found that anxiety and yellow-fingers are correlated,
thus, combining them and separate the ‘lung cancer’
column and other columns for the following model
establishment, then lead to the next step-models.
2.2 Method
The experiment chose 3 models on supervised
learning that could significantly represent the major
trend between lung cancer and factors, which are
Logistic Regression, KNN and random forest:
Logistic regression based on Logistic function which
mainly handle binary classification like 0/1 and
YES/NO that predict categorical outcomes; KNN
based on neighbours because it stored all cases and
classifies new cases by finding similarity of its k
neighbors, and then assigned to cases that share the
same characteristics; For the random forest, it
performs like a binary tree that classify a new object
based on their attributes, then each tree is categorized
and votes for the class (Patil, 2024).
To compare these models’ performance, packages
including classification, accuracy score and f1 score
from sklearn were used to evaluate the prediction.
Classification report provide a comprehensive
version of the model; Precision and recall refers to
proportion of positive predictions relative to total
positive predictions and total actual predictions
respectively, while f1 is the harmonic mean of
precision and recall, having a maximum of 1 (Zhang,
2024).
After splitting dataset into train and test packet, a
table was displayed which shows f1 score and
accuracy of the data under a certain model. In these
criteria, accuracy illustrates the ratio of correct
predictions and total predictions; while f1 is
beneficial in handling imbalance dataset since it is a
harmonic mean of precision and recall.
3 RESULT & ANA LYS IS
3.1 Classification Report
Based on the result, three models gained a high
accuracy (90%+), while Random Forest achieved the
highest percentage of 95.3% (Table 1). However, to
evaluate an experiment, accuracy is not the only
determinant, it should combine f1 score,
cross_val_score and AUC score, ensuring models can
balance their performance on different aspects.
Therefore, based on three classification report, the
accuracy of f1 scores were closed to each other, with
165 of samples supporting the data. In fact, when
observing the precision and recall, Logistic and
Random forest give a similar performance since they
have balanced precision, recall and f1-score.
However, KNN may be biased because it has a
perfect recall for class 0 at the cost of lower precision,
indicating the imbalance of the prediction.
Table 1 Classification report of three models
Evaluation
indicators
Logistic
Re
g
ression
KNN
Random
Forest
Precision 0.90 0.86 0.90
Recall 0.98 1.00 0.97
F1-score 0.94 0.93 0.93
Accurac
y
0.93 0.92 0.93
3.2 ROC & AUC
Altough F1-score can measure the balance between
precision and recall, relying solely on it may not be
able to completely reflect model performance due to
possible imbalances in data categories. Thus,
Machine Learning Approach in Lung Cancer Prediction
219
experiment decided to use ROC_AUC Pscore as a
new approach. This model is derived by computing
area under the Receiver Operating Characteristic
Curve, which plot the True Positive Rate against
False Positive Rate. In this case, 1 means perfect
classification and 0.5 means random guess.
Table 2 ROC_AUC score
Evaluation indicators Lo
g
istic Re
g
ression KNN Random Forest
ROC
_
AUC score 98.7% 96.3% 98.3%
From Table 2, Logistic Regression has the highest
ROC_AUC score, showing that it has the best
performance to distinguish positive and false cases
among three models. By comparing three models,
Logistic performs the best, showing a relationship of
Logistic > Random Forest > KNN.
3.3 HeatMap
In addition, in order to prove the randomness of the
data, as an alternative approach, the combination of K
fold and cross_val_score was used to test the accuracy.
The experiment used 10 K-Fold Cross-Validation,
randomly split the dataset into 10 equal-sized folds,
and each fold was then used once as a validation set
while the remaining folds formed the training set; the
process will repeat 10 times to ensure the stability of
the model. Therefore, python gave general accuracy of
these models, showing that KNN still occupy the least
accurate position, while others have an equivalent
accuracy but sometimes may differ in a slight
measurement.
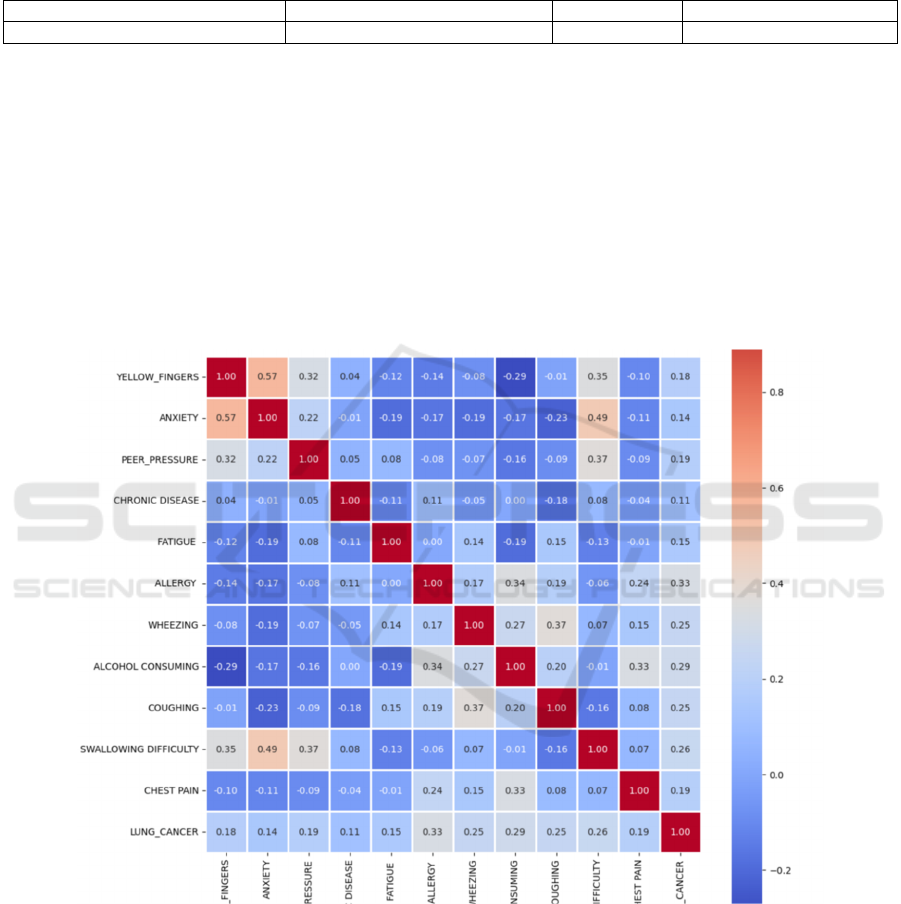
Figure 1: Heat Map between features (Picture credit : Original )
As a result, models directly demonstrated the
relationship between illnesses and lung cancer, which
is reasonable and ideal. In fact, before establishing the
models, the experiment used a heatmap to help
understanding the association between features
(Figure 1).
Heatmap has a comparative advantage that it uses
grids and colours to represent the correlation between
characteristics. This heatmap refers that the data is not
very correlated since grids are mostly blue (<0.4),
showing a weak relationship. However, the
yellow_finger and anxiety column shows a high
correlation of 0.57, so it is important to combine these
two features which will improve the accuracy of the
following predicition.
ICDSE 2025 - The International Conference on Data Science and Engineering
220

4 SUGGESTION
However, although the result showed a perfect
accuracy, there are still some improvements that can
enhance the performance of machine learning models.
From the perspective of data, it is crucial to use a large
variety of diseases data that includes latest statistics of
human, because bacteria and viruses vary along the
time, since they have strong adaptation and easier to
be fostered as well, single variation in local
environment may incur detrimental effects, such as
plague (Naji etal, 2021).
Secondly, ensuring the data is reliable that doesn’t
introduce any bias. Since the origin data is based on
survey, it is possible that people obscure their real
situation or deceive the researchers. To make a
reasonable and objective prediction, it is important to
consider aspects including ethnicity or socioeconomic
status to avoid possible discrimination or superficial
information (Hussain etal,2024).
Moreover, the parameters in supervised learning
model should be adjusted more appropriately. For
instance, KNN calculates the distance between the
new data point and the k nearest neighbours to classify
or predict regression. However, the experiment didn’t
focus on the value of K during the process; A large K
may cause less overfitting but ignore significant
patterns, smaller K results in more clusters, but lead to
overfitting of the data. Also, among various machine
learning models, choices should be concluded not just
on scientific level but also clinical aspects. By
cooperating with medical experts, models can most
efficiently used to predict the relevance of diseases so
that professors can build suitable advice and
prescription.
5 CONCLUSION
To summarize, the experiment predicted the relations
between illnesses and cancer by utilizing three kinds
of machine learning models. Among these models,
random forest performed the best, illustrating that the
relations between cancers and other symptoms were
almost related; while KNN may not be very
appropriated since it achieves the worst during
several evaluation models.
During the research, it is found that allergy,
wheezing, alcohol consuming and other illnesses or
symptoms are quite correlated with lung cancer,
which means that having these habits or symptoms
are more possible to get cancer than normal people.
Moreover, there were no direct relevance between
gender and lung cancer, showing that cancer is not
related to the difference of biological structure of
human body.
Overall, machine learning occupies an important
role in research of illnesses, with the development of
contemporary technology, human is getting closer to
the ideal life.
REFERENCES
Evidently AI, How to explain the ROC AUC score and
ROC curve? 2025,
https://www.evidentlyai.com/classification-
metrics/explain-roc-
curve#:~:text=ROC%20AUC%20score%20shows%2
0how,have%20an%20AUC%20of%200.5.
Hussain, S., Ali, M., Naseem, U., Nezhadmoghadam, F.,
Jatoi, M. A., Gulliver, T. A., & Tamez-Peña, J. G.,
2024. Breast cancer risk prediction using machine
learning: A systematic review. Frontiers in Oncology,
14.
Islam, M. M., Haque, M. R., Iqbal, H., Hasan, M. M.,
Hasan, M., & Kabir, M. N., 2020. Breast cancer
prediction: A comparative study using machine
learning techniques. SN Computer Science, 1(5).
Kourou, K., Exarchos, T. P., Exarchos, K. P., Karamouzis,
M. V., & Fotiadis, D. I., 2015. Machine learning
applications in cancer prognosis and prediction.
Computational and Structural Biotechnology Journal,
13.
Kumar, C. A., Harish, S., Ravi, P., Svn, M., Kumar, B. P.
P., Mohanavel, V., Alyami, N. M., Priya, S. S., &
Asfaw, A. K., 2022. Lung cancer prediction from text
datasets using machine learning. BioMed Research
International, 2022, 1–10.
Mokoatle, M., Marivate, V., Mapiye, D., Bornman, R., &
Hayes, V. M., 2023. A review and comparative study
of cancer detection using machine learning: SBERT
and SimCSE application. BMC Bioinformatics, 24(1).
Naji, M. A., El Filali, S., Aarika, K., Benlahmar, E. H.,
Abdelouhahid, R. A., Debauche, O., 2021. Machine
learning algorithms for breast cancer prediction and
diagnosis. In Procedia Computer Science, 191, 487-
492.
Patil, R, S., D, T. P., S, J., ,Ingale, S. P., , 2024, March 24.
A comprehensive review on cancer prediction using
machine learning techniques.
Sandragracenelson, 2023, March 23. Lung cancer
prediction. Kaggle.
https://www.kaggle.com/code/sandragracenelson/lung
-cancer-prediction
Zhang, S., Yang, L., Xu, W., Wang, Y., Han, L., Zhao, G.,
& Cai, T., 2024. Predicting the risk of lung cancer
using machine learning: A large study based on UK
Biobank. Medicine, 103(16), e37879.
Machine Learning Approach in Lung Cancer Prediction
221
