
Exploring the Connection Between Emoji Usage, User Identity and
Context Using Statistical and Machine Learning Approaches
Shaojie Wu
a
School of Mathematical Sciences, Fudan University, Shanghai, 200433, China
Keywords: Emojis, Statistical Analysis, Machine Learning.
Abstract: Due to the growing popularity in emojis on social media platforms, comprehensive researches regarding the
relationship between emoji usage and factors such as user identity, platform and context are of great
importance. Based on a dataset of typical emoji usage records, the research uses statistical analysis methods
and machine learning techniques to reach the target. In particular, chi-squared test, K-means and t-Distributed
Stochastic Neighbour Embedding (t-SNE) are used in the research. In the statistical analysis phase, the
research classifies the dataset based on different factors and compares the distributions of the subsets of data
with p-values generated by chi-squared results to determine the importance of the factors’ influences on emoji
usage. In machine learning phase, the research uses K-means to classify the users and emoji usage, to explore
the hidden user classification and emoji usage types. The research yields multiple results. In the analysis of
individual factors, context and user gender are the more important factors, while user age and platform are
less important. However, the classification concerning user gender and age combined has the greatest impact
on users’ emoji usage, showing different emoji usage distribution under the same context. The research finds
that classifying the users into 4 groups will best distinguish the users’ trends in using emojis. Finally, the
research categorizes the emoji usage behaviours into 3 classes, with 1 major usage and 2 exceptional or
sarcastic usages.
1 INTRODUCTION
Nowadays, emojis have become an indispensable part
of online communication, both delivering precise
messages that pure texts fail to express and
showcasing strong emotions that pure texts may lack
the strength (Boutet, LeBlanc, Chamberland and
Collin, 2021). The precursor to emojis originated in
Japan, where the first set of emojis with only 12x12
pixels was created in the late 1990s. In 2007,
Unicode, the international standard for text encoding,
included emojis in its character set. This rendered
emojis an opportunity to make their debut on any
online platform and operation system. By the early
2010s, emojis became a mainstream tool for online
communication, used in almost all online social
platforms (Stark and Crawford, 2015). Due to their
significance, they not only have unique semantic and
emotional features, but are also closely related to
marketing, law, health care and many other areas.
a
https://orcid.org/ 0009-0006-3403-8383
The research on emojis has become a hot topic in
the academic field, and an increasing number of
scholars from the fields of data science and
communication etc. are studying them. In the field of
data analysis and computer science, the research
topics mainly focus on these certain aspects (Bai, Dan,
Mu and Yang, 2019): 1) Analyzing emotional and
semantic meaning of emojis using big data. 2)
Switching between emojis and other expression
modalities 3) Using emojis for emotional analysis of
online data. 4) Using emojis for optimizing computer
systems. The researches mainly focus on the
expression and emotional meaning of emojis, using
deep learning and system optimization methods to
explore the usage of emojis.
In the field of communication modality, the visual
features and Unicode basis of emojis make them an
independent expressive language that is different
from text and pictures. A lot of research focuses on
connection between emoji and other modalities such
148
Wu, S.
Exploring the Connection Between Emoji Usage, User Identity and Context Using Statistical and Machine Learning Approaches.
DOI: 10.5220/0013680200004670
Paper published under CC license (CC BY-NC-ND 4.0)
In Proceedings of the 2nd International Conference on Data Science and Engineering (ICDSE 2025), pages 148-153
ISBN: 978-989-758-765-8
Proceedings Copyright © 2025 by SCITEPRESS – Science and Technology Publications, Lda.
as text, picture and video. In-depth researches on the
interconnection between emojis and texts often focus
on emoji prediction model, which predicts the emoji
used in text such as tweets and comments. For
example, a project using the BERT model was
successful in predicting most of the emojis in related
text (Ma, Liu, Wang and Vosoughi, 2020).
Apart from the academic field, the social network
applications have been using deep learning models to
recommend emojis for users based on the data they
produce, including their reading history and
published text. For example, a type of model CAPER
is able to recommend emojis based on the context
using recommender system (Zhao, Liu, Chao and
Qian, 2021).
Despite the previous researches, research gaps
still exist as most researches focus on direct
relationship between emojis and text and emoji
recommendations for users. However, the diversity of
users may have impact on the emoji preference.
Furthermore, the inter-platform comparison of emoji
is often neglected as well. Previous researches have
found that users of certain groups may have higher
frequency of using emojis (Benkhedda, Xiao and
Magdy, 2024). The research exhibited that users’
identities have impact on their choices of using
emojis. Therefore, comprehensive analysis on the
association between the users’ information such as
gender, age and the platform where they are posting,
and their emoji choices has become a research gap
that needs to be filled.
In this regard, this research aims to fill the gap
through implementation of data analysis,
visualization and machine learning methods such as
clustering and dimension reduction on a dataset
containing records of emoji posted and the users’
basic information. Specifically, the dataset is gained
from the platform Kaggle (Kaggle, 2024). This
research implements K-means clustering and t-
Distributed Stochastic Neighbour Embedding(t-SNE)
analysis to study the user groups’ emoji preference
and uses one-hot embedding to vectorize the set of
user-emoji information for further research.
2 METHOD
2.1 Dataset Preparation
This research uses the open dataset for emoji trends
to implement analysis (Kaggle, 2024). The dataset
features over 4, 000 typical records of emoji usage on
social media platforms including Twitter, Snapchat
and Facebook etc. Each record of emoji usage
includes the gender, age of the user and the context in
which the emoji is used. The context includes
happiness, sadness, support etc. The feature names
are: User Gender, User Age, Context and Platform.
The dataset contains data with 30 types of emojis, 10
types of contexts, and 6 types of platforms. The type
information is described using string. The emojis are
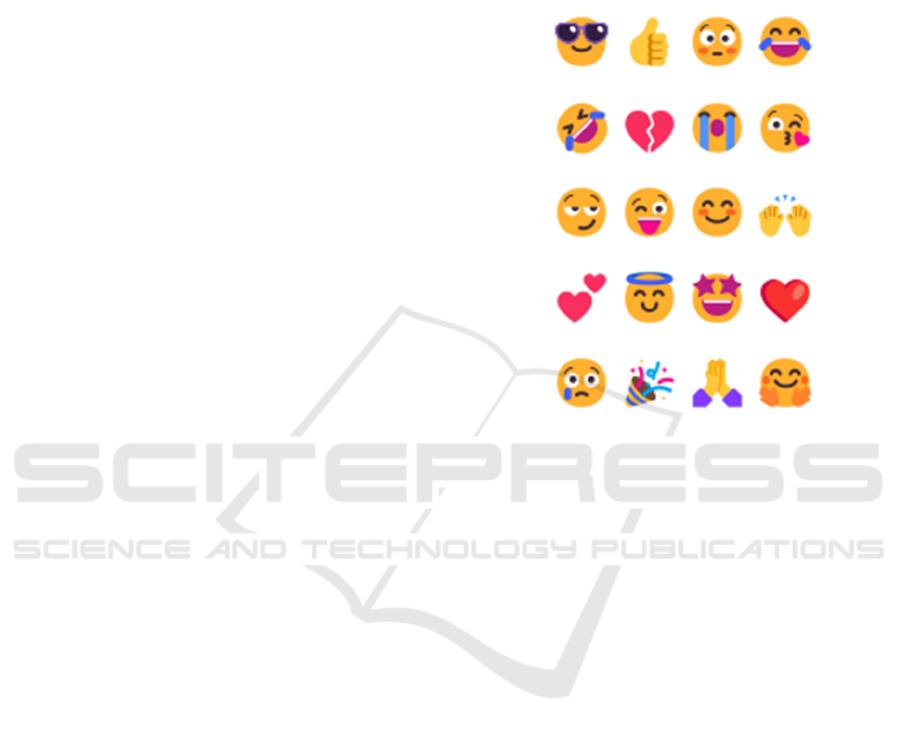
stored using Unicode. Figure 1 is an example of the
emojis in the dataset.
Figure 1: The visualization of various Emojis (Kaggle,
2024).
2.2 Statistical Analysis
A method used in the statistical analysis of the
research is chi-squared test and the corresponding p-
value analysis. To determine whether the association
between two or more variables is statistically
significant, a test of significance called the Chi-
Square Test (Mindrila, Balentyne and Tables, 2013)
is often conducted. The chi-square test method
mainly compares the observed values to the expected
values through an equation called the chi-square
statistics. Then the p-value calculated is compared to
the alpha level to determine the reliability of the
association. In this particular research, the chi-square
test is used to determine the difference and
association between the emoji usage of different
types.
The research uses a comprehensive analytical
method to study the pattern of emoji usage. First, the
research intends to study the influence of an
individual feature on the usage of emojis. The
research studies the relationship between the user
gender and the emoji usage by counting the usage of
each emoji of male and female users separately and
drawing bar plot to visualize the times of usage and
the difference by gender. The research studies the
relationship between the user age and the emoji usage
Exploring the Connection Between Emoji Usage, User Identity and Context Using Statistical and Machine Learning Approaches
149

by calculating the average user age of each emoji. The
research studies the relationship between platform
and emoji usage by two means: analyzing the top
emojis and counting the overall pattern of emoji
usage.
The research analyses and compares the top 5
emojis used in each platform and counts the pattern
of emoji usage, implementing chi-squared test and
calculating p-value to compare the difference in
distribution (Mindrila et al., 2013). Assuming the
distribution pattern of emoji usage on different social
media platforms is the same, the chi-squared test is
then used on the set of individual distribution patterns
and calculated the p-square accordingly. Similar to
the analysis method of platforms, the research finds
the top 5 emojis used in different contexts and counts
the distribution patterns. The chi-squared tests are
applied accordingly.
In addition to single-factor analysis, the research
studies the interconnection of different factors and
their impact on emoji usage. The research first
classifies all the users by their age and gender into 6
user groups: Male, Young (age 0-30); Male, Mid (age
30-60); Male, Old (age more than 60); Female,
Young; Female, Mid; Female, Old. Then the research
counts the emoji usage pattern of the 6 user groups
and uses the chi-squared test to generate the
corresponding p-value to study the difference of the
distributions. The research also considers the usage of
emojis among different user groups under different
contexts, studying the preference of users to use
emojis when expressing the same emotion. To make
the study more concentrated, the research analyzes
the count of the top 5 emojis usage under each
context. The bar plot is drawn for each context to
visualize the different usage of the top 5 emojis by
user group. Then, chi-squared test is used for the
distribution of 6 user groups under each context and
p-values are gathered. Analyzing the p-values, the
research can find out under which context the
different groups of users diverge in their choice of
emojis.
With all the statistical analysis, the research
intends to figure out the direct single-factor influence
on emoji usage as well as the combined influence of
multiple factors. Specifically, the research aims to
find and analyze the pattern of emoji usage among
different users.
2.3 Dimensional reduction and
clustering analysis
To further analyze the pattern of emoji usage, the
research uses K-means algorithm to perform
clustering and uses t-SNE after One-hot encoding to
reduce the dimension and visualize the data. K-means
is an unsupervised machine learning algorithm used
for clustering tasks (Ahmed, Seraj and Islam, 2020).
It classifies a dataset into K distinct clusters based on
minimizing the largest Euclidean distance within
each cluster. The algorithm works by initializing K
cluster centroids randomly, assigning each data point
to the nearest centroid, and then updating the
centroids based on the mean of the points in each
cluster. This process repeats until convergence,
generating the final result. t-SNE is a nonlinear
dimension reduction technique (Van and Hinton,
2008). It works by converting the high-dimensional
Euclidean distances between data points into
probabilities that represent the extent to which the
data pairs are similar. t-SNE then minimizes the
divergence between these probabilities in the lower-
dimensional space, while preserving the local
structure of the data.
In this research, the K-means algorithm is mainly
used for classifying the records of emoji usage and
users. Classification of the users with K-means can
establish categories for emoji users for further
research and study. Classification of the emoji usage
with K-means can study the different usage patterns,
for example, the normal usage or ironic usage, and
spot the special and rare usage of emojis. The t-SNE
technique is used for visualizing and validating the
result of K-means and reduce the dimension of the
data. The research first uses the K-means clustering
result of the users to regroup the users and perform
chi-squared test to generate p-value. The research
then analyzes the K-means clustering result of the
emoji usage record to distinguish different ways of
using emojis to express feelings.
3 RESULTS AND DISCUSSION
3.1 Statistical Findings
3.1.1 The Relationship Between User Gender
and Emoji Usage
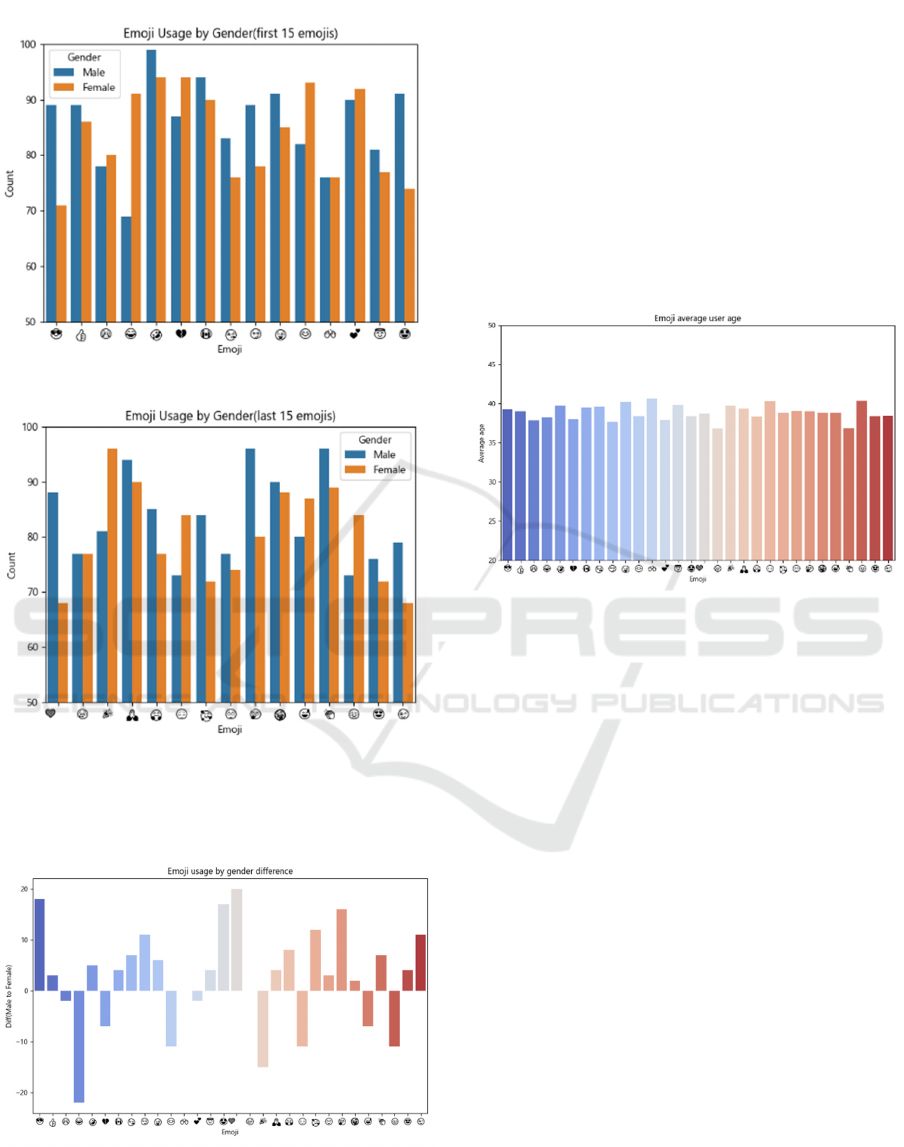
As is shown in Figure 2, the difference in user gender
will lead to notable differences in the usage of emojis.
The Figure 3 visualizes the difference and shows that
some particular emojis have more significant usage
differences caused by genders. For example, the
emojis “face with tears of joy” and “red heart” have
the biggest difference in used times by male and
female users respectively. The chi-squared test of the
emoji usage distribution of male and female users
generates a p-value of 0.941, suggesting the gender
factor is an important factor in the emoji usage
pattern.
ICDSE 2025 - The International Conference on Data Science and Engineering
150
(a)
(b)
Figure 2: Emoji usage by gender (Picture credit :
Original).
Figure 3: Emoji usage by gender difference (Picture
credit : Original).
3.1.2 The Relationship Between Average
User Age and Emoji Usage
The research finds that the average user age of each
emoji does not have notable differences as is shown
in the Figure 4. The average user age of each emoji is
from 35 to 40 with less than a difference of 5,
suggesting the average user age using emoji is around
35. The research concludes that the different emojis
do not have particular user age preferences, yet the
distributions of the user age of different emojis have
differences and will be featured in the following
sections.
Figure 4: Emoji average user age (Picture credit :
Original).
3.1.3 The Relationship Between Platform
and Emoji Usage
The research counts the record of emoji on particular
platforms and performs chi-squared test on the
statistics. The corresponding p-value is 0.060, which
is smaller than the common alpha level, suggesting
the relationship between platform and emoji usage is
unreliable. The platform on which the emoji is posted
has little impact on the actual content of the emoji
given that other factors are kept the same.
3.1.4 The Relationship Between Context and
Emoji Usage
On the basis of the conclusion that context is related
to the usage of emojis, the research finds the 5 most
used emoji under each context. The result is shown in
Figure 5. Some emojis appear in different contexts,
suggesting certain flexibility in the usage of emojis
even in opposite emotions. For example, the emoji
“Rolling on Floor Laughing” can be used under
confusion and celebration contexts.
Exploring the Connection Between Emoji Usage, User Identity and Context Using Statistical and Machine Learning Approaches
151
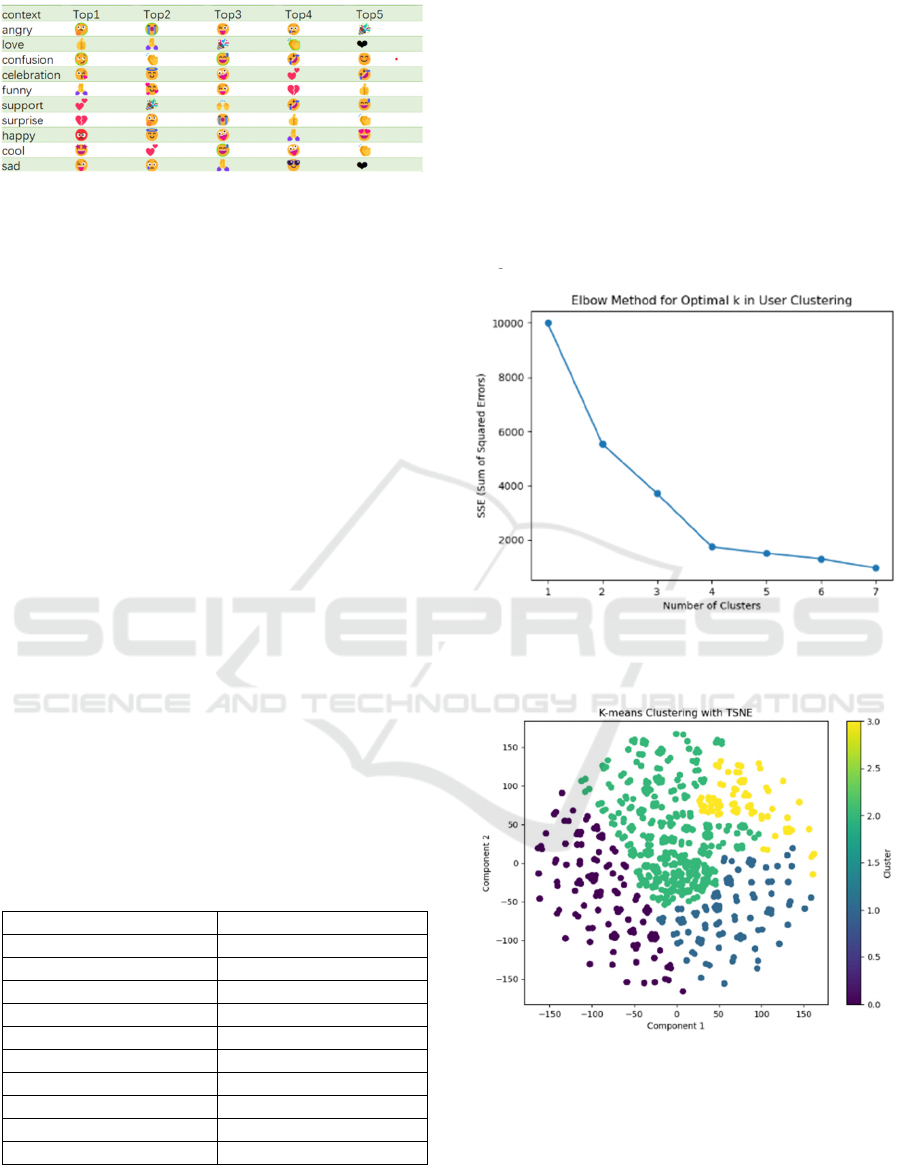
Figure 5: Most used emojis under different contexts
(Picture credit : Original).
3.1.5 The Relationship Between User Group
and Emoji Usage
The research classified the users into 6 groups, based
on their age (divided into the young, the middle-aged
and the old) and gender. The result of chi-squared
tests on the overall distribution of emoji usage of the
6 groups shows a p-value of 0.640, indicating the
significance of the user group on emoji usage. The
research finds the 5 most used emoji under each
context and within each user group. The
corresponding results mainly kept the same with the
most used emojis of all users. The research performs
chi-squared tests on all the counts of the top 5 most
used emojis under each context and within each user
group. The corresponding p-values are shown in the
Table 1. The result shows that all the p-values are
above 0.1, indicating the distribution of different user
groups’ emoji usages are different under all the
contexts. Certain contexts including love, sadness and
happiness will strengthen the difference and make the
choices of emojis of users from different groups
diverge more significantly. The p-values also show
that the effect of gender and age combined will
exceed the effect of each factor considered alone,
suggesting related researches and businesses take
both age and gender factors into consideration.
Table 1: The p-value of user-group related emoji
distributions under contexts.
Context p-value
Angry 0.366
Love 0.896
Confusion 0.294
Celebration 0.354
Funny 0.359
Support 0.650
Surprise 0.725
Happy 0.962
Cool 0.527
Sad 0.777
3.2 Machine Learning-based Analysis
3.2.1 The Clustering of Users
The research implements K-means method on the
features concerning user information. To identify the
most suitable hyperparameter K, the elbow graph is
drawn, as shown in Figure 6. The elbow graph shows
the best K is 4. The research performs one-hot
encoding and t-SNE on the data and the
corresponding results are shown in the visualization
(Figure 7).
Figure 6: Optimal K determined by the Elbow method
(Picture credit : Original).
Figure 7: The visualization of K-means results (Picture
credit : Original).
3.2.2 The Statistical Analysis of the User
Clusters
The statistical analysis methods similar to that of user
group patterns are implemented on the K-means
ICDSE 2025 - The International Conference on Data Science and Engineering
152
generated clusters. The p-value of the chi-squared test
on the emoji usage distribution of the 4 clusters
reaches 0.957, significantly higher than that of the
group classification considering user gender and age.
The result shows that the users’ K-means generated
clusters have a higher impact on the emoji usage of
users.
3.2.3 The Clustering of Emoji Usage
Records
The result of the K-means clustering of the emoji
usage is shown in Table 2. The platform factor is not
included as previous results show that the relevance
of platform and emoji usage is weak. The result
suggests that different emoji usages can be classified
into 3 clusters, with 1 cluster taking up most of the
emoji usage record. Therefore, the assumption is that
the 3 clusters represent 1 regular usage of emojis and
2 sarcastic usages of the emoji. To verify the
assumption, the research calculated the p-value of the
chi-squared tests on different clusters of emoji usage
records under the featured contexts. Because the
counts of Cluster 1 and Cluster 3 are scarce, the p-
value of the test on Cluster 1 and 3 is greatly
vulnerable to statistical mistakes. The results of the
other two tests are shown in Table 2. From the table,
the research concludes that the emoji usage
discovered in Cluster 1,3 are significantly different
from that of Cluster 2. Cluster 2 can be deemed as the
normal usage of emojis and Cluster 1 and 3 are
sarcastic or exceptional usage of emojis.
Table 2: The p-value of emoji-usage-cluster-related emoji
distributions under contexts
Context Cluster 1 & 2 Cluster 2 & 3
Angry 0.308 0.021
Love 0.023 0.711
Confusion 0.742 0.566
Celebration 0.677 0.513
Funny 0.558 0.567
Support 0.923 0.870
Surprise 0.451 0.150
Happy 0.562 0.613
Cool 0.425 0.525
Sad 0.823 0.155
4 CONCLUSIONS
In this work, a comprehensive analysis involving
multiple features of emoji users and contexts has been
implemented on a dataset of emoji usages to discover
the pattern of emoji usage in a more systematic
manner. Statistical analysis including single-feature
and multi-feature analysis and machine learning
methods are used in the research and the results are
analyzed. The research concludes that user gender has
a substantial influence on emoji usage while user age
and platform alone have a slight influence. The
research finds that user group, with age and gender
considered together, has the greatest impact on
choices of emojis under the same context. The
research also regroups the users using K-means and
the results of the new groups are more significant than
the old group. The research categorizes emoji usages
and identifies the normal usage and sarcastic or
exceptional usage within the records. However, the
result of the machine learning methods is yet to be
explained better. The preprocessing phase of machine
learning methods involves only one-hot encoding,
which is also to be extended.
REFERENCES
Ahmed, M., Seraj, R., & Islam, S. M. S. 2020. The k-means
algorithm: A comprehensive survey and performance
evaluation. Electronics, 9(8), 1295.
Bai, Q., Dan, Q., Mu, Z., & Yang, M. 2019. A systematic
review of emoji: Current research and future
perspectives. Frontiers in Psychology, 10.
Benkhedda, Y., Xiao, P., & Magdy, W. 2024. Emoji are
effective predictors of user’s demographics. In
Proceedings of the 2023 IEEE/ACM International
Conference on Advances in Social Networks Analysis
and Mining (ASONAM '23), 784–792.
Boutet, I., LeBlanc, M., Chamberland, J. A., & Collin, C.
A. 2021. Emojis influence emotional communication,
social attributions, and information
processing. Computers in Human Behavior, 119,
106722.
Kaggle. 2024. Emoji trends dataset. Retrieved from
https://www.kaggle.com/datasets/waqi786/emoji-
trends-dataset
Ma, W., Liu, R., Wang, L., & Vosoughi, S. 2020. Emoji
prediction: Extensions and benchmarking. arXiv
preprint arXiv:2007.07389.
Mindrila, D., Balentyne, P., & Tables, T. W. 2013. The Chi-
square test. The Basic Practice of Statistics, 6th ed.; WH
Freeman and Company: New York, NY, USA.
Stark, L., & Crawford, K. 2015. The conservatism of emoji:
Work, affect, and communication. Social Media +
Society, 1(2).
Van der Maaten, L., & Hinton, G. 2008. Visualizing data
using t-SNE. Journal of machine learning
research, 9(11).
Zhao, G., Liu, Z., Chao, Y., & Qian, X. 2021. CAPER:
Context-aware personalized emoji recommendation.
IEEE Transactions on Knowledge and Data
Engineering, 33(9), 3160-3172.
Exploring the Connection Between Emoji Usage, User Identity and Context Using Statistical and Machine Learning Approaches
153
