
Unveiling the Mystery of Olympic Medals Prediction: HEAH Model
with XGBoost for Predicting Olympic Medal Counts
Zicong Jin
a
School of Computer Science &Technology, Huazhong University of Science and Technology, Wuhan, China
Keywords: Olympic Medals Prediction, XGBoost, Machine Learning, Tree-structured Parzen Estimator, Joint Training.
Abstract: Every four years, the Olympic medal table experiences remarkable transformations, with new competitors
emerging and standings constantly shifting. Accurately predicting these medal counts is a complex task, as it
demands the consideration of numerous factors. The paper distills the main influential elements into four key
aspects: historical performance, sports engagement, athlete - related factors, and the host effect. Based on
these, the paper constructs the History - Engagement - Athlete - Host (HEAH) Model Framework. To enhance
prediction accuracy, the paper integrates the XGBoost machine-learning algorithm. The hyperparameters of
XGBoost are meticulously optimized using the Tree-structured Parzen Estimator (TPE) method.
Experimental results demonstrate that our HEAH - XGBoost model exhibits outstanding performance on both
training and testing datasets. It effectively captures complex relationships in the data, offering reliable
predictions for Olympic medal counts, which can assist in strategic planning for sports authorities and in
understanding the dynamics of Olympic competitions.
1 INTRODUCTION
Since Pierre de Coubertin breathed new life into the
time-honoured Olympic Games, the Olympics have
gradually become the most wide-ranging and
influential sporting events, attracting worldwide
athletes to chase glories in various categories (Malfas,
Theodoraki, & Houlihan, 2004). The Olympic medal
table, not only attracts a large quantity of attention
due to its close relationship with national prestige
(Van Hilvoorde, Elling, & Stokvis, 2010), but also
serves as an honest mirror to reflect a country’s
development and investment in the sports field
(Cetinkaya, Peker, & Kuvvetli, 2024). Therefore,
predicting the Olympic games will be of great
importance.
Through the analysis and investigation of the
background, the problem mainly lies in constructing
an effective model for predicting Olympic medal
counts, which will be expected to unveil certain
principles and help national Olympic committees to
make more informed decisions.
To be more precise, the problem can be illustrated
as follows:
a
https://orcid.org/ 0009-0005-4047-2349
Providing prediction intervals for each
country’s results;
Identifying which countries are most likely to
improve or deteriorate their standings in 2028;
Calculating the possibility of countries that
have not yet won a medal winning their first
medal;
Analysing the relationship between the events
and the number of medals countries earn.
Existing studies on Olympic medal prediction
primarily rely on historical data, economic factors,
and athlete-related features, utilizing machine
learning and statistical methods. However, these
studies often overlook dynamic features and lack
model optimization. A detailed discussion of related
work is provided in Section 2.
The main contributions of this article can be
summarized as follows:
Extract feature variables and recombine them
to establish our History-Engagement-Athlete-
Host (HEAH) model framework;
Construct an XGBoost-Based HEAH Model to
provide medal-related predictions;
Jin, Z.
Unveiling the Mystery of Olympic Medals Prediction: HEAH Model with XGBoost for Predicting Olympic Medal Counts.
DOI: 10.5220/0013679200004670
Paper published under CC license (CC BY-NC-ND 4.0)
In Proceedings of the 2nd International Conference on Data Science and Engineering (ICDSE 2025), pages 89-97
ISBN: 978-989-758-765-8
Proceedings Copyright © 2025 by SCITEPRESS – Science and Technology Publications, Lda.
89

Perform the R²test and Mean Squared Error
(MSE) to assess the model’s performance, and
compare our model with related models.
This paper can be organized as follows: the next
section provides a brief analysis of related works.
Section 3 gives the details of our methodology and
model. Section 4 describes the experiments and the
results. The proposed model performance and
analysis are presented in Section 5. To sum up,
Section 6 concludes the paper.
2 RELATED WORKS
The prediction of Olympic medal counts has drawn
significant attention in recent decades (Leeds, 2019)
since Ball's (1972) initial correlation - based scoring
model.
Early studies mainly relied on ordinary least
squares regressions (OLS) for their interpretability
(e.g., Baimbridge, 1998; Kuper & Sterken, 2001).
However, OLS had limitations in capturing nonlinear
relationships and handling outliers.
With the growth of machine learning, more
advanced models were applied. Schlembach et al.
(2022) used a two - stage Random Forest model on
socioeconomic datasets, showing that economic
development and historical performance are strong
predictors. Feature selection and data preprocessing
also advanced; Csurilla et al. (2024) used a Zero -
Inflated Beta Regression Model for better accuracy.
Despite these progressions, research gaps remain.
Few studies consider dynamic factors like athlete
performance and host effect. Also, while multiple
factors are considered, they're rarely integrated
comprehensively. And although models like
XGBoost and CatBoost are used (Sagala & Ibrahim,
2022), few studies focus on hyperparameter
optimization techniques such as the Tree - Structured
Parzen Estimator (Bergstra et al. 2011).
Thus, our research focuses on: considering
dynamic factors, integrating features
comprehensively to build a model framework, and
optimizing hyperparameters to improve model
performance.
3 METHODOLOGY
This section performs feature extraction and establish
an effective model framework. Then, the paper builds
an XGBoost-Based SEAM model to provide various
predictions.
3.1 Feature Extraction
One key issue lies in how to perform feature
engineering to obtain influential features that can
explain the number of medals for each country. To
effectively construct features, based on the
information provided by the existing dataset, the
paper has classified and summarized the potential
factors that can be used to predict the number of
medals in a country. These factors can be primarily
divided into the following four categories.
As the four main factors illustrated below show
great representativeness and uniqueness, the paper
adopts them as the four dimensions of our framework
and name it the HEAH Model Framework.
3.1.1 Historical Performance
Historical medal performance, especially in recent
Olympics, serves as a key reference for future
predictions. A country's success in specific categories
also plays a role, as nations with historical advantages
in certain events are more likely to perform well.
Additionally, trends in medal counts can reflect a
country's sports development and investment,
influencing future outcomes.
3.1.2 Engagement in Sports
The number of participants is a crucial factor in
predicting medal outcomes, as countries with larger
delegations have a higher chance of winning medals.
Similarly, the number of events a country participates
in plays an important role; the more events a country
competes in, the greater the possibility of winning
more medals, as it has a broader range of
opportunities across different fields.
3.1.3 Athletes Factors
Athletes' competitiveness is crucial in predicting
medal counts. Predictions are more accurate for
scheduled athletes, as their historical performance
offers insights into their chances of success in
upcoming events.
3.1.4 Host Effect
Advantage of host country: considering factors such
as home advantage, familiar environment, national
investment, and psychological motivation, host
countries tend to perform better in the Olympics.
ICDSE 2025 - The International Conference on Data Science and Engineering
90

3.2 Dataset
This section introduces data sources and the
preprocessing steps.
3.2.1 Data Sources
The data for this research was obtained from the
International Olympic Committee (IOC) on their
Olympics.com website.
The data used in this study include all competitors
with their sport, year, and result, complete country
medal count tables for all summer Olympics from
1896 to 2024, list of host country for all summer
Olympics from 1896 to 2032, and counts of number
of events by sport and total for all summer Olympics
from 1896 to 2032.
3.2.2 Data Preprocessing
Due to the randomness and missing records of the
data, data cleaning is necessary. This includes
correcting outliers and filling in missing values to
ensure the accuracy of subsequent analyses and the
reliability of the modelling.
Considering the practical significance of these
variables and the possible reasons for missing data
(such as incomplete data collection), outliers and
missing values were uniformly assigned a value of 0,
indicating unrecorded events, to correct the data and
ensure consistency and completeness.
Data normalization was also performed, including
the standardization of country names. Countries with
modified names were merged.
3.3 The XGBoost-based HEAH Model
This section first defines target and feature variables
with basic information. Then, the paper establishes
our model with a detailed mathematical explanation.
3.3.1 Model Preparation
Denote the number of 3 types of medals by 𝑦
gold
,
𝑦
silver
, 𝑦
bronze
. Let 𝑦
total
be the sum of the three.
Let 𝑋 be [𝑋
, 𝑋
, 𝑋
, 𝑋
, 𝑋
, 𝑋
, 𝑋
, 𝑋
, 𝑋
,
𝑋
], which represents the eigenvector. The meanings
of the covariates are as follows:
Table 1: Features and Descriptions.
Covariates Meanin
g
s
𝑋
Year
𝑋
Number of participants
𝑋
Total number of participants
𝑋
Number of teams
𝑋
Number of athletes who have won
medals
𝑋
Event expertise in the last three
Olympic Games
𝑋
Historical event expertise
𝑋
Whether it is the host country
𝑋
Total historical medal counts for all
events
𝑋
Number of times the event has been
hel
d
3.2.2 Algorithms
Our target is obtaining the prediction of the number
of medals. Due to the complexity of the data, the
paper chooses XGBoost model to solve the problem.
The predicted value is given by:
𝑦
=
∑
𝑓
𝑿
𝒊
, 𝑓
∈ℱ
1
where 𝑦
, 𝐾, ℱ, 𝑓
𝑋
being the predicted value
of sample, the total number of decision trees, the
predicted value of the 𝑘-th tree for sample, the set of
all possible regression trees (Chen & Guestrin, 2016).
The loss function of this model is given by:
ℒΘ=
∑
𝑙
𝑦
,𝑦
+
∑
Ω
𝑓
=
∑
𝑙𝑦
,𝑦
+𝑓
𝑥
+
∑
Ω𝑓
+ Ω
𝑓
2
where 𝑙
𝑦
,𝑦
, 𝑇
, 𝑤, γ, λ being the error
between the predicted value and the true value, The
number of leaf nodes of the 𝑘-th tree, the weight of
the leaf node, hyperparameter. The paper only
considers the variables related to the 𝑘-th tree, our
goal can be simplified to:
𝑎𝑟𝑔𝑚𝑖𝑛
∑
𝑙
𝑦
,𝑦
+ Ω
𝑓
3
With the second - order Taylor expansion:
𝑓𝑥
+ Δ𝑥 = 𝑓
𝑥
+𝑓
𝑥
Δ𝑥
+
𝑓
𝑥
Δ𝑥
4
Substituting the second - order Taylor expansion
into (3), the aim becomes:
Unveiling the Mystery of Olympic Medals Prediction: HEAH Model with XGBoost for Predicting Olympic Medal Counts
91
𝑎𝑟𝑔𝑚𝑖𝑛
∑
𝑙
𝑦
,𝑦
+𝑔
𝑓
𝑥
+
ℎ
𝑓
𝑥
+Ω
𝑓
5
where 𝑔
=
,
,ℎ
=
,
, with
the conditions:
𝑦
=
∑
𝑓
𝑋
6
Ω
𝑓
=γ𝑇+
λ𝑤
7
𝑙
𝑦
,𝑦
=
𝑦
𝑦
8
Calculate the coefficient of determination as a
test. The formula for the coefficient of determination
is as follows:
𝑅
=1
∑
∑
9
The paper used TPE optimization to tune
hyperparameters and train the XGBoost regression
model. The results, shown in Figure 1, indicate
excellent performance on the training dataset (𝑅
=
0.986) and strong results on the testing dataset (𝑅
=
0.827). These results illustrate that training the
XGBoost model with our HEAH Model can
effectively predict a country's medal performance.
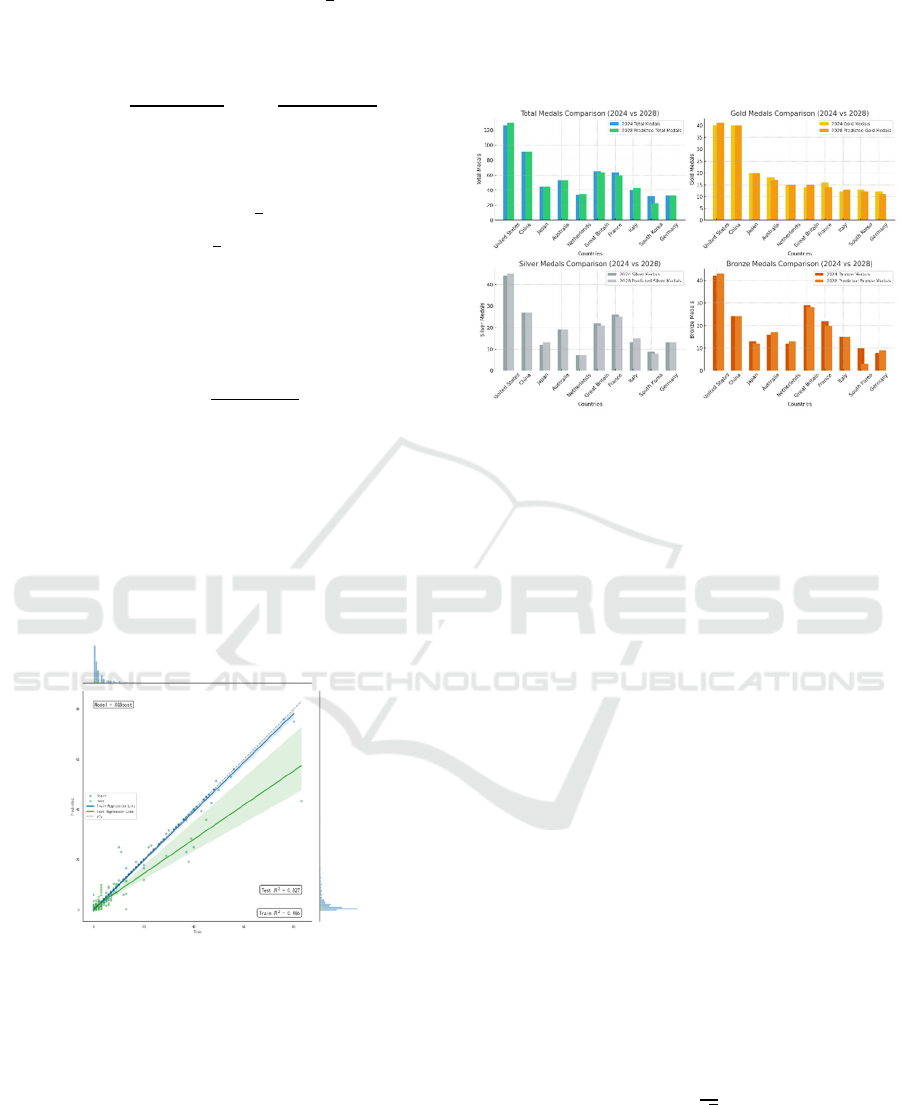
Figure 1: R-Squared test. (Picture credit: Original)
4 RESULTS
This section provides visualized results of our
experiments.
4.1 Medal Table Prediction
Derived from the XGBoost training model,
predictions for 2028 Los Angeles Summer Olympics
medal table are shown in Figure 2:
Figure 2: Medal tables and comparisons. (Picture credit:
Original)
Figure 2 presents the total medal count, along with
the numbers of gold, silver, and bronze medals for the
top 10 countries in 2028. The USA is projected to
achieve a slight increase in its total medal count
compared to 2024, reaching 126 medals and
maintaining its leading position. China’s total medal
count is predicted to remain stable at 91 medals,
securing second place. Japan, Australia, and the UK
are expected to show minor changes in their total
medal counts, with predictions of 45, 53, and 64
medals respectively.
Regarding gold medals, the USA and China are
anticipated to continue leading in 2028, with
predictions of 41 and 40 gold medals respectively.
The slight rise of United States’ gold medal count
could be influenced by home-field advantage (to be
analysed further). Japan and Australia are expected to
maintain relatively steady gold medal counts, while
European countries such as France and the United
Kingdom may experience only modest growth,
potentially limited by athlete resources. Similar
trends apply to the analysis of silver and bronze
medals.
According to the formula for the confidence
interval, the standard error (SE) is calculated as:
𝑆𝐸=
√
10
- σ: The standard deviation of the predictions
(`np.std(predictions)`).
- 𝑛: The number of samples (`len(predictions)`).
ICDSE 2025 - The International Conference on Data Science and Engineering
92
Based on our HEAP-XGBoost model, the
confidence intervals for the predicted gold, silver, and
bronze medal counts of the top 10 countries are
shown in Table 2:
Table 2: Top 10 standard deviation confidence interval for
national medal rankings in 2028.
NOC Gold(CI) Silver(CI) Bronze(CI)
USA 40.17-42.74 43.73-46.26 41.33-43.73
CHN 38.92-41.49 25.35-27.88 22.98-25.38
JPN 18.59-21.16 12.01-14.55 10.90-13.31
AUS 16.08-18.66 17.57-20.11 16.20-18.60
NED 13.60-16.17 5.67-8.21 12.04-14.45
FRA 12.34-14.91 24.14-26.88 18.60-21.00
GBR 13.28-15.85 20.08-22.62 27.15-29.55
ITA 11.35-13.92 13.88-16.41 14.25-16.65
KOR 10.54-13.11 6.89-9.42 11.82-4.22
GER 10.12-12.70 11.67-14.21 8.23-10.64
4.2 Improvement and Decrease
Based on our model using the XGBoost regression
algorithm, the top 10 countries with the most progress
and decline for the 2028 Los Angeles Olympics are
shown in the Figure 3 and Figure 4:
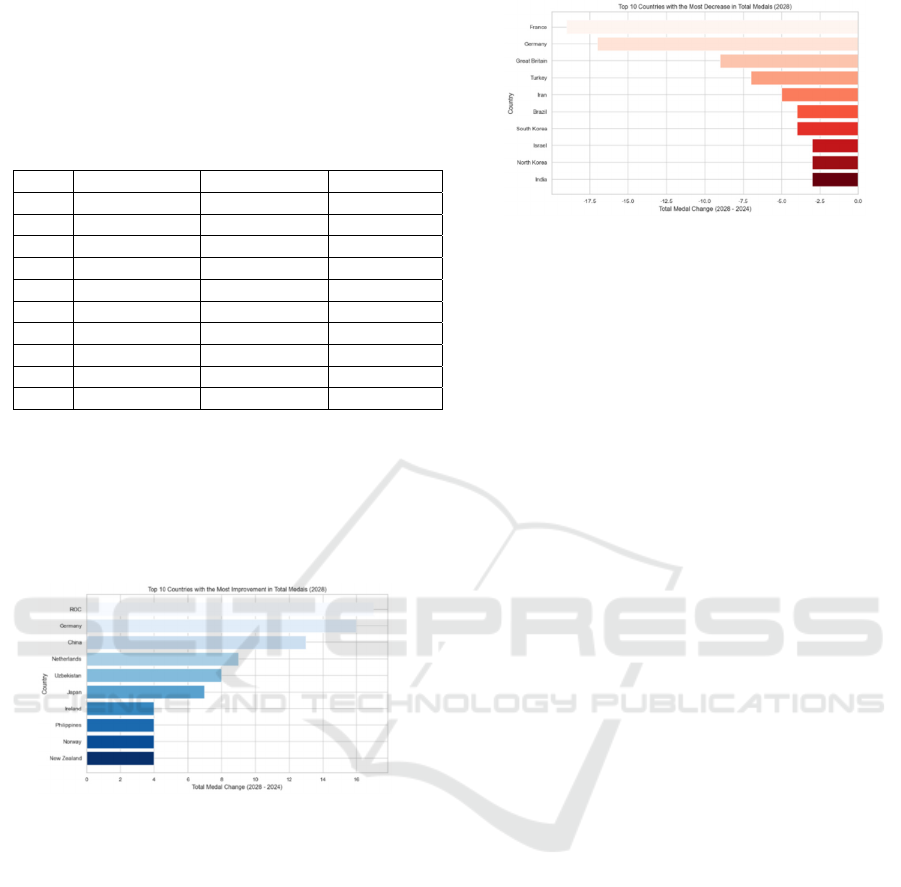
Figure 3: Top 10 countries with the most improvement in
total medals. (Picture credit: Original)
Based on the analysis of Figure 3, several
countries are poised for significant improvement in
future competitions. The United States, benefiting
from the home-field advantage, is expected to
enhance its performance. Australia, known for its
dominance in water sports, is forecasted to increase
its medal count. Meanwhile, the Netherlands, through
its continued investment sports, is likely to see a
modest increase in its overall medals.
Figure 4: Top 10 countries with the most decrease in total
medals. (Picture credit: Original)
According to the analysis of Figure 4, several
countries are anticipated to experience a decline in
performance. Japan, having lost its home-field
advantage, is expected to see a decrease in both its
total medal count and the number of gold medals,
following the peak performance achieved in 2024.
France, after the conclusion of its host-nation effect,
may witness a stabilization or slight decline in its total
medal, with potential impacts on its performance in
athletics and water sports due to the rise of competing
nations. Germany, which already demonstrated a
downward trend in its total medal count in 2024, is
expected to face continued fierce competition in 2028.
4.3 Prediction of First-Time Medallists
To address the challenge of predicting medal
outcomes for countries that have yet to win medals,
the paper developed a hybrid model combining a
standard regression model for countries with
significant medal counts and a cold-start model for
countries with limited data. By jointly training all
countries for each sport, this approach not only
resolves the cold-start issue but also reduces the cost
of model training.
4.3.1 Principles of the Model
By using joint training, our model can learn
performance patterns from countries with abundant
data while sharing relevant features with cold-start
countries, mitigating the problem of data sparsity.
Predictions for cold-start countries rely on shared
features across nations, such as sport specialization,
participation scale, and historical data.
Through calculations, the predicted number of
medals and the probabilities for countries winning
their first medals at the 2028 Olympics are shown in
Figure 5 and Figure 6:
Unveiling the Mystery of Olympic Medals Prediction: HEAH Model with XGBoost for Predicting Olympic Medal Counts
93
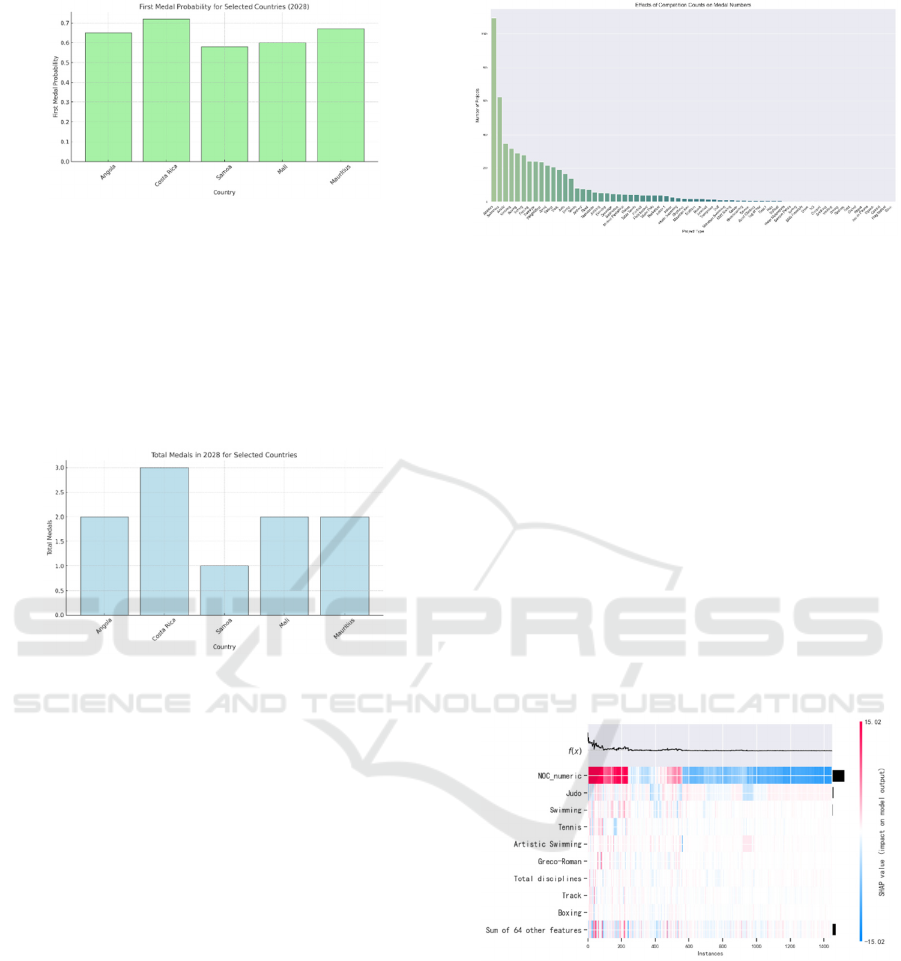
Figure 5: First medal probability for countries without
historical medals. (Picture credit: Original)
Figure 5 shows that Mauritius and Costa Rica
have the highest predicted probabilities of winning
their first medal, both exceeding 70%, indicating
strong potential for breakthroughs in specific events.
Angola, Samoa, and Mali follow closely, with
probabilities around 60–70%, demonstrating
moderate competitiveness.
Figure 6: Medal expectation for countries without
historical medals. (Picture credit: Original)
Figure 6 highlights Costa Rica’s standout
performance in total medal predictions, with an
estimated 3 medals, reflecting its athletes’
competitiveness across multiple disciplines. In
contrast, Samoa is predicted to win only 1 medal,
suggesting the need for greater investment in weaker
sports.
In summary, our model integrates
multidimensional data and provides a quantitative
assessment of the medal potential for various
countries, delivering robust and reliable predictions.
4.4 Relationship between Events and
Medals
Through data collection and processing, the paper
analysed the impact of each sport on the medal count,
as illustrated in Figure 7:
Figure 7: Each event’s contribution to the number of
medals. (Picture credit: Original)
From Figure 7, it can be observed that events like
athletics and swimming dominate in terms of the
number of competitions. Athletics holds the highest
number of events, exceeding 1,000, making it the
most prominent sport. Swimming follows closely
with approximately 600 events.
Starting from shooting, the number of events drops
significantly, indicating that most niche sports have
fewer competitions and a limited impact on the total
medal count. The figure also exhibits a clear long-tail
distribution, suggesting that medal distribution is
highly imbalanced across sports, with niche sports
contributing relatively little to the overall total.
To further analyse the relationship between sports
and a country’s medal count more accurately, the
paper used the SHAP analysis model. The
corresponding SHAP heatmap is shown in Figure 8:
Figure 8: The impact of events on each country. (Picture
credit: Original)
The figure reveals several key observations
regarding the model's predictions. The most
influential feature, NOC_numeric, encapsulates each
country's comprehensive historical data, such as past
Olympic performance, and significantly distinguishes
the model's outputs. Features related to specific sports,
including Judo, Swimming, Tennis, and Track, show
high SHAP values in certain samples, highlighting
their substantial impact on medal predictions.
ICDSE 2025 - The International Conference on Data Science and Engineering
94
Additionally, the total number of disciplines in
which a country participates exhibits a moderate
influence, suggesting that the diversity in
participation across various sports plays an important
role in determining a country's overall medal count.
In summary, key sports are crucial drivers of
medal counts. Countries should identify their
strengths in specific sports and continue to focus on
them to ensure a stable medal output.
5 ANALYSES
This section proved model validation by comparing
three models, performed two sensitivity analyses, and
discussed advantages and disadvantages of our
methodology.
5.1 Model Validation
Three relevant models (Linear Regression, XGBoost,
and SVR) were evaluated on historical data for a
country’s gold medals.
The dataset was split into a training set (70%) and
a testing set (30%) to ensure that the testing set is used
to evaluate the model’s generalization ability, while
the training set is used to optimize model parameters.
Subsequently, the R², MAE, and MSE scores for each
model were calculated on the testing set, and the
results were visualized in Figure 9:
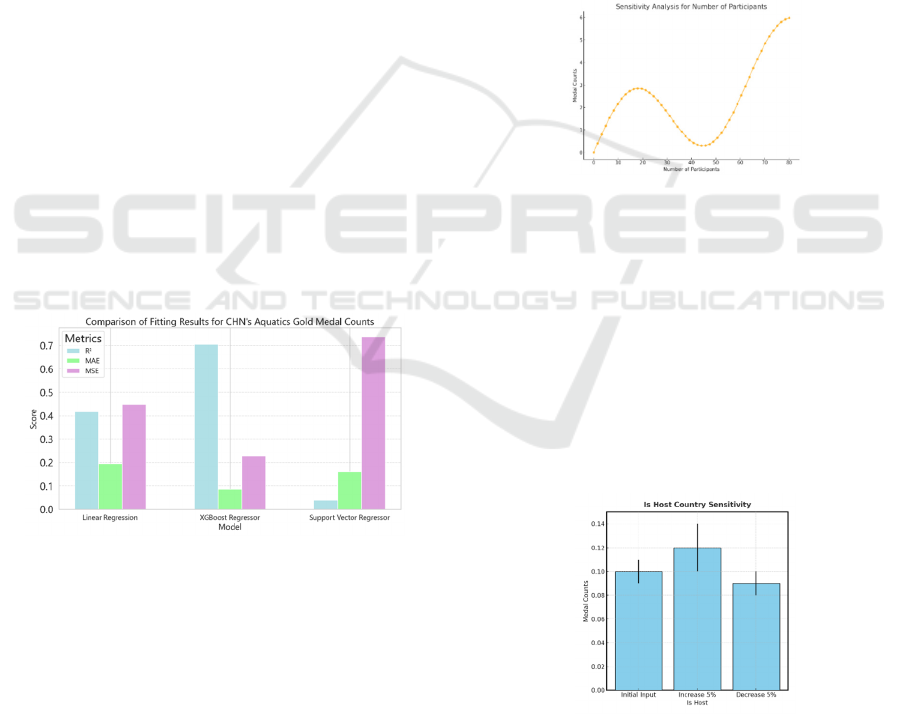
Figure 9: Comparison among linear regression, XGBoost
regressor, and support vector regressor (SVR). (Picture
credit: Original)
In summary, our model provides a quantitative
assessment of the medal potential for various
countries, delivering robust and reliable predictions.
5.2 Sensitivity Analyses
To assess how input features influence predictions of
medal counts, particularly the sensitivity of input
variables to the output of medal counts, this study
performed two detailed sensitivity analyses. These
analyses aimed to quantify the influence of two
critical variables, Number of Participants and Host
Country Status, in determining their contribution and
directional effect on the model’s predictive outcomes.
In the initial analysis, the variable Number of
Participants was systematically varied across its
entire range, divided into 50 equal intervals, while
keeping all other variables constant. This approach
enabled us to investigate the non-linear relationship
between the number of participants and the predicted
medal counts. For the second analysis, the binary
variable Host Country Status was adjusted by ±5%,
simulating scenarios of increased or decreased home-
field advantage, and the resulting changes in medal
count predictions were recorded. The findings are
illustrated in Figure 10 and Figure 11.
Figure 10: Sensitivity analysis for number of participants.
(Picture credit: Original)
Figure 10 demonstrates a pronounced upward
trend in the prediction of the medal count as the
number of participants increases, with a particularly
notable sensitivity in the low to medium participant
range. This indicates that the number of participants
is a critical driver of the variability of the medal count.
However, beyond approximately 60 participants, the
curve begins to plateau, suggesting a saturation point
where additional participants contribute diminishing
marginal benefits to medal counts.
Figure 11: Sensitivity analysis for host country status.
(Picture credit: Original)
Figure 11 highlights the sensitivity of medal
counts to changes in the Host Country Status variable.
Unveiling the Mystery of Olympic Medals Prediction: HEAH Model with XGBoost for Predicting Olympic Medal Counts
95

An increase in home-field advantage (+5%) resulted
in a 0.02 increase in predicted medal counts,
representing approximately a 20% relative increase.
Conversely, a reduction of the home-field advantage
(-5%) led to a 0.01 decrease in predicted medal counts,
corresponding to a 10% reduction. These findings
confirm the importance of home-field advantage,
albeit with a lower sensitivity compared to participant
numbers.
To sum up, the model maintains stable prediction
trajectories over multiple input scenarios, also,
reasonably responding to the changes of the key
variables. That means it further demonstrates the
robustness and adaptability of the model. What’s
more, the mode of the sensitivity test curves matches
the actual situation, confirming the overall reliability
of the results.
5.3 Advantage and Disadvantage
5.3.1 Advantage
The model incorporates multiple dimensions of
features, such as historical performance, sports
participation, athlete factors, and host country effects.
This multi-dimensional approach allows the model to
consider a wide range of influencing factors,
enhancing both the accuracy and comprehensiveness
of its predictions.
XGBoost, with its strong regularization
capabilities, is particularly well-suited for handling
large-scale datasets and reducing overfitting.
Moreover, it excels at capturing non-linear
relationships and complex interactions between
features. Based on the provided training and testing
results, the model achieved an R² of 0.986 on the
training set and 0.827 on the test set, demonstrating
excellent performance. These results indicate that the
model not only fits the training data well but also
generalizes effectively to unseen data.
5.3.2 Disadvantage
The model depends heavily on a substantial amount
of historical data, athlete participation, and event
details. Missing or inaccurate data in any of these
areas could cause instability or reduce the accuracy of
the model’s predictions.
6 CONCLUSION
In conclusion, this study aimed to address the
challenge of predicting Olympic medal counts. The
paper constructed the HEAH model framework,
incorporating historical performance, engagement in
sports, athlete factors, and host effect. By integrating
the XGBoost algorithm with hyperparameters tuned
by TPE optimization, our model demonstrated
excellent performance, achieving an 𝑅
of 0.986 on
the training set and 0.827 on the test set. The model
successfully provided predictions for medal tables,
identified countries with potential improvement or
decline, predicted first-time medallists, and analysed
the relationship between events and medals.
However, it has limitations, such as reliance on
accurate data. Overall, this research offers valuable
insights into Olympic medal prediction and can serve
as a reference for future studies in sports performance
prediction.
REFERENCES
Baimbridge, M. 1998. Outcome uncertainty in sporting
competition: the Olympic Games 1896–1996. Applied
Economics Letters, 5(3), 161-164.
Bergstra, J., Bardenet, R., Bengio, Y., & Kégl, B. 2011.
Algorithms for hyper-parameter optimization. Advances
in neural information processing systems, 24.
Cetinkaya, A., Peker, S., & Kuvvetli, Ü. 2024. Analysis of
countries' performances in individual Olympic Games
using cluster analysis and decision trees: the case of
Tokyo 2020. Sport, Business and Management: An
International Journal, 14(5/6), 648-666.
Chen, T., & Guestrin, C. 2016. Xgboost: A scalable tree
boosting system. In Proceedings of the 22nd acm sigkdd
international conference on knowledge discovery and
data mining (pp. 785-794).
Csurilla, G., & Fertő, I. 2024. How to win the first Olympic
medal? And the second? Social Science
Quarterly, 105(5), 1544-1564.
Donald, W. B. 1972. Olympic games competition:
structural correlates of national success. International
Journal of Comparative Sociology, 13, 186.
Kuper, G. H., & Sterken, E. 2001. Olympic participation
and performance since 1896. Available at SSRN
274295.
Leeds, E. M. 2019. Olympic Performance. The SAGE
Handbook of Sports Economics, 377.
Malfas, M., Theodoraki, E., & Houlihan, B. 2004. Impacts
of the Olympic Games as mega-events. In Proceedings
of the Institution of Civil Engineers-Municipal
Engineer (Vol. 157, No. 3, pp. 209-220). Thomas
Telford Ltd.
Sagala, N. T., & Ibrahim, M. A. 2022. A Comparative
Study of Different Boosting Algorithms for Predicting
Olympic Medal. In 2022 IEEE 8th International
Conference on Computing, Engineering nd Design
(ICCED) (pp. 1-4). IEEE.
Schlembach, C., Schmidt, S. L., Schreyer, D., &
Wunderlich, L. 2022. Forecasting the Olympic medal
ICDSE 2025 - The International Conference on Data Science and Engineering
96

distribution–a socioeconomic machine learning
model. Technological Forecasting and Social
Change, 175, 121314.
Van Hilvoorde, I., Elling, A., & Stokvis, R. 2010. How to
influence national pride? The Olympic medal index as
a unifying narrative. International review for the
sociology of sport, 45(1), 87-102.
Unveiling the Mystery of Olympic Medals Prediction: HEAH Model with XGBoost for Predicting Olympic Medal Counts
97
