
Predicting Stock Price Movement with LLM-Enhanced Tweet Emotion
Analysis
An Vuong and Susan Gauch
Department of Electrical Engineering and Computer Science, University of Arkansas,
1 University of Arkansas, Fayettville, Arkansas, U.S.A.
Keywords:
Emotion Analysis, Stock Prediction, Social Media, Classification, Large Language Model.
Abstract:
Accurately predicting short-term stock price movement remains a challenging task due to the market’s inherent
volatility and sensitivity to investor sentiment. This paper discusses a deep learning framework that integrates
emotion features extracted from tweet data with historical stock price information to forecast significant price
changes on the following day. We utilize Meta’s Llama 3.1-8B-Instruct model to preprocess tweet data, thereby
enhancing the quality of emotion features derived from three emotion analysis approaches: a transformer-
based DistilRoBERTa classifier from the Hugging Face library and two lexicon-based methods using National
Research Council Canada (NRC) resources. These features are combined with previous-day stock price data to
train a Long Short-Term Memory (LSTM) model. Experimental results on TSLA, AAPL, and AMZN stocks
show that all three emotion analysis methods improve the average accuracy for predicting significant price
movements, compared to the baseline model using only historical stock prices, which yields an accuracy of
13.5%. The DistilRoBERTa-based stock prediction model achives the best performance, with accuracy rising
from 23.6% to 38.5% when using LLaMA-enhanced emotion analysis. These results demonstrate that using
large language models to preprocess tweet content enhances the effectiveness of emotion analysis which in
turn improves the accuracy of predicting significant stock price movements.
1 INTRODUCTION
Financial time series forecasting, particularly stock
price prediction, has long been one of the most chal-
lenging problems for researchers and investors. With
the U.S. Securities and Exchange Commission offi-
cially transitioning the trade settlement cycle from
T+2 to T+1 on May 28, 2024 (Securities and Com-
mission, 2024), short-term trading strategies that in-
volve opening and closing positions within the same
day or by the following day, have become increas-
ingly common as traders seek to capture quick profits
from significant price movements. This shift, along
with the market’s inherent complexity and sensitiv-
ity to factors such as corporate news, macroeconomic
indicators, and investor sentiment, underscores the
growing importance of accurate stock price move-
ment prediction to support timely and informed trad-
ing decisions.
In recent years, researchers have increasingly in-
vestigated social media as a source of predictive sig-
nals for financial markets. For instance, Bollen et
al. (Bollen et al., 2011) and Nguyen et al. (Nguyen
et al., 2015) demonstrated that aggregate sentiment
from platforms such as Twitter and investor fo-
rums can enhance short-term stock movement predic-
tion. While traditional sentiment analysis typically
categorizes text into positive, negative, or neutral
(Wankhade et al., 2022), recent studies have shifted
toward emotion detection from text to capture more
nuanced linguistic signals across diverse domains, in-
cluding management and marketing, healthcare, ed-
ucation, public monitoring (Kusal et al., 2022). In
financial contexts, emotions such as fear, joy, sad-
ness, and stress extracted from social media textual
data have been shown to significantly influence short-
term returns and volatility in major indices like the
S&P 500 (Griffith et al., 2020). Although prior stud-
ies such as (Chun et al., 2022) have explored the use
of emotion features in financial forecasting, the in-
tegration of such features into stock price movement
prediction models remains relatively underexplored.
Our research developed a deep learning frame-
work that leverages emotion analysis of social me-
dia content to predict significant next-day stock price
movements. In this approach, features extracted from
the previous day are used to train the model in a su-
232
Vuong, A. and Gauch, S.
Predicting Stock Price Movement with LLM-Enhanced Tweet Emotion Analysis.
DOI: 10.5220/0013675900004000
Paper published under CC license (CC BY-NC-ND 4.0)
In Proceedings of the 17th International Joint Conference on Knowledge Discovery, Knowledge Engineering and Knowledge Management (IC3K 2025) - Volume 1: KDIR, pages 232-239
Proceedings Copyright © 2025 by SCITEPRESS – Science and Technology Publications, Lda.

pervised learning setting to classify whether the stock
will significantly increase, decrease, or remain stable
on the next day.
The main contributions of this study are as fol-
lows: (1) we leverage a large language model (Meta’s
Llama 3.1) to preprocess tweet content before apply-
ing emotion analysis, which improves the quality of
extracted emotional features; (2) we propose a novel
framework for stock price significant movement pre-
diction that integrates emotion features derived from
tweet data with daily stock price data; and (3) We sys-
tematically compare the predictive performance of a
baseline model that uses only historical stock prices
with three models that combine stock price data and
emotion features from 3 different emotion analysis
methods: the DistilRoBERTa-based Emotion Classi-
fication Model, the NRC Emotion Intensity Lexicon,
and the NRC Emotion Label Lexicon. Each emo-
tion analysis method is evaluated with and without
LLaMA-enhanced emotion analysis.
The remainder of this paper is organized as fol-
lows. Section 2 reviews related work on stock predic-
tion and the use of sentiment and emotion analysis
in financial contexts. Section 3 describes our pro-
posed methodology, including LLaMA-based tweet
preprocessing, emotion analysis on tweet data, and
the construction of the final dataset to predict signif-
icant stock price movements. Section 4 presents the
experimental results and evaluates the effectiveness of
three emotion analysis methods, both with and with-
out LLaMA-enhanced emotion analysis, in improv-
ing the accuracy of predicting significant stock price
movements. Finally, Section 5 concludes the paper
and discusses possible directions for future work.
2 RELATED WORK
Stock market prediction remains a highly active area
of research in both academia and industry. Over the
decades, numerous predictive models have been pro-
posed to address the inherent complexity and non-
linearity of financial time series.
In the 1990s, artificial neural networks (ANNs)
were the most widely used models for stock market
prediction (Atsalakis and Valavanis, 2009). For in-
stance, Kimoto et al. (Kimoto et al., 1990) imple-
mented a modular neural network model using his-
torical stock prices, technical indicators, and macroe-
conomic variables as input features to predict one-
month-ahead movements of the Tokyo Stock Price In-
dex (TOPIX). In the following decade, support vec-
tor machines (SVM) (Huang et al., 2005) and sup-
port vector regression (SVR) (Huang and Tsai, 2009)
emerged as popular alternatives, offering improved
generalization and robustness by leveraging the struc-
tural risk minimization principle. Specifically, Huang
et al. (Huang et al., 2005) applied a support vector
machine (SVM) to predict the directional movement
of the NIKKEI 225 Index using macroeconomic data,
and demonstrated that SVM outperformed artificial
neural networks (ANNs) in classification accuracy. In
the past decade, deep learning techniques have gained
increasing attention in financial forecasting. Among
them, Long Short-Term Memory (LSTM) networks
and their variants have been widely adopted for stock
market prediction (Jiang, 2021). A particularly rep-
resentative work is that of Nelson et al. (Nelson et al.,
2017), who applied an LSTM-based model to predict
stock price movement of Brazilian stocks and demon-
strated that it achieved significantly higher accuracy
compared to four traditional machine learning mod-
els.
Recent studies have increasingly incorporated ex-
ternal textual sources such as financial news, social
media, and web searches. A common method to
process this unstructured data is sentiment analysis,
which determines whether the content reflects a pos-
itive or negative outlook on the market (Balaji et al.,
2017). In 2011, Bollen et al. (Bollen et al., 2011)
used sentiment analysis to extract mood from Twitter
data and integrated these features with daily DJIA-
closing values to predict the movement of the Dow
Jones Industrial Average (DJIA). Similarly, Nguyen
et al. (Nguyen et al., 2015) proposed a hybrid model
that integrates sentiment features extracted from fi-
nancial message boards with lagged stock prices to
predict daily stock movement.
In recent years, emotion analysis has been widely
applied to domains such as healthcare, education,
marketing, and finance, with a primary focus on ana-
lyzing text from online social media, review systems,
and conversational agents (Kusal et al., 2022) (Kusal
et al., 2022). For example, Mackey et al. (Mackey
et al., 2021) proposed a fake news detection frame-
work that combines emotional features extracted from
news articles with BERT embeddings. Their model
incorporates discrete emotion vectors such as anger,
trust, and joy, as well as continuous emotion di-
mensions including valence and arousal, to improve
the classification of misinformation into categories
such as satire, hoax, propaganda, and clickbait. In
the context of stock market prediction, the applica-
tion of text-based emotion analysis remains relatively
limited. Among the few existing studies, Chun et
al. (Chun et al., 2022) proposed an emotion-based
stock prediction system that integrates multiple emo-
tional categories including joy, interest, surprise, fear,
Predicting Stock Price Movement with LLM-Enhanced Tweet Emotion Analysis
233

anger, sadness, and disgust, extracted from investor
microblogs. Their model was designed to predict the
daily directional movement of the KOSPI 200 index
futures based on these multidimensional emotional
indicators.
3 APPROACH
In this section, we present our framework for predict-
ing significant stock price movements by integrating
emotion analysis results from tweet content with his-
torical stock price data. Figure 1 illustrates that our
approach comprises three main components: (1) pre-
processing stock-related tweets using a large language
model, (2) generating three sets of emotion features
using a transformer-based classifier and two lexicon-
based methods, and (3) integrating the extracted emo-
tion features with historical stock prices to construct
the final dataset, which is then used to train an LSTM
model to predict the next day’s significant stock price
movement.
3.1 Llama-Based Tweet Preprocessing
Let D = {x
1
, x
2
, ...,x
N
} denote a dataset of N tweets,
where each x
i
is a raw tweet content. To extract emo-
tional information from these tweets, we employ a
prompt-based querying mechanism using the Meta’s
Llama 3.1-8B-Instruct model (AI, 2024). For each
tweet x
i
∈ D, we construct a prompt x
prompt
i
that is
passed into the LLM to produce a set of predicted
emotion annotations, denoted by ˆy
LLM
i
:
ˆy
i
LLM
= LLM(x
i
prompt
)
Prompt Template. Each tweet x
i
is passed into the
following prompt template to create the final input
x
prompt
i
for the LLaMA model:
You will be given a human-written tweet.
Identify all possible emotions expressed in
the tweet. Return the output as a comma-
separated list of emotion-related words that
are relevant to the stock market context. If no
emotion is detected, return ”no emotion”.
Tweets that return “no emotion” are removed
(LLaMA-based emotion filtering). The remaining
tweets are then further preprocessed using the NLTK
toolkit, including converting text to lowercase, re-
moving stop words and punctuation. Examples of
LLaMA-based tweet preprocessing are provided in
Table 1.
3.2 Emotion Analysis
In this study, we explore three emotion analysis meth-
ods applied to stock-related tweets. Each method
produces a different emotion representation, which
is then combined with daily stock price data to form
multiple versions of the final dataset.
Method 1 (DistilRoBERTa) utilizes a pre-trained
DistilRoBERTa-based model available through the
Hugging Face library (Hartmann, 2022). For each
tweet, the model returns probability scores across
seven emotions. These scores represent the model’s
confidence in the presence of each emotional state and
form the following seven-dimensional emotion vec-
tor:
E
1
= {anger, disgust, neutral, fear, joy, sadness,
surprise}
Method 2 (NRC-Intensity) and Method 3
(NRC-Binary) are lexicon-based methods that gen-
erate tweet-level emotion vectors using the Na-
tional Research Council Canada (NRC) emotion re-
sources (Mohammad and Turney, 2013). We follow
the emotion vector construction approach described
in Mackey et al. (Mackey et al., 2021), where each
text instance is represented by aggregating lexicon-
based emotion scores of matched tokens. In this work,
each tweet is tokenized and matched against the cor-
responding lexicon to compute an emotion vector.
In Method 2, each token is assigned an intensity
score ranging from 0 to 1 across the following eight
emotions:
E
2
= {anger, anticipation, disgust, fear, joy,
sadness, surprise, trust}
In Method 3, each token is assigned a binary score
(0 or 1) for ten emotion categories, including two ad-
ditional polarity dimensions:
E
3
= {anger, anticipation, disgust, fear, joy,
sadness, surprise, trust, positive, negative}
For both methods, the normalized score for each emo-
tion i is calculated as:
ˆe
i
=
1
|M|
∑
w∈T
s(w, i),
where T is the set of tokens in the tweet, M is the
subset of tokens matched to at least one emotion, and
s(w, i) represents either the intensity score (Method 2)
or the binary score (Method 3) for word w and emo-
tion i.
KDIR 2025 - 17th International Conference on Knowledge Discovery and Information Retrieval
234
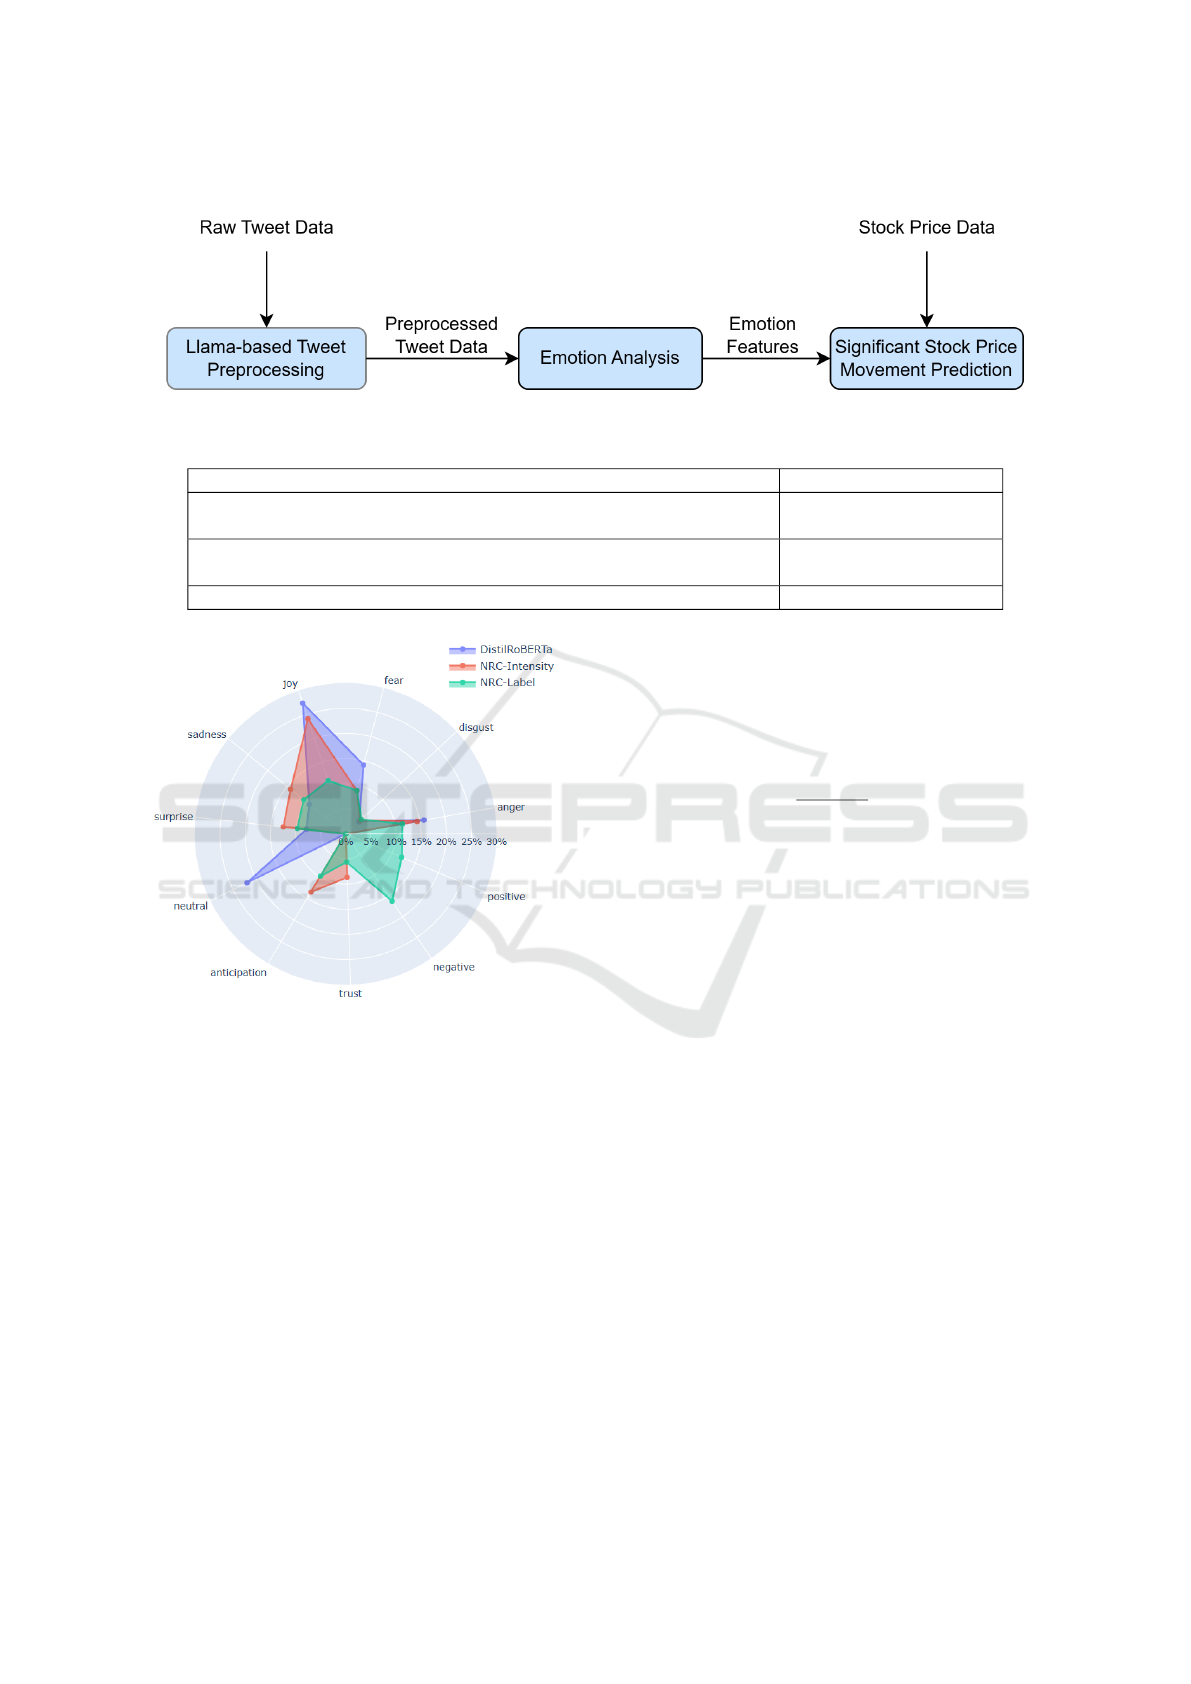
Figure 1: The overall pipeline for predicting significant stock price movements.
Table 1: Examples of Llama-based tweet preprocessing.
Tweet Extracted Emotions
CPI numbers drop tomorrow. If it comes in soft, TSLA is gonna explode.
Loaded up today.
anticipation, excitement,
confidence
Feeling uneasy about tomorrow’s Fed meeting. Already trimmed some
AAPL just in case.
anxiety, fear, caution
MSFT Q2 report is scheduled for Thursday after market close. no emotion
Figure 2: Distribution of extracted emotions from tweets
using three different emotion analysis methods.
3.3 Significant Stock Price Movement
Prediction
After computing tweet-level emotion scores, we ag-
gregate them by day to obtain the average probability
of each emotion. These daily averages reflect how
strongly and frequently each emotion is expressed
across tweets, providing insight into the dominant
emotional tone of the day. This information serves
as a valuable signal for predicting stock price move-
ments. Additionally, we record the number of raw
tweets before Llama-based filtering to capture daily
public attention. A higher tweet volume may indicate
increased market interest and a greater likelihood of
significant price movement.
Historical stock price data is collected from Yahoo Fi-
nance (Yahoo Finance) to align with the tweet dataset.
To capture daily price volatility of each stock, we cal-
culate the daily percentage change of the closing price
as follows:
PC
t
=
P
t
− P
t−1
P
t−1
× 100
where PC
t
is the percentage change of the closing
price at day t, P
t
is the closing price at day t, and P
t−1
is the closing price on the previous day t −1.
Each stock price movement is then classified into
one of three classes based on the standard deviation
(σ) of its percentage changes:
• Stable: if the daily percentage change is within
[−σ, +σ]
• Significant Increase: if the daily percentage
change exceeds +σ
• Significant Decrease: if the daily percentage
change is lower than −σ
After labeling, each day’s stock price data is
merged with the corresponding emotion features, in-
cluding the average emotion scores and tweet volume.
The final dataset consists of the following features:
• Date
• Change Level: stock price movement label (Sta-
ble, Significant Increase, Significant Decrease)
• Stock Price Features: open price, close price,
high price, low price, volume
• Emotion Features: daily average emotion scores
and tweet volume
Predicting Stock Price Movement with LLM-Enhanced Tweet Emotion Analysis
235

Figure 3: Class distribution of daily significant stock price movements for TSLA, AAPL, and AMZN.
We formulate the prediction of significant stock
price movements as a multi-class classification task,
where the goal is to categorize daily stock movement
into three classes: Stable, Significant Increase, and
Significant Decrease.
Following prior studies, we adopt Long Short-Term
Memory (LSTM) networks due to their effectiveness
in modeling sequential dependencies and non-linear
patterns in financial time series data (Jiang, 2021).
The LSTM model consists of two stacked LSTM lay-
ers with 128 hidden units each, followed by Dropout
layers with a rate of 0.2 to prevent overfitting. The fi-
nal Dense layer with softmax activation outputs the
probability distribution across the three movement
classes: Stable, Significant Increase, and Significant
Decrease. The model is trained using the Adam opti-
mizer with a learning rate of 0.01 for 200 epochs and
a batch size of 32.
4 EXPERIMENTS
4.1 Dataset
In this study, we used stock-related tweets collected
from an open-source dataset on Kaggle (equinxx,
2022), covering the period from September 30, 2021
to September 30, 2022. The dataset includes tweets
associated with three prominent U.S. technology
stocks: Tesla (TSLA), Apple (AAPL), and Amazon
(AMZN). Each tweet entry contains the tweet con-
tent, posting date, stock ticker, and company name.
Table 2 presents the number of tweets of each stock
before and after applying Llama-based emotion filter-
ing.
The second data source is historical daily stock
price data for TSLA, AAPL, and AMZN, collected
from Yahoo Finance. This data includes five columns:
open, close, high, low prices, and trading volume.
The stock price data corresponds to the same period
as the tweet dataset. After applying emotion anal-
ysis to the emotion labels extracted by the Llama-
Table 2: Tweet Volume Before and After Llama-Based Fil-
tering.
Stock
Name
Tweets Volume
Before Filtering
Tweets Volume
After Filtering
TSLA 37173 18080
AAPL 5033 2046
AMZN 4077 1659
based tweet preprocessing, the results were merged
with corresponding stock price data, we constructed
a combined dataset covering the period from Septem-
ber 30, 2021 to September 30, 2022.
4.2 Experiment Setup
We conduct experiments under two main settings to
evaluate the contribution of emotion features in pre-
dicting significant stock price movements. First, we
establish a baseline by training an LSTM model us-
ing only historical stock price features. Next, we
augment the model with emotion features derived
from three different emotion analysis methods: (1) a
DistilRoBERTa-based Emotion Classification Model
(DistilRoBERTa), (2) NRC Emotion Intensity Lex-
icon (NRC-Intensity), and (3) NRC Emotion Label
Lexicon (NRC-Lexicon). Each method is evaluated
under two different stock prediction methods:
• Emotion Analysis: Emotion features are ex-
tracted from tweets that have been preprocessed
using standard text cleaning techniques (e.g., tok-
enization, stopword removal with NLTK toolkit).
• Llama-enhanced Emotion Analysis: Tweets are
first preprocessed using Meta’s Llama 3.1-8B-
Instruct model to extract emotion labels and then
remove tweets with no emotional content. The re-
maining tweets are then further cleaned using the
same NLTK preprocessing before applying emo-
tion analysis.
In both stock prediction methods, emotion fea-
tures, tweet volume before emotion-based filtering,
KDIR 2025 - 17th International Conference on Knowledge Discovery and Information Retrieval
236

and stock price features from the previous trading day
are used to predict the movement class (Stable, Sig-
nificant Increase, or Significant Decrease) for the fol-
lowing day. This design choice is motivated by prior
findings that the predictive power of tweet-based sen-
timent signals decays rapidly over time, with one-day
lagged sentiment exhibiting the strongest correlation
with stock price movements (Teti et al., 2019).
The combined dataset covers the period from
September 30, 2021 to September 30, 2022, which
includes 250 trading days. We split the data chrono-
logically into 70% for training (175 days) and 30%
for testing (75 days). Each experimental configura-
tion is run 10 times to account for the randomness in
LSTM training, and we report the average results to
ensure consistency and robustness.
To evaluate the classification performance of our
models, we use four metrics, each capturing the
model’s ability to detect a specific type of stock price
movement:
• Significant Increase Accuracy (S-I): Accuracy
in predicting days with a significant upward price
movement.
• Significant Decrease Accuracy (S-D): Accuracy
in predicting days with a significant downward
price movement.
• Stable Accuracy: Accuracy in identifying days
when the stock price remains within a stable
range.
• Average S-I and S-D Accuracy: The average
accuracy of predicting significant increase and
significant decrease movements, reflecting the
model’s overall ability to capture high-volatility
movements.
4.3 Experimental Results
Table 3 summarizes the result of the stock predic-
tion method using emotion analysis methods , includ-
ing DistilRoBERTa, NRC-Intensity, and NRC-Label.
The results show that incorporating emotion features
improves the model’s ability to detect high-volatility
movements. Specifically, the overall average of S-
I and S-D accuracy across all three stocks increases
from 13.5% (baseline) to 23.6% (DistilRoBERTa),
18.8% (NRC-Intensity), and 23.1% (NRC-Label).
While this improvement results in a decrease in sta-
ble accuracy, from 81.9% (baseline) to 57.4%, 58.2%,
and 57.8% respectively, all models using emotion
features still demonstrate strong overall performance.
Among them, DistilRoBERTa achieves the best trade-
off between detecting volatile movements and main-
taining stability.
Table 3: Stock Price Prediction Results with Emotion Anal-
ysis.
Stock
Name
Emotion
Analysis
Method
S-I S-D Stable
Average
S-I
& S-D
TSLA
Baseline 17.5% 1.7% 82.5% 9.6%
DistilRoBERTa 16.2% 8.3% 62.5% 12.3%
NRC-Intensity 26.2% 8.3% 71.8% 17.3%
NRC-Label 23.8% 6.7% 74.3% 15.2%
AAPL
Baseline 10.7% 0.0% 97.0% 5.4%
DistilRoBERTa 16.7% 28.0% 60.2% 22.3%
NRC-Intensity 18.6% 0.0% 66.0% 9.3%
NRC-Label 36.4% 27.5% 59.2% 32.0%
AMZN
Baseline 50.8% 0.0% 66.1% 25.4%
DistilRoBERTa 32.5% 40.0% 49.4% 36.3%
NRC-Intensity 35.0% 24.4% 36.9% 29.7%
NRC-Label 30.0% 14.0% 39.8% 22.0%
Average
Baseline 26.3% 0.6% 81.9% 13.5%
DistilRoBERTa 21.8% 25.4% 57.4% 23.6%
NRC-Intensity 26.6% 10.9% 58.2% 18.8%
NRC-Label 30.1% 16.1% 57.8% 23.1%
Table 4: Stock Price Prediction Results with Llama-
Enhanced Emotion Analysis.
Stock
Name
Emotion
Analysis
Method
S-I S-D Stable
Average
S-I
& S-D
TSLA
Baseline 17.5% 1.7% 82.5% 9.6%
DistilRoBERTa 41.2% 35.0% 65.6% 38.1%
NRC-Intensity 36.2% 3.3% 65.9% 19.8%
NRC-Label 35.0% 26.7% 59.5% 30.8%
AAPL
Baseline 10.7% 0.0% 97.0% 5.4%
DistilRoBERTa 27.7% 40.0% 66.2% 33.8%
NRC-Intensity 7.7% 35.0% 67.5% 21.3%
NRC-Label 15.0% 4.0% 67.1% 9.5%
AMZN
Baseline 50.8% 0.0% 66.1% 25.4%
DistilRoBERTa 50.0% 37.0% 41.0% 43.5%
NRC-Intensity 36.7% 38.6% 41.4% 37.6%
NRC-Label 36.7% 20.0% 40.2% 28.3%
Average
Baseline 26.3% 0.6% 81.9% 13.5%
DistilRoBERTa 39.6% 37.3% 57.6% 38.5%
NRC-Intensity 26.9% 25.6% 58.3% 26.2%
NRC-Label 28.9% 16.9% 55.6% 22.9%
Figure 4: Overall Average Accuracy for Predicting Signifi-
cant Increase and Decrease Movements Across 3 Stocks.
Predicting Stock Price Movement with LLM-Enhanced Tweet Emotion Analysis
237

Table 4 presents the results of the stock predic-
tion method using Llama-enhanced emotion analysis
methods, including DistilRoBERTa, NRC-Intensity,
and NRC-Label. DistilRoBERTa achieves the best
performance, with the overall Average S-I and S-D
accuracy rising from 23.6% (with Emotion Analysis)
to 38.5% (with Llama-enhanced Emotion Analysis),
while maintaining a stable accuracy of 57.6%. NRC-
Intensity improves from 18.8% to 26.2%, with sta-
ble accuracy of 58.3%. NRC-Label slightly declines
from 23.1% to 22.9%, with stable accuracy of 55.6%.
Overall, DistilRoBERTa demonstrates the most bal-
anced and robust performance. Figure 4 illustrates
the overall average accuracy for predicting signifi-
cant increase and decrease movements across TSLA,
AAPL, and AMZN stocks. Among all tested mod-
els, the DistilRoBERTa-based model consistently out-
performs others. Without Llama-enhanced emotion
analysis, it achieves the highest accuracy at 23.6%,
surpassing the baseline model and both NRC-based
approaches. With LLaMA-enhanced emotion anal-
ysis, the DistilRoBERTa-based model enables the
LSTM model to achieve 38.5% accuracy, signifi-
cantly outperforming the baseline across all three
stocks. This improvement is statistically significant,
with p − value < 0.05.
5 CONCLUSIONS
This paper proposes a novel framework for significant
stock price movement prediction by integrating emo-
tion features extracted from social media with histor-
ical price data. We applied the Meta’s Llama 3.1-
8B-Instruct model to preprocess tweets before cal-
culating emotion features using three emotion anal-
ysis methods: a DistilRoBERTa-based Emotion Clas-
sification model, NRC Emotion Intensity Lexicon,
and NRC Emotion Label Lexicon. These features
were combined with stock prices and used to train
an LSTM model that takes the previous day’s data as
input to predict the following day’s significant stock
price movement. Experimental results show that in-
corporating emotion features improves predictive per-
formance compared to using only historical stock
prices; the DistilRoBERTa-based Emotion Classifi-
cation Model configuration increased average sig-
nificant increase and decrease accuracy from 13.5%
(baseline) to 23.6% with emotion analysis, and fur-
ther to 38.5% with Llama-enhanced emotion analysis.
These findings highlight the effectiveness of emotion
analysis applied to social media data in financial fore-
casting and the added value of leveraging large lan-
guage models to enhance emotion analysis.
While our study demonstrates the utility of
emotion-based features for predicting significant
stock price movements, recent findings (Chartr and
Journal, 2024) indicate that consumer sentiment does
not always align directly with market trends. To better
capture short-term market direction, future research
could combine emotion analysis with technical indi-
cators and financial news signals to improve the accu-
racy of short-term stock price movement predictions.
CODE AVAILABILITY
The source code for this paper is available at: https:
//github.com/anv0101/stock-prediction
ACKNOWLEDGEMENTS
We utilized OpenAI’s ChatGPT (OpenAI, 2024), a
large language model, to revise the author’s written
text with the aim of improving its clarity, grammar,
and style.
REFERENCES
AI, M. (2024). Llama 3.1 8b instruct. https:
//huggingface.co/meta-llama/Llama-3.1-
8B-Instruct. Accessed: 2025-04-28.
Atsalakis, G. S. and Valavanis, K. P. (2009). Surveying
stock market forecasting techniques – part ii: Soft
computing methods. Expert Systems with Applica-
tions, 36(3):5932–5941.
Balaji, S. N., Paul, P. V., and Saravanan, R. (2017). Survey
on sentiment analysis based stock prediction using big
data analytics. In 2017 Innovations in Power and Ad-
vanced Computing Technologies (i-PACT), pages 1–5.
IEEE.
Bollen, J., Mao, H., and Zeng, X. (2011). Twitter mood
predicts the stock market. Journal of Computational
Science, 2(1):1–8.
Chartr and Journal, T. W. S. (2024). Sometimes,
the stock market hates good vibes. https:
//www.wsj.com/finance/investing/consumer-
sentiment-stock-market-research-68b80102.
Accessed: May 1, 2025.
Chun, J., Lee, S., Chang, Y., and Lee, S. (2022). Us-
ing deep learning to develop a stock price prediction
model based on individual investor emotions. Journal
of Behavioral Finance, 23(4):479–488.
equinxx (2022). Stock tweets for sentiment analysis and
prediction. Accessed: April 2025.
Griffith, J., Najand, M., and Shen, J. (2020). Emotions
in the stock market. Journal of Behavioral Finance,
21(1):42–56.
KDIR 2025 - 17th International Conference on Knowledge Discovery and Information Retrieval
238

Hartmann, J. C. (2022). emotion-english-distilroberta-
base. https://huggingface.co/j-hartmann/
emotion-english-distilroberta-base. Ac-
cessed: April 2025.
Huang, C.-L. and Tsai, C.-Y. (2009). A hybrid sofm-svr
with a filter-based feature selection for stock mar-
ket forecasting. Expert Systems with Applications,
36(2):1529–1539.
Huang, W., Nakamori, Y., and Wang, S.-Y. (2005). Fore-
casting stock market movement direction with support
vector machine. Computers & Operations Research,
32(10):2513–2522.
Jiang, W. (2021). Applications of deep learning in stock
market prediction: Recent progress. In Expert Systems
with Applications, 184, 115537. Elsevier.
Kimoto, T., Asakawa, K., Yoda, M., and Takeoka, M.
(1990). Stock market prediction system with modu-
lar neural networks. In Proceedings of the Interna-
tional Joint Conference on Neural Networks (IJCNN).
IEEE. Developed by Fujitsu and Nikko Securities for
forecasting TOPIX.
Kusal, S., Patil, S., Choudrie, J., Kotecha, K., Vora, D., and
Pappas, I. (2022). A review on text-based emotion de-
tection – techniques, applications, datasets, and future
directions. Artificial Intelligence Review. Available
via Springer or institutional access.
Mackey, A. L., Gauch, S., and Labille, K. (2021). Detect-
ing fake news through emotion analysis. In Proceed-
ings of the Thirteenth International Conference on
Information, Process, and Knowledge Management
(eKNOW 2021).
Mohammad, S. M. and Turney, P. D. (2013). Crowdsourc-
ing a word–emotion association lexicon. Computa-
tional Intelligence, 29(3):436–465.
Nelson, D. M. Q., Pereira, A. C. M., and de Oliveira,
R. A. (2017). Stock market’s price movement predic-
tion with lstm neural networks. In 2017 International
Joint Conference on Neural Networks (IJCNN), pages
1419–1426. IEEE.
Nguyen, T. H., Shirai, K., and Velcin, J. (2015). Sentiment
analysis on social media for stock movement predic-
tion. Expert Systems with Applications, 42(24):9603–
9611.
OpenAI (2024). Gpt-4o: Openai’s newest multimodal
model. https://openai.com/index/gpt-4o. Ac-
cessed: 2025-05-15.
Securities, U. and Commission, E. (2024). Sec reminds
market participants of may 28 transition to t+1 set-
tlement cycle. Accessed May 1, 2025.
Teti, E., Dallocchio, M., and Aniasi, A. (2019). The rela-
tionship between twitter and stock prices: Evidence
from the us technology industry. Technological Fore-
casting and Social Change, 149:119747.
Wankhade, M., Rao, A. C. S., and Kulkarni, C. (2022).
A survey on sentiment analysis methods, applica-
tions, and challenges. Artificial Intelligence Review,
55(7):5731–5780.
Yahoo Finance, Yahoo Finance Historical Market Data,
https://finance.yahoo.com, Accessed: 2024-05-11.
Predicting Stock Price Movement with LLM-Enhanced Tweet Emotion Analysis
239
