
Can We Really Predict Which Football Players Will Succeed?
Jonathan Feldman
Glen Ridge High School, Glen Ridge, New Jersey, U.S.A.
Keywords:
Football Analytics, Career Prediction, Player Development, Talent Identification, Underachievement,
Predictive Modeling, Sports Data Science.
Abstract:
Predicting whether a football player will achieve their projected career potential is a key challenge for clubs
and scouts. This study analyzes the career outcomes of 8,770 players from the European Soccer Database
(2008–2016), using FIFA video game potential ratings as a proxy for projected potential. To account for the
increasing difficulty of skill improvements at higher levels, we apply logarithmic scaling when calculating
achievement ratios. Predictive models were trained on two cohorts: players with complete career data and
those with early-career data (up to age 21). Early-career models achieved moderate predictive performance
(ROC AUC = 0.79), reflecting the challenge of identifying long-term success based on limited early observa-
tions. SHAP analysis shows that growth trajectory features, including early improvement and development
patterns, contribute more to success predictions than static physical or technical attributes. We define success
as fulfilling projected potential according to the FIFA rating system – a standardized but subjective bench-
mark. While this does not capture all real-world outcomes, it enables large-scale analysis of developmental
trajectories. These results suggest that tracking player development over time provides better guidance for
talent decisions than relying solely on early physical assessments.
1 INTRODUCTION
Predicting a football player’s long-term career suc-
cess is a key challenge for scouts, coaches, and an-
alysts. Early assessments of potential influence re-
cruitment decisions, training investments, and trans-
fer valuations. Despite growing access to player data,
many highly rated young players do not reach their
projected potential. In our dataset, only 48.6% of
players with full career trajectories achieved at least
95% of their projected potential, highlighting the dif-
ficulty of early talent forecasting.
Explaining why some players fulfill expectations
while others underachieve remains an open problem
in sports analytics. Most existing research focuses on
short-term performance metrics or static evaluations,
often ignoring the combination of demographic, phys-
ical, technical, and psychological factors that shape
career outcomes.
This study analyzes these factors using the Euro-
pean Soccer Database (Mathien, 2016), which con-
tains detailed player and match data from major Eu-
ropean leagues between 2008 and 2016. Player poten-
tial scores in this dataset are drawn from FIFA video
game ratings, providing a consistent, though subjec-
tive, proxy for projected potential and enabling longi-
tudinal analysis of player development.
We examine which player attributes are most as-
sociated with fulfilling or failing to meet projected
potential. Using correlation analysis and predictive
modeling, we assess how factors such as age, posi-
tion, technical skills, and mental attributes relate to
long-term career outcomes. This analysis contributes
to a better understanding of player development pat-
terns and supports efforts to improve data-driven ap-
proaches in scouting and talent management.
Throughout this study, we use the term football,
also known as soccer in some regions, to refer to the
sport governed by FIFA.
2 RELATED WORK
Talent identification and player development have
long been key challenges in sports science and ana-
lytics. Traditional scouting practices typically empha-
size early physical maturity and observable technical
skills, but these approaches often fail to predict long-
term success accurately. (Meylan et al., 2010) and
(Sarmento et al., 2018) highlight the importance of
38
Feldman, J.
Can We Really Predict Which Football Players Will Succeed?.
DOI: 10.5220/0013671000003988
Paper published under CC license (CC BY-NC-ND 4.0)
In Proceedings of the 13th International Conference on Sport Sciences Research and Technology Support (icSPORTS 2025), pages 38-49
ISBN: 978-989-758-771-9; ISSN: 2184-3201
Proceedings Copyright © 2025 by SCITEPRESS – Science and Technology Publications, Lda.

considering physiological, psychological, and tactical
characteristics in player evaluations, while (G
¨
ullich,
2014) show that early specialization may lead to un-
realistic expectations and suboptimal developmental
outcomes.
Broader reviews by (Vaeyens et al., 2008) and
(Reeves et al., 2018) stress that effective talent iden-
tification should incorporate sociological factors and
developmental variability rather than relying solely
on early performance metrics. (Dugdale et al.,
2020) provide longitudinal evidence that success at
the academy level does not guarantee professional
achievement, underscoring the need for models that
account for developmental trajectories.
With the increasing availability of player data, ma-
chine learning methods have become popular in foot-
ball analytics. Schumaker et al. (Schumaker et al.,
2010) explored early applications of predictive mod-
eling for sports outcomes, while more recent studies
by (Decroos et al., 2019) and (Power et al., 2017)
introduced sophisticated frameworks for valuing in-
dividual player actions and decision-making using
match event and tracking data. (Pappalardo et al.,
2019) also contributed a standardized dataset to sup-
port reproducible spatio-temporal analysis in football.
In parallel, research has increasingly emphasized
model interpretability in sports prediction. (Ribeiro
et al., 2016) and (Lundberg and Lee, 2017) estab-
lished foundational approaches to model explainabil-
ity, which have since been applied in football set-
tings to increase transparency in player evaluation.
(Molnar, 2022) offers a comprehensive guide to inter-
pretable machine learning, while (Tavana et al., 2013)
proposed a fuzzy logic framework for holistic player
evaluation.
(Gudmundsson and Horton, 2017) provided a
broad survey of spatio-temporal analysis techniques
in team sports, highlighting the importance of contex-
tual player behavior. Meanwhile, (van Arem et al.,
2025) applied explainable machine learning models
to forecast both player development and market value,
demonstrating how predictive techniques can support
strategic decision-making. Similarly, (Baouan et al.,
2022) investigated which performance indicators are
most predictive of future player value, reinforcing the
relevance of longitudinal data in assessing career po-
tential.
The role of AI in scouting and player develop-
ment is also gaining traction in media and industry
reports (Vicente, 2024; Guardian, 2025), suggesting
a broader shift toward data-driven decision-making in
football organizations.
Despite these advances, few studies have di-
rectly investigated whether players fulfill externally
assigned career potential ratings, such as those pro-
vided by the FIFA video game series. These rat-
ings, although subjective, are widely used in foot-
ball analytics due to their consistency across seasons
and player cohorts (Mathien, 2016). Building on this
line of research, our study analyzes over- and under-
achievement patterns using these potential scores and
examines which early-career features most effectively
predict long-term outcomes.
2.1 Datasets
2.1.1 Data Source
We use the publicly available FIFA Player Dataset
compiled by Hugo Mathien (Mathien, 2016), which
contains player data from EA Sports’ FIFA video
game series for the years 2008 to 2016. The dataset
includes player demographics, physical attributes,
and skill evaluations across multiple seasons. The
overall rating and potential scores are based on sub-
jective assessments from the game’s expert panels,
representing perceived current ability and projected
career potential.
The dataset covers approximately 11,000 players
and over 300,000 player-season records, providing a
large sample for analyzing player development pat-
terns. These ratings reflect subjective perceptions and
should be treated as estimates of expected career suc-
cess rather than objective performance measures.
We primarily use two tables from this dataset:
• Player: Contains static information such as birth
date, height, and weight.
• Player Attributes: Contains time-stamped
records of player ratings and skill attributes,
including overall rating, projected potential, and
technical and physical skill scores.
While the FIFA video game series is primarily
a commercial entertainment product, its player rat-
ings are informed by extensive scouting networks,
expert panels, and real-world performance observa-
tions. These ratings have become a de facto standard-
ized resource in football analytics due to their broad
coverage, longitudinal consistency, and accessibility
(Baouan et al., 2022; Mathien, 2016). Although sub-
jective, they provide a uniform proxy for projected
player potential across multiple seasons and cohorts
– attributes that are rarely available in open-access
datasets. As such, they are widely used in both aca-
demic studies and industry analyses to explore pat-
terns of player development and market valuation.
Can We Really Predict Which Football Players Will Succeed?
39

2.1.2 Preprocessing
To ensure sufficient coverage for modeling career
trajectories, we retained players with at least eight
recorded ratings. Player age was calculated dynam-
ically at each observation, and data was limited to
ages 16 to 40 to focus on active professional careers.
The final dataset included 8,770 players. Of these,
2,212 had complete longitudinal records suitable for
modeling final career outcomes, and 4,683 had at
least three recorded ratings before age 21, supporting
early-career prediction experiments. These groups are
not mutually exclusive; some players appear in both
cohorts.
Final predictive analyses were conducted using
players with complete data for all engineered features
and target variables to ensure consistency and relia-
bility. For binary classification, players were labeled
as achievers if their final achievement exceeded 95%
of their projected potential; those below this threshold
were classified as underachievers. This cutoff strikes
a balance between a strict definition of success and
maintaining a sufficient number of positive cases for
modeling.
While this achievement ratio offers a quantifiable
proxy for career fulfillment, it remains a subjective
and indirect measure. Specifically, it does not neces-
sarily reflect real-world career accomplishments such
as international caps, top-league appearances, or ma-
jor tournament victories. Therefore, although useful
for statistical modeling, this metric should not be in-
terpreted as a definitive indicator of career prestige or
professional impact.
2.2 Feature Extraction
We derived over 40 features capturing player devel-
opment and skill progression.
Adjusted Achievement Ratio Over Time. To cap-
ture player development over time, we computed an
adjusted achievement ratio at each observation rather
than relying only on final ratings. This metric tracks
how players progress toward their projected potential
throughout their careers.
The adjusted achievement ratio at time t is defined
as:
Adj. Achv. Ratio
t
=
log(1 +Rating
t
− B)
log(1 +Potential
t
− B)
where:
• Rating
t
is the player’s overall rating at time t,
• Potential
t
is the player’s projected potential at
time t,
• B is a baseline value set to 30, representing the
minimum professional-level rating.
We excluded cases where Potential
t
≤ B to avoid
invalid values in the logarithm. The logarithmic scal-
ing accounts for diminishing returns, where improv-
ing from a rating of 40 to 50 is easier than improving
from 80 to 90.
For each player, we summarized this ratio using
the following aggregate features:
• Mean adjusted achievement ratio across all time
points.
• Maximum adjusted achievement ratio reached
during the career.
• Final adjusted achievement ratio at the last
recorded rating.
• Achievement growth trend, calculated as the slope
of a linear regression over the adjusted ratios.
Additional Feature Groups
• Growth Metrics: Early growth (up to age 21), late
growth (post-21), total growth, growth rate, max-
imum one-year improvement, and growth volatil-
ity.
• Achievement Ratios: Both linear and logarith-
mic versions measuring how closely a player ap-
proached their projected potential.
• Skill Aggregates: Mean, maximum, and final
recorded values for stamina, sprint speed, drib-
bling, finishing, and strength.
• Physical and Categorical Attributes: Height,
weight, preferred foot, and work rate preferences.
Categorical attributes were encoded using label
encoding, and numerical features were standardized
using Z-score normalization to ensure comparability
across features.
Table 1 lists the final set of features used in model
training. These were selected from the latest avail-
able player attributes after removing highly correlated
or leaky variables. Categorical features were label-
encoded and all numeric values were standardized us-
ing Z-score normalization.
2.2.1 Feature Correlation Analysis
The correlation heatmap in Figure 1 shows several
patterns in the relationships between features:
• Strong Positive Correlations: The early achieve-
ment ratio and final achievement ratio show
strong positive correlations with career progres-
sion metrics such as growth rate, final rating, and
strength final. This supports their relevance for
modeling career outcomes.
icSPORTS 2025 - 13th International Conference on Sport Sciences Research and Technology Support
40

Table 1: Final Features Used in Modeling.
Feature Type / Description
Age Numeric (latest observation)
Preferred Foot Categorical (left/right)
Att. Work Rate Categorical (high/med/low)
Def. Work Rate Categorical (high/med/low)
Vision Numeric (passing awareness)
Aggression Numeric (duel intensity)
Positioning Numeric (attack positioning)
Acceleration Numeric (speed buildup)
Sprint Speed Numeric (top speed)
Stamina Numeric (fatigue resistance)
Strength Numeric (physicality)
Dribbling Numeric (ball control)
Finishing Numeric (shot accuracy)
Short Passing Numeric (pass accuracy)
• Athleticism Attributes Show Weak Correlations
with Long-Term Success: Attributes related to
speed and acceleration (e.g., sprint speed, accel-
eration) have weak or even negative correlations
with achievement ratios and career milestones.
This suggests that early athleticism alone may not
strongly predict long-term success, possibly be-
cause these physical traits peak early and do not
directly reflect technical or tactical development.
• Technical and Tactical Skills Show Stronger
Associations: Features such as vision mean,
short passing mean, and positioning mean show
moderate to strong positive correlations with
achievement metrics. These skills appear to con-
tribute more consistently to long-term player de-
velopment.
• High Overlap Between Aggregated Features:
Many features were recorded as mean, max, and
final values for the same skill (e.g., stamina,
strength, dribbling), leading to strong correlations
often exceeding 0.95. To reduce redundancy and
avoid instability in modeling, we excluded these
overlapping variants and retained a simplified fea-
ture set. Only non-redundant, numeric features
were used in our classification experiments after
dropping potential sources of leakage.
• Growth Patterns and Final Achievement:
Max 1yr growth and growth volatility show
moderate positive correlations with final ratings
and achievement ratios. This suggests that
players with late physical development or more
variable growth trajectories can still achieve
high career outcomes, potentially reflecting late
specialization or delayed maturity.
• Negative Correlations with Total Growth:
Total growth shows negative correlations with
several performance-related features. This may
indicate that players requiring large improve-
ments to reach their final ratings started from
lower initial ratings, complicating interpretations
of their development trajectories.
2.2.2 Descriptive Analysis of Key Features
Table 2 summarizes key features related to player de-
velopment and career outcomes. On average, players
gain 13.9 rating points over their careers, with most
of that improvement occurring before age 21. Final
ratings show substantial variability, reflecting diverse
career trajectories.
These patterns suggest that early development
may play a central role in determining long-term out-
comes and motivate further modeling of how phys-
ical, technical, and cognitive attributes influence ca-
reer progression.
Table 2: Descriptive Statistics of Key Features.
Feature Mean Std Dev Min Max
Early Growth 8.24 5.10 -3.0 20.0
Late Growth 5.67 4.85 -2.0 18.0
Growth Rate 1.20 0.65 0.0 3.5
Stamina Mean 65.8 10.5 40.0 90.0
Strength Max 70.3 15.2 30.0 95.0
Final Rating 72.5 5.40 50.0 93.0
Figure 2 shows the distributions of selected player
attributes used in modeling:
• Physical Attributes: Acceleration (Figure 2a) is
right-skewed, with most players falling between
70 and 80. Extremely high acceleration is rare,
and its marginal benefit may diminish beyond
a certain level. Height (Figure 2b) is approxi-
mately normally distributed around 180–185 cm.
While not strongly correlated with career out-
comes, height influences positional roles: taller
players often appear in defensive or goalkeeping
positions, while shorter players are more common
in attacking and midfield roles.
• Growth Patterns: Figures 2c and 2d show that
early growth tends to be modest, with only a small
subset of players improving rapidly before age 21.
Late growth is more limited overall, suggesting
that early development has a stronger influence on
final ratings.
• Achievement Ratios: The final achievement ra-
tio (Figure 2e) is concentrated near 1.0 for many
players, but a substantial number fall short of their
projected potential, motivating further analysis of
underachievement.
Can We Really Predict Which Football Players Will Succeed?
41
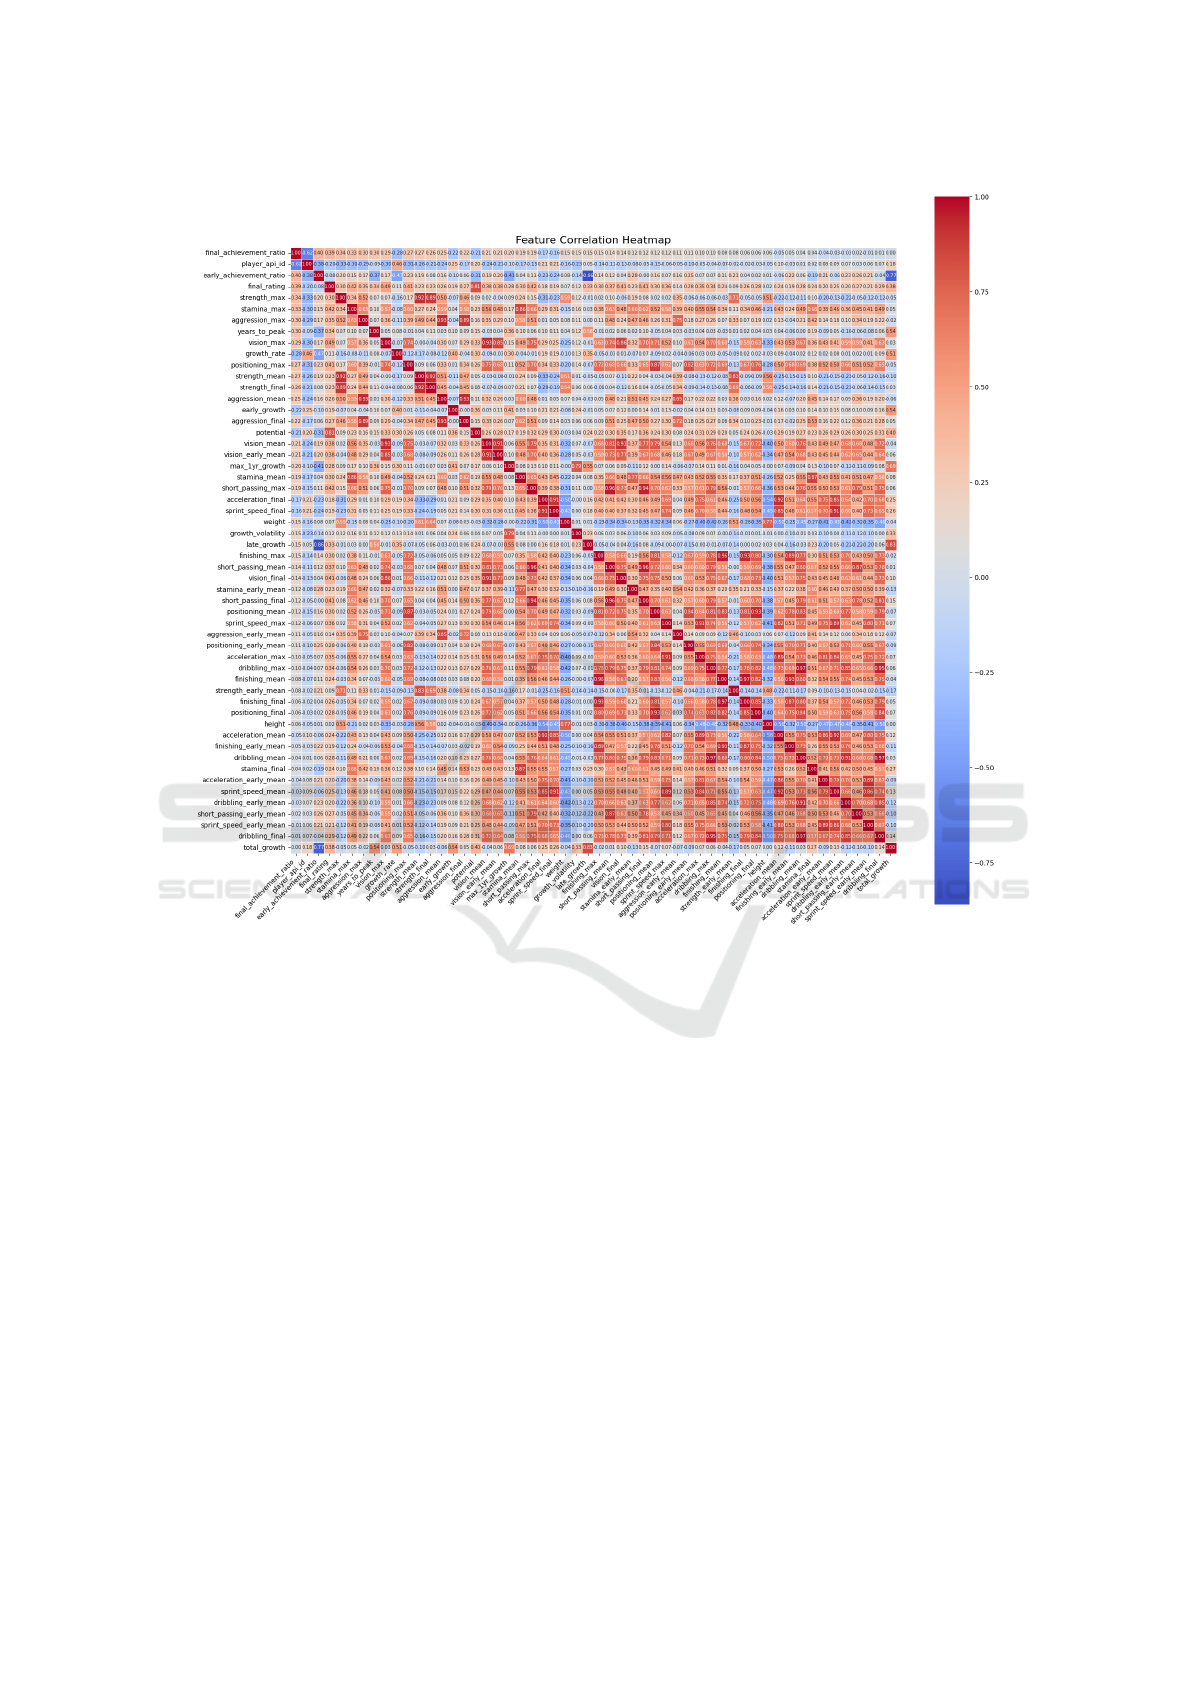
Figure 1: Correlation heatmap of extracted features. Strong positive correlations appear in red, and negative correlations in
blue.
• Age and Career Coverage: Figure 2f shows
that most player records occur between ages 24
and 26, consistent with typical peak performance
years. This supports the dataset’s suitability for
analyzing full career trajectories.
• Achievement Class Distribution: As shown in
Figure 2g, the dataset includes a modest class im-
balance, with underachievers slightly outnumber-
ing achievers. This was accounted for in modeling
through class balancing strategies.
This descriptive analysis supports the importance
of early career development and suggests that while
physical traits may influence role-specific perfor-
mance, technical and cognitive attributes likely con-
tribute more to long-term success. These observations
informed both the selection of input features and the
modeling strategies used in the next sections.
3 MODELING AND ANALYSIS
We used the subset of 2,212 players with complete ca-
reer trajectories to train and evaluate models predict-
ing final achievement outcomes. This included both
regression and classification tasks using the full set of
engineered features.
3.1 Regression Modeling
The regression models predicting final achievement
ratio were trained on the 2,212 players with complete
longitudinal records, ensuring that all growth-related
features and final outcomes were fully observed.
We trained an XGBoost regression model to pre-
dict the final achievement ratio using the engineered
features. After controlling for potential information
leakage by removing features directly related to fi-
icSPORTS 2025 - 13th International Conference on Sport Sciences Research and Technology Support
42
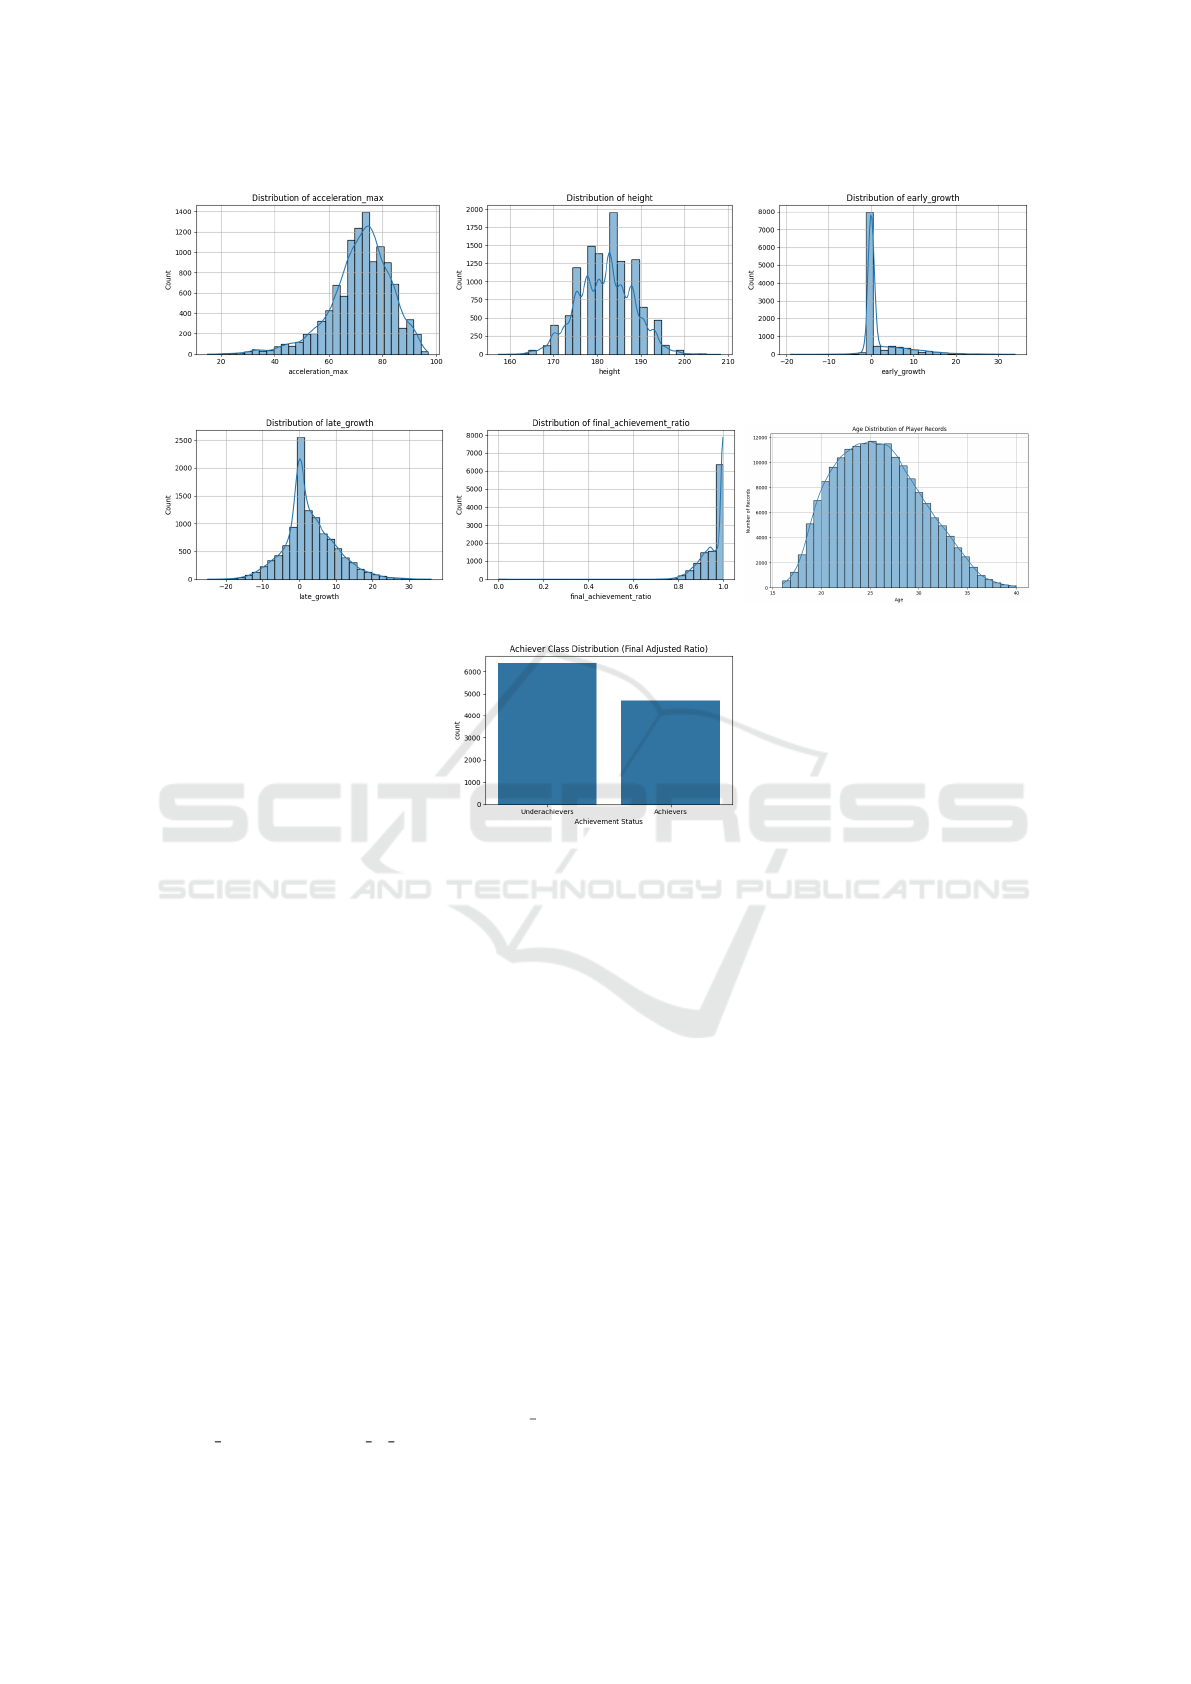
(a) Acceleration Distribution (b) Height Distribution (c) Early Growth Distribution
(d) Late Growth Distribution (e) Final Achievement Ratio (f) Age Distribution
(g) Achievement Class Distribution
Figure 2: Distributions of selected features relevant to player development, physical attributes, and achievement outcomes.
nal outcomes (such as final rating, potential, and
early achievement ratio), the model achieved an R
2
of 0.48. This reflects the inherent difficulty of fore-
casting long-term success based on early-career data.
3.2 Feature Importance and
Interpretation
We applied two approaches to interpret the model’s
predictions:
• XGBoost’s gain-based feature importance, which
estimates each feature’s contribution to reducing
prediction error.
• SHAP (SHapley Additive exPlanations) (Lund-
berg and Lee, 2017), which quantifies the
marginal impact of each feature on model output
across samples.
SHAP Analysis. Figure 3 presents the SHAP re-
sults for the leakage-controlled model.
• Growth-related features such as growth rate,
total growth, and years to peak contributed most
to prediction accuracy. These indicators of devel-
opmental trajectory were more informative than
static skill ratings.
• Physical and technical skills had a moderate in-
fluence. Attributes such as stamina and strength
ranked lower but still contributed meaningfully.
Technical features like vision and positioning had
limited predictive value when trajectory-based
features were included.
Although some technical and physical skills cor-
relate with career outcomes when considered individ-
ually, their predictive value diminishes once growth-
related features are included. This suggests that
player development trajectories capture much of the
variance associated with career outcomes.
The final R
2
result highlights the challenge of
forecasting long-term success from limited early-
career data. Future work should validate these find-
ings on external datasets to assess their generalizabil-
ity.
Can We Really Predict Which Football Players Will Succeed?
43
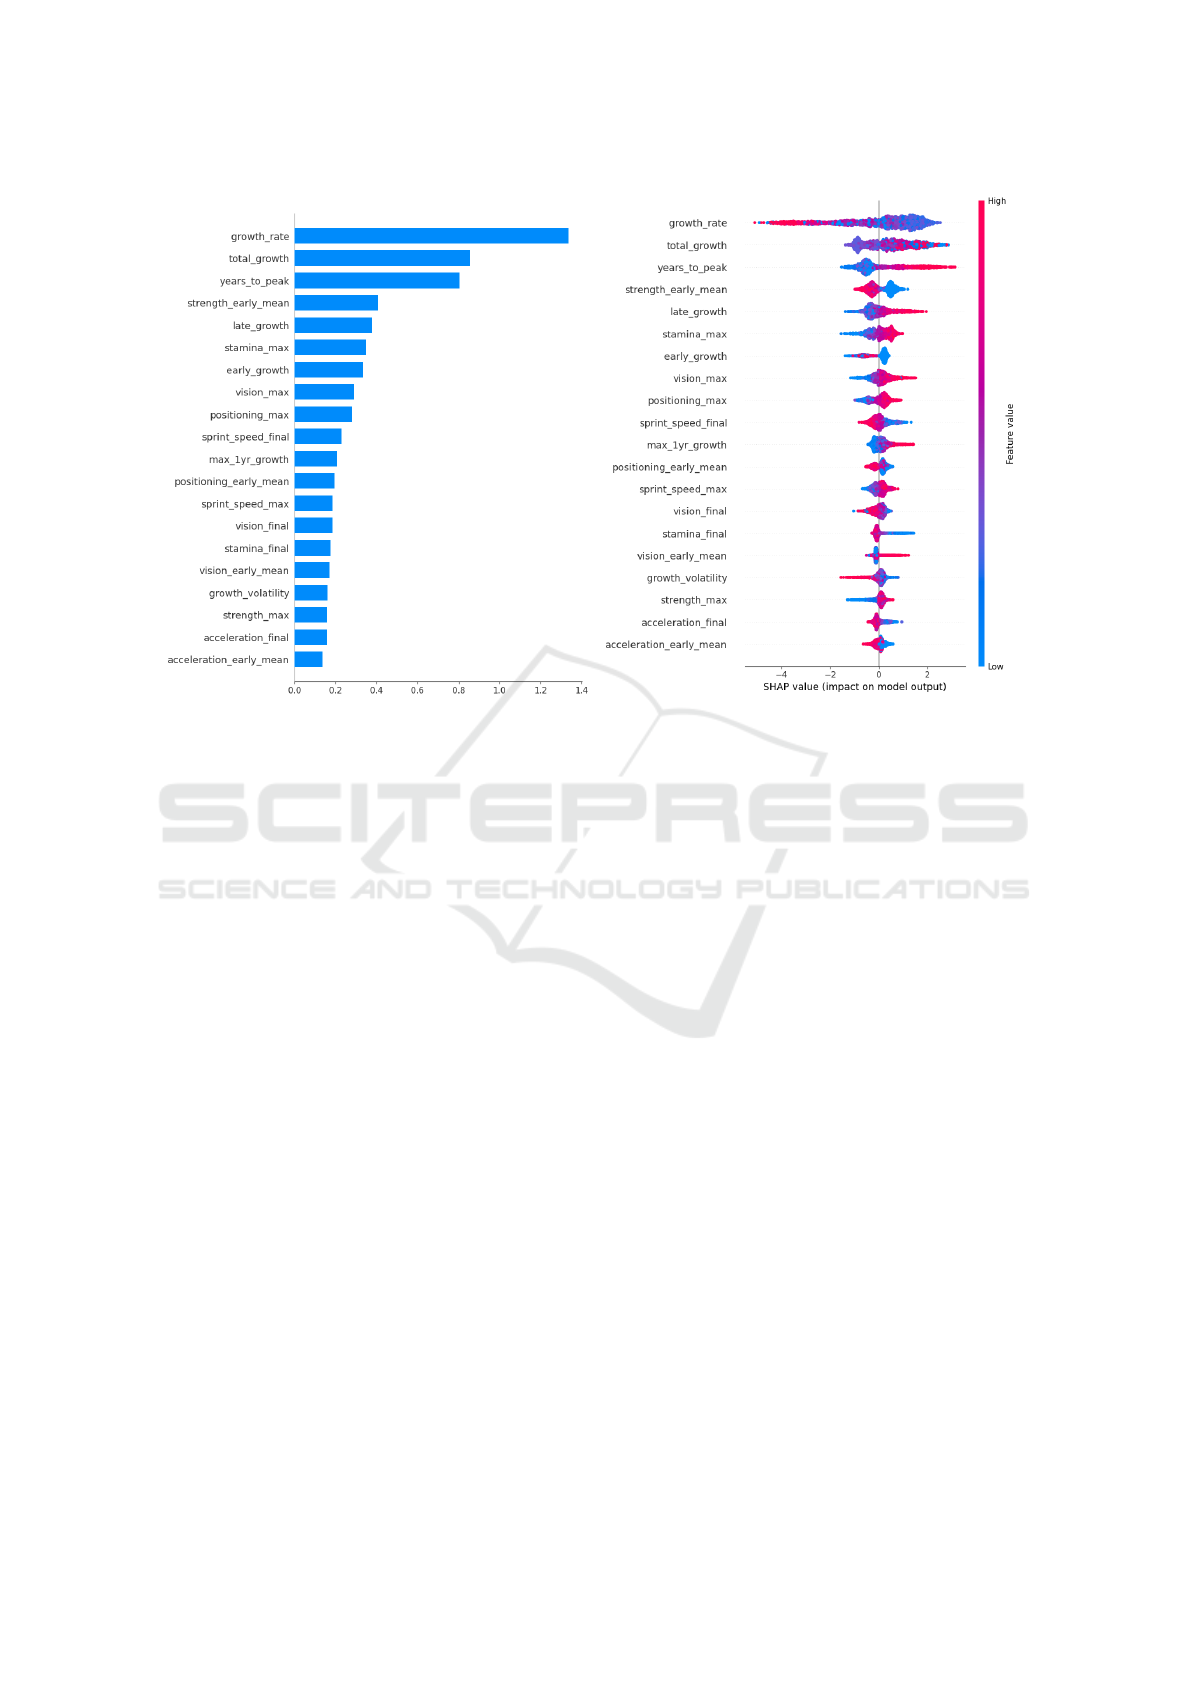
Figure 3: SHAP analysis results: (Left) Mean absolute SHAP values; (Right) SHAP summary plot showing feature impact
and direction.
Interpretation of Regression vs Classification Per-
formance. Although both regression and classifica-
tion models were trained on overlapping feature sets,
their performance metrics are not directly comparable
due to the difference in task framing and evaluation
criteria. The regression model aims to predict a con-
tinuous achievement ratio, which is a more granular
and challenging target, and achieved an R
2
of 0.48. In
contrast, the classification model simplifies the prob-
lem to a binary outcome (achiever vs. underachiever),
which is easier to separate, especially when using en-
gineered features like growth trends. Furthermore, the
classification model benefits from thresholding near
the extremes (e.g., 0.95 cutoff), which can lead to
higher ROC AUC scores even if underlying predic-
tions are not highly precise. To quantify variability,
we conducted 5-fold cross-validation and observed
a mean ROC AUC of 0.79 (± 0.02), indicating con-
sistent discriminative performance across folds. This
partial decoupling between the continuous and binary
framing explains why the classifier shows higher dis-
criminative power (ROC AUC ≈ 0.79) despite relying
on similar inputs. This also reinforces the importance
of choosing modeling objectives that align with prac-
tical decision-making goals in scouting and develop-
ment contexts.
3.3 Predictive Modeling and Evaluation
In addition to regression modeling, we trained a
Random Forest (Breiman, 2001) classifier to predict
whether a player would exceed 95% of their projected
potential.
Model performance was evaluated using 5-fold
cross-validation to ensure robustness and mitigate the
effects of random splits. All results reported reflect
average performance across the validation folds.
Early-Career Prediction Results. Using only data
available before age 21 and excluding features
that directly encode career outcomes, the model
achieved moderate predictive performance: Accuracy
of 73.95% ± 1.42%, F1 Score of 0.6250 ± 2.14%,
and ROC AUC of 0.7925 ± 1.62%.
These results highlight the difficulty of predict-
ing long-term career success based solely on early-
career data. While the model can differentiate be-
tween likely achievers and underachievers better than
chance, predictive accuracy remains limited, reflect-
ing the complexity of player development.
Class-Wise Performance. The model demon-
strates higher precision than recall, indicating greater
confidence in identifying players who meet their
projected potential but frequent difficulty detecting
icSPORTS 2025 - 13th International Conference on Sport Sciences Research and Technology Support
44

underachievers. This suggests that the model tends to
overestimate success based on early-career data.
• Precision: 73.08% ± 4.97%
• Recall: 54.73% ± 1.65%
This imbalance highlights the model’s tendency to
favor positive predictions (achievers), while missing
many players who eventually underachieve. Identify-
ing late bloomers and players who fail to reach their
projected potential remains a key challenge.
Error Analysis. False positives typically involve
players who show early promise but fail to improve,
while false negatives are often late bloomers who de-
velop after a slow start.
SHAP analysis confirms that growth trajec-
tory features like growth rate, total growth, and
years to peak are more predictive of success than
static early-career attributes. However, identifying
late bloomers remains difficult.
Despite moderate ranking ability, the model strug-
gles to predict underachievement accurately, under-
scoring the need for longitudinal development track-
ing and caution in early talent assessments.
3.4 Error Analysis: The Limits of Early
Predictions and the Myth of Early
Promise
Despite achieving moderate quantitative perfor-
mance, our predictive model exhibits systematic er-
rors that reveal important limitations in using early-
career metrics to forecast long-term success. Specif-
ically, the model tends to overestimate players who
demonstrate strong early physical attributes and
high initial ratings, while failing to recognize late
bloomers who develop their potential after a slower
start.
False Positives: The Pitfall of Early Promise. Ta-
ble 3 summarizes players who were predicted to
achieve their projected potential but ultimately under-
achieved.
Table 3: False Positives: Predicted Success but Under-
achieved.
Player Name Final Achv. Early Rating Stamina Growth Rate
Anssi Jaakkola 0.93 49.00 43.5 1.50
Lucas 0.94 64.60 58.6 -1.17
David Barron 0.89 53.25 54.0 3.25
Ismael Aissati 0.95 72.00 76.2 0.20
Michele Rinaldi 0.88 66.00 72.0 1.00
The columns in Table 3 and Table 4 provide the fol-
lowing information:
• Final Achv.: The player’s final achievement ra-
tio, calculated as actual career performance rela-
tive to projected potential. Values below 1.00 in-
dicate underachievement.
• Early Rating: The average player rating before
age 21, calculated as a simple mean of all avail-
able ratings during this period. This value reflects
the player’s observable abilities before reaching
maturity and is used directly as a predictive fea-
ture without transformation.
• Stamina: Average stamina rating during early ca-
reer (before 21), indicating physical endurance.
• Growth Rate: The average year-over-year
change in player rating before age 21. This is cal-
culated as:
Growth Rate =
1
N
N
∑
i=1
Rating
i+1
− Rating
i
(1)
where N is the number of consecutive rating ob-
servations before age 21. Negative or near-zero
values indicate stagnation or decline in early-
career performance.
Despite strong early ratings and stamina, these play-
ers underachieved due to limited or negative growth,
demonstrating the model’s tendency to overestimate
future success based on early promise without ac-
counting for sustained development.
False Negatives: Overlooking Late Bloomers.
We define late bloomers as players who show limited
or negative growth before age 21 but experience sig-
nificant improvement in their early to mid-twenties.
Table 4 shows players who were predicted to under-
achieve but ultimately fulfilled or exceeded their pro-
jected potential.
Table 4: False Negatives: Predicted Failure but Succeeded.
Player Name Final Achv. Early Rating Stamina Growth Rate
Konstantin Engel 1.00 48.33 48.67 0.00
Krisztian Nemeth 0.99 69.00 63.40 0.00
Kanu 1.00 64.50 60.00 0.00
Jakub Rzezniczak 1.00 61.67 77.00 0.00
Maciej Korzym 1.00 58.75 62.00 -0.40
While these players fulfilled their projected po-
tential according to the dataset metrics, only a sub-
set achieved international recognition. Notably,
Nwankwo Kanu became a globally celebrated player
Can We Really Predict Which Football Players Will Succeed?
45

with major titles at both club and national levels. Oth-
ers, such as Kriszti
´
an N
´
emeth and Jakub Rze
´
zniczak,
enjoyed successful domestic careers or moderate in-
ternational appearances but did not reach global star-
dom. This distinction makes clear that meeting pro-
jected potential does not always translate to elite-level
success and highlights the complexity of defining and
evaluating ”success” in football careers.
These cases illustrate the challenge of predicting suc-
cess for late bloomers. Despite modest early-career
profiles and limited growth, some players achieved re-
markable careers, emphasizing the importance of fac-
tors beyond early observable performance.
Fulfilling projected potential (Final Achv. ≈ 1.00)
reflects meeting expectations based on statistical pro-
jections, but does not necessarily equate to achieving
stardom or international fame. For example, while
Konstantin Engel fully met his projected potential,
his career remained largely within lower-tier German
leagues. In contrast, Nwankwo Kanu, also classified
as a false negative, became an internationally cele-
brated player despite modest early metrics.
These cases demonstrate that achieving statistical
success according to projected metrics does not al-
ways align with real-world career prestige. This rein-
forces the importance of incorporating broader qual-
itative factors, such as psychological resilience, ca-
reer opportunities, and non-linear development paths,
when evaluating talent.
Correct Predictions: When the Model Gets It
Right. Beyond its misclassifications, the model also
successfully identified players who either fulfilled or
failed to meet their projected potential. These exam-
ples demonstrate that early-career metrics can be in-
formative predictors when career trajectories follow
more expected development patterns.
Table 5: True Positives: Correctly Predicted Success.
Player Name Final Achv. Early Rating Growth Rate
Ruben Perez 0.99 65.20 2.40
Marco Perez 0.96 70.00 -3.00
Antoine Rey 1.00 41.00 0.00
Michal Svec 0.96 61.00 -0.25
Antonio Candreva 1.00 60.33 1.33
In Table 5, we highlight players who achieved their
projected potential and were correctly classified by
the model. Notably, Ruben Perez and Antonio Can-
dreva showed strong early ratings and positive or sta-
ble growth. Despite some irregularities, such as nega-
tive growth in Marco Perez, the model correctly iden-
tified these players as likely achievers.
Table 6 shows examples of correctly predicted un-
Table 6: True Negatives: Correctly Predicted Under-
achievement.
Player Name Final Achv. Early Rating Growth Rate
Mikhail Sivakov 0.85 56.00 0.00
Rafael Dias 0.94 58.75 0.00
Garry Wood 0.85 55.00 0.00
Jamie Mole 0.83 60.50 0.50
Amaury Bischoff 0.88 66.00 0.00
derachievers. These players exhibited moderate early
ratings and minimal or no growth, aligning with the
model’s underachievement prediction. This supports
the model’s effectiveness in identifying stagnating
players early in their careers.
Implications for Talent Identification. These find-
ings support prior work in sports science that cau-
tions against an overreliance on early specialization
and static performance metrics (Sarmento et al., 2018;
Vaeyens et al., 2008). While early career assessments
offer valuable insights, they often fail to capture the
complex developmental trajectories of athletes. In
particular, identifying late bloomers remains a signif-
icant challenge for data-driven models.
Future work should explore incorporating addi-
tional factors such as injury history, psychological as-
sessments, and changes in coaching environments to
improve predictive accuracy. Ultimately, while ma-
chine learning models can assist in talent evaluation,
they should complement rather than replace expert
judgment and longitudinal scouting efforts.
3.5 Comparing Predictive Value Across
Career Phases
To better understand how the timing of observed data
affects long-term prediction, we compared three ex-
perimental setups: (1) early-career only (ages ≤ 21),
(2) developmental-phase only (ages 22–26), and (3)
a combined pre-peak window (ages ≤ 26). Each
model used the same feature types and binary target
(achiever vs. underachiever based on final achieve-
ment ratio ≥ 0.95).
Performance Summary. As shown in Table 7, the
model trained solely on developmental-phase data
achieved the highest F1 score (0.86), outperforming
both early-career (0.63) and full pre-peak (0.77) mod-
els. However, the early-career model achieved the
highest ROC AUC, indicating slightly better class
separation despite lower overall accuracy. These
results suggest that mid-career development offers
stronger predictive signals for identifying achievers,
icSPORTS 2025 - 13th International Conference on Sport Sciences Research and Technology Support
46

but early patterns still carry useful discriminative in-
formation.
Interpretation. The full pre-peak model benefits
from access to both early promise and mid-career
trajectory, yielding a balanced compromise between
precision and recall. In contrast, the developmental-
phase-only model excels at identifying likely achiev-
ers, but with more false positives, possibly due to
survivor bias: players still active at 22–26 are more
likely to succeed. The early-career model, while less
accurate overall, may better capture cases of under-
achievement and developmental stagnation.
Table 7: Comparison of Prediction Performance Across Ca-
reer Phases.
Experiment Age Range F1 Score ROC AUC
Early-Career ≤ 21 0.6250 0.7925
Full Pre-Peak ≤ 26 0.7746 0.7905
Developmental Only 22–26 0.8596 0.7374
These results highlight the importance of longi-
tudinal observation: while early ratings offer some
signal, the clearest indicators of long-term success
emerge during the professionalization phase. Com-
bining early and mid-career signals yields strong re-
sults overall, but continued development remains the
most decisive factor.
4 DISCUSSION
This study examined whether football player career
outcomes can be predicted using performance trajec-
tories extracted from longitudinal in-game data. We
found that growth metrics observed between ages 22
and 26 were more predictive of long-term potential
fulfillment than early-career signals alone. While
combining early and mid-career data improved classi-
fication performance, developmental-phase indicators
consistently offered the strongest signal for identify-
ing likely achievers.
These findings support the idea that early static
assessments, such as initial ratings or physical at-
tributes, are insufficient for forecasting long-term out-
comes. In contrast, developmental patterns such as
growth rate, volatility, and late improvements provide
more robust predictive value. This highlights the im-
portance of tracking player progression rather than re-
lying on early promise. It also implies that scouting
systems emphasizing sustained progress during early
adulthood, rather than early peak performance, may
better identify overlooked potential.
It is important to clarify that in this study, “suc-
cess” is operationalized as achieving at least 95% of a
player’s projected potential rating, as assigned in the
FIFA dataset. While this offers a consistent, quan-
tifiable proxy for perceived promise, it does not nec-
essarily reflect professional prestige, international ac-
colades, or financial achievement. Rather, it captures
alignment with expectations as encoded in a widely
used evaluative framework.
Our analysis also revealed systematic model bi-
ases. Players with strong early physical metrics but
little follow-through were often overestimated, while
late bloomers with slow starts were frequently missed.
This reflects the inherent limitations of early-career
prediction, even with engineered growth features.
5 LIMITATIONS AND FUTURE
WORK
A key limitation of this study is its reliance on the
FIFA dataset (2008–2016), where projected potential
ratings are based on expert assessments from a com-
mercial video game. These ratings reflect perceived
promise, not confirmed professional success, and may
be influenced by media exposure, reputation, or other
non-performance factors. As a result, our models
predict alignment with subjective expectations in the
FIFA system, not real-world outcomes such as top-
tier appearances, transfer fees, or international recog-
nition.
This distinction matters for generalizability. A
player may meet their FIFA potential but still fall
short of elite professional standards, or may exceed
expectations that were never reflected in their early
ratings. While our results shed light on the pre-
dictability of perceived potential, they do not directly
apply to scouting systems based on different goals or
data.
Another limitation is that our models exclude
many contextual factors that can strongly affect a
player’s career. These include injury history, men-
tal resilience, coaching environment, and socio-
economic background. Without such data, the models
may miss key drivers of unusual or nonlinear develop-
ment paths. In addition, the findings have not yet been
tested on newer player cohorts, so their relevance over
time remains uncertain.
Despite these limitations, the FIFA dataset re-
mains useful for large-scale longitudinal analysis. It
provides structured, consistent player records across
development stages – something that many real-world
datasets, especially proprietary or region-specific
ones, still lack.
Can We Really Predict Which Football Players Will Succeed?
47

Future work should extend this analysis to alterna-
tive datasets that track objective performance metrics,
such as club logs, market valuations, or match-level
statistics. Incorporating richer contextual signals and
validating on more recent player cohorts will help as-
sess whether the same developmental predictors hold
across different settings and time periods.
6 CONCLUSION
Our findings suggest that models incorporating longi-
tudinal development features can moderately predict
whether players will fulfill their projected potential.
Growth trajectories, not early static assessments, are
the strongest predictors of future alignment with ex-
pectations.
While standardized ratings such as those used in
FIFA data provide a scalable basis for analysis, they
offer only a partial view of real-world success. Pre-
dictive modeling should be used to complement, not
replace, expert judgment, especially when evaluating
players who may follow nonlinear or delayed devel-
opment paths.
Ultimately, this work contributes to a growing
body of research suggesting that the key to under-
standing future potential lies not in early ratings, but
in how players improve, adapt, and grow across their
developmental years.
ACKNOWLEDGEMENTS
The author gratefully acknowledges the creators of
the publicly available datasets and open-source li-
braries used in this work.
Code and Data Availability
All code and analysis notebooks used in this study
are available at: https://github.com/jonfeld/
icsports2025.
REFERENCES
Baouan, A., Bismuth, E., Bohbot, A., Coustou, S., Lacome,
M., and Rosenbaum, M. (2022). What should clubs
monitor to predict future value of football players.
arXiv preprint arXiv:2212.11041.
Breiman, L. (2001). Random forests. Machine Learning,
45(1):5–32.
Decroos, T., Bransen, L., Van Haaren, J., and Davis, J.
(2019). Actions speak louder than goals: Valuing
player actions in soccer. In Proceedings of the 25th
ACM SIGKDD International Conference on Knowl-
edge Discovery & Data Mining, pages 1851–1861.
ACM.
Dugdale, J. H., Sanders, R. H., and Hunter, A. M.
(2020). Progression from youth to professional soc-
cer: A longitudinal study of successful and unsuc-
cessful academy graduates. Scandinavian Journal of
Medicine & Science in Sports, 30(7):1181–1191.
Guardian, T. (2025). Football coaches could soon be calling
on ai to scout the next superstar. The Guardian.
Gudmundsson, J. and Horton, M. (2017). Spatio-temporal
analysis of team sports – a survey. Pattern Recogni-
tion, 61:491–504.
G
¨
ullich, A. (2014). Many roads lead to Rome – develop-
mental paths to Olympic gold in men’s field hockey.
European Journal of Sport Science, 14(8):706–714.
Lundberg, S. M. and Lee, S.-I. (2017). A unified approach
to interpreting model predictions. In Advances in Neu-
ral Information Processing Systems (NeurIPS), vol-
ume 30.
Mathien, H. (2016). European soccer database.
Meylan, C., Cronin, J., Oliver, J., and Hughes, M. (2010).
Talent identification in soccer: The role of maturity
status on physical, physiological and technical char-
acteristics. International Journal of Sports Science &
Coaching, 5(4):571–592.
Molnar, C. (2022). Interpretable Machine Learning. Lean-
pub, 2 edition.
Pappalardo, L., Cintia, P., Rossi, A., Massucco, E., Ferrag-
ina, P., Pedreschi, D., and Giannotti, F. (2019). A pub-
lic data set of spatio-temporal match events in soccer
competitions. Scientific Data, 6(1):236.
Power, P., Ruiz, H., Wei, X., and Lucey, P. (2017). Not
all passes are created equal: objectively measuring
the risk and reward of passes in soccer from tracking
data. In Proceedings of the 23rd ACM SIGKDD In-
ternational Conference on Knowledge Discovery and
Data Mining, pages 1605–1613. ACM.
Reeves, M. J., Roberts, S. J., McRobert, A. P., and Little-
wood, M. A. (2018). Sociological predictors in talent
identification of junior-elite football players: A scop-
ing review. Soccer and Society, 19(8):1085–1105.
Ribeiro, M. T., Singh, S., and Guestrin, C. (2016). Why
should i trust you?”: Explaining the predictions of any
classifier. In Proceedings of the 22nd ACM SIGKDD
International Conference on Knowledge Discovery
and Data Mining, pages 1135–1144. ACM.
Sarmento, H., Anguera, M. T., Pereira, A., and Ara
´
ujo,
D. (2018). Talent identification and development in
male football: A systematic review. Sports Medicine,
48(4):907–931.
Schumaker, R. P., Solieman, O. K., and Chen, H. (2010).
Sports Data Mining, volume 26 of Integrated Series
in Information Systems. Springer.
Tavana, M., Azizi, F., Azizi, F., and Behzadian, M. (2013).
A fuzzy inference system with application to player
selection and team formation in multi-player sports.
Sport Management Review, 16(1):97–110.
icSPORTS 2025 - 13th International Conference on Sport Sciences Research and Technology Support
48

Vaeyens, R., Lenoir, M., Williams, A. M., and Philippaerts,
R. M. (2008). Talent identification and development
programmes in sport: current models and future direc-
tions. Sports Medicine, 38(9):703–714.
van Arem, K. W., Goes-Smit, F., and S
¨
ohl, J. (2025). Fore-
casting the future development in quality and value of
professional football players for applications in team
management.
Vicente, H. (2024). How AI and Data are Shaping the Fu-
ture of Scouting. Shorthand Stories.
Can We Really Predict Which Football Players Will Succeed?
49
