
An Efficient and Scalable Hyperdimensional Computing Framework for
Anomaly Classification in Industrial Systems
V
´
ıctor Ortega
a
, Soledad Escolar
b
, Fernando Rinc
´
on
c
, Jes
´
us Barba
d
, Juli
´
an Caba
e
and Juan Carlos L
´
opez
f
School of Computer Science, University of Castilla-La Mancha, Ciudad Real, Spain
Keywords:
Hyperdimensional Computing, Industrial Systems, Anomaly Detection, Predictive Maintenance, Machine
Learning.
Abstract:
This paper presents a hyperdimensional computing (HDC)-based framework for anomaly classification, de-
signed to meet the specific demands of industrial systems. Inspired by cognitive processes, HDC employs
high-dimensional representations to enable robust, low-complexity, and hardware-efficient computation. The
proposed framework encompasses the entire processing pipeline, from data encoding to anomaly classification,
and is optimized for efficient execution on both conventional computing platforms and resource-constrained
devices. To assess its effectiveness, we conduct a case study based on a real-world scenario involving 118
emergency lighting devices that collect and transmit operational data to a central sink capable of detecting
anomalous behavior. Experimental results demonstrate that the proposed approach achieves high classification
accuracy and confirm its suitability for deployment in integrated industrial systems with limited computational
resources.
1 INTRODUCTION
Fault detection and mitigation is an ongoing challenge
that has become critically important in modern indus-
trial environments, where intelligent systems and in-
terconnected devices are increasingly integrated into
complex production and monitoring infrastructures
across a wide range of applications. A random, non-
compliant, unexpected behavior in a system, which
may even be malicious is called an anomaly (Bad-
dar et al., 2014). The root cause of such deviating
behavior can vary widely, e.g. component failures,
software errors and environmental factors. Regard-
less the root cause, the consequences of not having
a proper anomaly detection strategy can be serious,
making timely and effective mitigation essential.
Anomaly detection aims to identify patterns in
events that deviate significantly from expected or nor-
mal behavior. Typically, each event is represented by
a
https://orcid.org/0009-0003-1548-3260
b
https://orcid.org/0000-0002-8019-9640
c
https://orcid.org/0000-0003-4688-8650
d
https://orcid.org/0000-0003-1931-3245
e
https://orcid.org/0000-0002-7641-4643
f
https://orcid.org/0000-0002-7372-1568
a data instance composed of a set of descriptive fea-
tures, which are not necessarily all equally informa-
tive (Bhuyan et al., 2014). The problem may be for-
mulated as a classification problem in which anoma-
lous behaviors need to be distinguished from nor-
mal behaviors (Baddar et al., 2014). The literature
on anomaly detection in industrial systems encom-
passes a broad spectrum of approaches across var-
ious research areas (Chandola et al., 2009; Baddar
et al., 2014), such as: statistics, Machine Learning
(ML), data mining, information theory, and spectral
theory. Among these approaches, those based on ML
have received increased attention for their ability to
learn from data and effectively classify or group ab-
normal and previously unseen behaviors (Nassif et al.,
2021). However, as noted in (Hern
´
andez-Cano et al.,
2021), several limitations remain, primarily concern-
ing the efficiency, power consumption, and robust-
ness of the algorithms. Specifically, ML-based so-
lutions are highly computationally intensive, making
them impractical for edge devices, which often op-
erate online and under strict constraints in memory,
processing power, and energy consumption. Further-
more, ML algorithms often exhibit high sensitivity
to noise and hardware failures and struggle to es-
tablish causality, meaning that they cannot directly
Ortega, V., Escolar, S., Rincón, F., Barba, J. and Caba, J.
An Efficient and Scalable Hyperdimensional Computing Framework for Anomaly Classification in Industrial Systems.
DOI: 10.5220/0013669700003982
Paper published under CC license (CC BY-NC-ND 4.0)
In Proceedings of the 22nd International Conference on Informatics in Control, Automation and Robotics (ICINCO 2025) - Volume 2, pages 429-436
ISBN: 978-989-758-770-2; ISSN: 2184-2809
Proceedings Copyright © 2025 by SCITEPRESS – Science and Technology Publications, Lda.
429

determine whether one variable influences changes
in another. This limitation is particularly critical in
anomaly detection, where the goal is not only to iden-
tify anomalous behaviors but also to understand their
root causes and provide meaningful justifications for
effective remediation. The work presented in (Nassif
et al., 2021) offers a systematic literature review of
ML-based techniques to anomaly detection in Internet
of Things (IoT) environments, categorizing them into
supervised, semi-supervised, and unsupervised meth-
ods.
Hyperdimensional Computing (HDC) is a brain-
inspired computational paradigm designed to address
classification problems by mimicking aspects of cog-
nitive processing. HDC operates on high-dimensional
vectors, also known as hypervectors, which are capa-
ble of encoding, storing, and manipulating informa-
tion in a manner analogous to distributed representa-
tions in the human brain. The efficiency of the tech-
nique lies in the fact that vector operations are highly
parallelizable using, for example, GPUs (Grid Pro-
cessing Units) or accelerators, and can be executed
in real time on a very large data set. These charac-
teristics make it particularly attractive for resource-
constrained environments such as edge devices in IoT
applications.
The main contribution of this work is twofold: 1)
the theoretical foundation of an HDC system imple-
menting a complete processing pipeline for anomaly
classification, specifically adapted to the diverse op-
erational scenarios encountered in industrial comput-
ing; and 2) the validation of a case study focused on
anomaly detection in the behavior of emergency light-
ing devices. The paper is organized as follows: in the
next Section we review the related works, then in Sec-
tion 3 we present the system model for anomaly de-
tection based on HDC. Section 4 describes the real-
world dataset used in our experiments and in Sec-
tion 5 we present the results of the evaluation per-
formed of the proposed HDC system. Finally, in Sec-
tion 6 we draw the main conclusions and suggestions
for future research.
2 RELATED WORKS
Hyperdimensional Computing (HDC) (Kanerva,
2009) is a computational paradigm inspired by
the way the human brain represents and processes
information. It relies on high-dimensional math-
ematical structures known as hypervectors, which
typically consist of thousands of components. These
hypervectors act as the core units for encoding
knowledge and relationships between concepts. By
means of vectorial operations, such as binding (⊗),
bundling (⊕), and permutation (
∏
) (Yu et al., 2022)
(also referred as MAP, multiplication, adding, and
permutation), hypervectors can be combined and
transformed to represent complex data structures and
abstractions.
The processing pipeline of an HDC-based classi-
fication system usually consists of three main stages:
encoding, training, and classification (Chang et al.,
2023; Morris et al., 2019). In the first stage, the input
data space is projected into a high-dimensional space
using a suitable encoding method. This encoding pro-
cess is highly dependent on the nature of the input
data and plays a critical role in determining the over-
all classification accuracy (Aygun et al., 2023). The
training step aggregates all hypervectors associated to
the samples in some category into a single represen-
tative hypervector, known as the class or prototypical
hypervector, which will be further used in the clas-
sification process. Training may be done in a single-
step, which means that each hypervector is learnt only
one time or using iterative training, also called retrain-
ing (Shahhosseini et al., 2022). In the final step, clas-
sification (or inference), a test sample is encoded into
a hypervector using the same encoding function and
then compared against all class hypervectors to iden-
tify the class with the highest similarity.
HDC has already demonstrated its potential for
anomaly detection. For instance, the work pre-
sented in (Wang et al., 2022) introduces the ODHD
framework, which adopts a Positive-Unlabeled (P-
U) learning strategy. In this approach, the model is
trained exclusively on inlier samples, while the test-
ing phase involves a dataset that may contain both
inliers and outliers, with no label information pro-
vided. The methodology closely aligns with the
approach followed in this paper. Experimental re-
sults indicate that ODHD outperforms three base-
line methods (OCSVM, Isolation Forest, and Autoen-
coder) across six datasets and three performance met-
rics: accuracy, F1-score, and ROC-AUC. HDC is em-
ployed in (Arliss et al., 2024) for anomaly detec-
tion based on variations in network topology. The
topology is initially represented as a time-ordered se-
quence of graphs, where each graph is directed and
count-weighted. Subsequently, both nodes and edges
are encoded as hypervectors. To identify anoma-
lies, the method first calculates a primitive anomaly
score, followed by an anomaly confidence measure
obtained by referencing the score against a histor-
ical distribution of past scores. Experimental re-
sults demonstrate that this approach achieves high
accuracy and efficiency on both synthetic and real-
world datasets. The work presented in (Wang et al.,
ICINCO 2025 - 22nd International Conference on Informatics in Control, Automation and Robotics
430

2021) proposes HDAD, which leverages HDC to val-
idate sensor readings collected by autonomous vehi-
cles prior to their use in downstream decision-making.
In this approach, sensor data is first encoded into an
intermediate hypervector, which is then decoded into
a reconstructed feature vector. The system compares
the reconstructed vector with the original test sam-
ple to assess its validity. The authors report achiev-
ing 100% detection accuracy on a real-world dataset
of vehicle sensor readings. In the IoT scope, HDC
has been used for the detection of network attacks
and evaluated on the NSL-KDD dataset in (Ghajari
et al., 2025). The model achieved an accuracy of
91.55% on the KDDTrain+ subset, outperforming tra-
ditional approaches. The work presented in (Shahhos-
seini et al., 2022) introduces a method based on Hy-
perdimensional Computing (HDC) for learning end-
user physiological and behavioral patterns, specifi-
cally targeting health-related applications on wear-
able devices. The proposed approach employs iter-
ative learning to refine the model over time, achiev-
ing up to 35.8× faster training performance compared
to state-of-the-art deep neural network (DNN) algo-
rithms, while maintaining comparable accuracy.
3 SYSTEM MODEL
We consider a set of n devices d
1
,d
2
,... ,d
n
tailored
to monitor a wide variety of physical and environ-
mental phenomena of interest, including, for instance,
motion, vibration, or gas concentration. In order to
perform this task, such devices are carefully designed
and equipped with custom hardware (e.g. MCU, ad-
vanced sensors, battery) and are provided with com-
munication capabilities to transmit periodically data
of interest, as well as their status and self-diagnostic
information, towards a concentrator node d
0
, also
known as the sink, which stores the data and subse-
quently forwards it to an external network. Along the
path from the transmitting device towards the sink,
each device selects the next neighbor for data com-
munication by considering several criteria, e.g. the
quality of the link, thus creating a dynamic multi-hop
mesh network with the sink as the final destination
within the local network.
During each transmission period, every device
d
i
,1 ≤ i ≤ n generates a text message by aggregat-
ing the values of a set of k characteristics, that is,
the variables of interest. These features provide in-
formation about the device’s identity, status (e.g., bat-
tery level), or network diagnostics (e.g., next hop, trip
time, link quality), among others. Most of the fea-
tures collected by the devices are non-deterministic,
which means that their values can fluctuate within a
broad range that may still be considered normal for a
given device. However, device failures can still occur,
which may result in the transmission of outliers that
may take one or more features and that significantly
differ from the values that are considered normal.
In practice, data transmitted over time by devices
are aggregated into a file of features or dataset. Let R
be the data space composed of all data transmitted by
the n devices during a period of time and let R
i
and
R
i, j
be the subsets of R that contain all values for de-
vice d
i
and all values that take the feature j of device
d
i
, respectively, with 1 ≤ j ≤ k and 1 ≤ i ≤ n. Given a
set of samples R
i, j
corresponding to device d
i
and fea-
ture j, we define its training set R
↑
i, j
as the ascendingly
sorted set of samples, i.e. R
↑
i, j
= {r
min
i, j
,. .. ,r
max
i, j
}. A
single data point r
x
i, j
∈ R
↑
i, j
represents the x
th
sam-
ple taken by feature j of device d
i
. The sequence
of the x
th
data points of all features j is denoted as
r
x
i
= {r
x
i,0
,r
x
i,1
,. .. ,r
x
i,k−1
}. We denote as r
min
i, j
and r
max
i, j
to the minimum and maximum value, respectively, in
the subset R
↑
i, j
, with r
max
i, j
− r
min
i, j
> 0.
3.1 Encoding
We define an encoding function ϕ : R → H that maps
each data point r
x
i, j
in R into a hypervector h ∈ H ,
with h = {−1, 1}
D
and D is the dimension of the hy-
pervectors (generally, greather or equal than 10,000).
The encoding function ϕ must be carefully designed
to generate hypervectors that preserve the correla-
tion structure of the input data. In this work, ϕ is
based on a quantization-based approach as described
in (Basaklar et al., 2021), that discretizes the input
space to enable consistent and meaningful hypervec-
tor representations.
Let M be the number of quantization levels and
let Q be the set of level hypervectors, i.e. Q =
{q
0
,q
1
,. .. ,q
M−1
}, where q
m
is the m
th
level hy-
pervector. The first level hypervector q
0
is initial-
ized randomly; the rest of level hypervectors, i.e.,
{q
1
,. .. ,q
M−1
}, are generated incrementally from the
previous one, specifically, q
i+1
differs from its prede-
cessor q
i
by flipping exactly b =
D
2(M−1)
components,
which ensures a uniform and gradual increase in dis-
similarity across levels. Note that, in doing so, we
produce a matrix of M × D and a three-dimensional
tensor of k × M level hypervectors to represent the
level hypervectors of each d
i
.
Let us define the function L : R → Q that returns
the level hypervector corresponding to a single data
point, that is defined as follows:
An Efficient and Scalable Hyperdimensional Computing Framework for Anomaly Classification in Industrial Systems
431

L(r
x
i, j
) =
q
0
x = min
q
m
min+σm ≤ x ≤ min +σ(m + 1),
∀x ∈ (min, max),m ∈ [0,M − 1)
q
M−1
x = max
where σ is defined as the number of items per level,
i.e., σ = r
max
i, j
− r
min
i, j
/M. For each sequence of
samples r
x
i
in the data set, the encoding function ϕ
produces its corresponding hypervector, denoted as
h
x
i
, by adding up their level hypervectors:
h
x
i
= L(r
x
i,0
) ⊕ L(r
x
i,1
) ⊕ . .. ⊕L(r
x
i,(k−1)
) (1)
The sum operation corresponds to the bundling func-
tion ⊕, which ensures that the resulting hypervector
is maximally similar to their operands, i.e. it acts by
aggregating the hypervectors taken as input.
3.2 Training
During the training phase, the input data space is used
to generate a class hypervector, also known as the pro-
totypical hypervector, for each device d
i
, denoted as
H V
i
, which is computed as:
H V
i
=
M
h
x
i
∀x ∈ R
i
(2)
H V
i
is constructed by applying the bundling oper-
ation to the hypervectors of all samples in the data
space associated with device d
i
. This process encodes
the device’s normal operating behavior into a refer-
ence hypervector, which is later used in the classifica-
tion stage to detect deviations indicative of anomalies.
3.3 Classification
Let {H V
1
,H V
2
,. .. ,H V
n
} be the set of class hy-
pervectors for n devices. Let t
i
be a sequence of sam-
ples t
i
= {t
i,0
,t
i,1
,. .. ,t
i,(k−1)
} to be tested. We classify
the sequence t
i
as an outlier of d
i
iff the cosine similar-
ity function between its hypervector h
i
and the class
hypervector H V
i
, computed as:
cos(h
i
,H V
i
) =
h
i
× H V
i
||h
i
|| × ||H V
i
||
(3)
is below a certain threshold S
+
i
. It is worth noting
that the smaller the difference between h
i
and H V
i
,
the higher the resulting cosine similarity. Addition-
ally, the choice of the threshold value S
+
i
is critical to
system performance, as it directly influences classifi-
cation precision.
4 REAL-WORLD DATASET
DESCRIPTION
The HDC system proposed has been evaluated using
a case study focused on anomaly detection in emer-
gency lighting devices. To this purpose, we consider a
system of n emergency lighting devices distributed in
one or several nearby buildings. These devices are in-
tended to activate automatically when the main power
supply fails (e.g. during outages or blackouts), ensure
visibility and safety in enclosed spaces by provid-
ing essential lighting, evacuation routes, and access
to emergency exits. To ensure that devices function
properly, hyperdimensional computation was used to
learn from the behavior that these devices have and,
with this information, to detect anomalies that may
occur, thus indicating the malfunction of one or sev-
eral emergency lighting devices.
The emergency lighting devices send two types of
messages at different frequencies: 1) status, which
contains the data related to the device state and 2) di-
agnosis, which contains the device diagnostic data.
During two periods of 6 and 24 days respectively,
from December 7th to December 12th and from De-
cember 24th to January 16th, we collect both types of
data (status and diagnosis) from the n devices, which
were merged into one single dataset, where a sample
is formed by the combination of one sample from the
status data and one other sample from the diagnostic
data for a single device. The total number of samples
collected thus is 1820172, each with 117 variables,
resulting in a dataset of size 4.7GB. Since the num-
ber of total variables in each sample was very high,
we implemented an algorithm to discard those vari-
ables whose values were poorly correlated with other
variables and variables providing a low value. After
applying this filtering, we obtained a final real-world
dataset with the characteristics described in Table 1.
Figure 1 shows the correlation matrix of k × k vari-
ables and for an emergency lighting device, where red
and blue indicate proportional and inversely propor-
tional correlation, respectively, while gray indicates
that the variables are not related.
Table 1: Real-world dataset parameters.
Param. Description Value
S Number of samples in the dataset 1820172
V Number of variables discarded 81
W Size of the real-world dataset 257 MB
p % of samples used for training 80
1 − p % of samples used for testing 20
4.1 Threshold Selection
The resulting dataset was subsequently divided into
two different subsets. The first subset, comprising
p=80% of the total samples, was used to train and
encode the prototypical hypervectors that character-
ICINCO 2025 - 22nd International Conference on Informatics in Control, Automation and Robotics
432
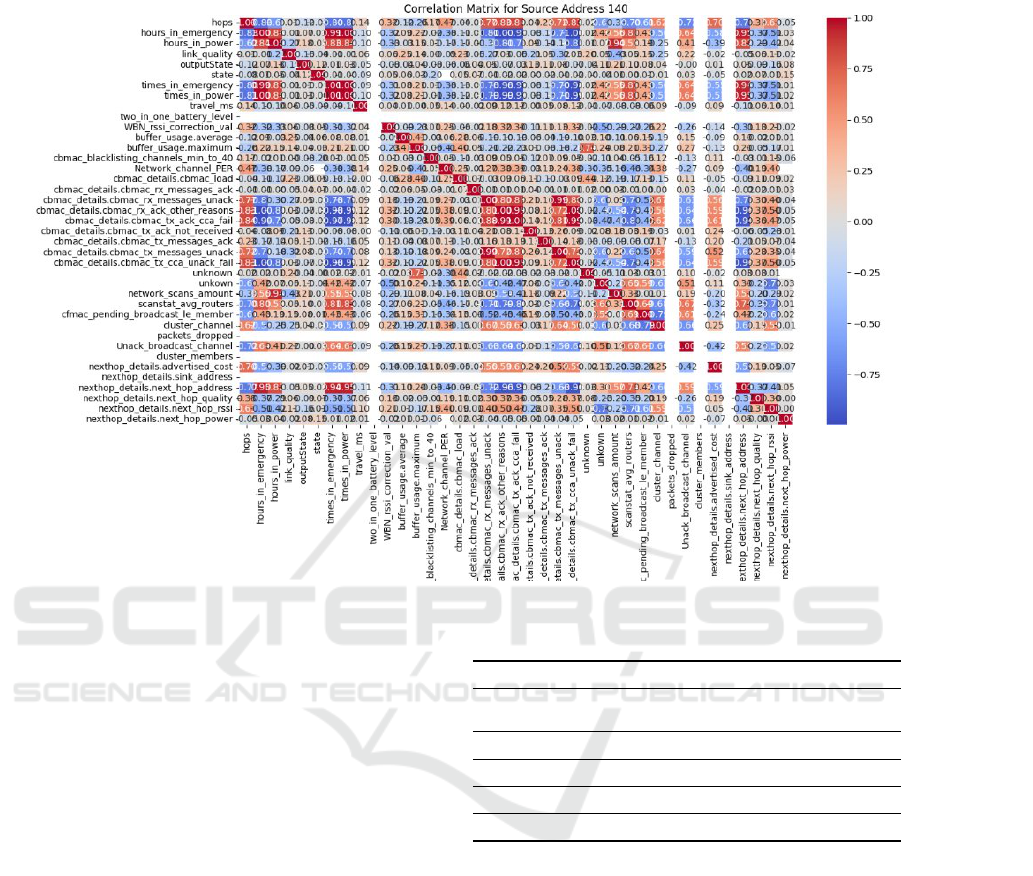
Figure 1: Correlation matrix obtained for an emergency lighting device.
ize the normal behavior of the devices, as described
in Section 3. The second subset, comprising 1 − p of
the total samples, was used to test the HDC model.
We assume that each sample in the training dataset is
considered a normal behavior of an emergency light-
ing device so, consequently, the definition of anomaly
is based on the similarity between the hipervector of
the test sample and the prototypical hypervector by
using the similarity cosine function, as formulated in
Eq 3. For the sake of simplicity we have defined the
same thresholds for all emergency devices with the
next values: S
+
= {0.8,0.85,0.9,0.95}.
5 EXPERIMENTATION
We have fully implemented the HDC model explained
in Section 3 using the TorchHD Python library (Hed-
des et al., 2023), and we have executed it on a laptop
with an 11th Gen Intel(R) Core(TM) i5-11400H @
2.70GHz CPU and 16 GB RAM, and a NVIDIA RTX
3050 4GB GDDR6.
Table 2 summarizes the parameters used in the im-
plementation. In Listing 1 we show the Python code
to generate M level hypervectors for a single feature,
based on the quantization-based approach, as detailed
Table 2: Summary of parameters used in the experiments.
Param. Description Value
n Number of devices 118
Number of hypervector classes
k Number of variables 36
D Dimension of the hypervectors 10000
M Number of level hypervectors (LH) [1,3336]
b Changes between consecutive LH [1,2500]
in Section 3.1. This code was parallelized on a GPU
to optimize its performance.
In line 3, the first level hypervector is randomly
generated. Line 6 computes the number of changes b
between consecutive level hypervectors as a function
of D and M. In lines from 14 to 20 a set of indices
is created in order to avoid repetitions of components
flipped from one hypervector to another. In line 21 we
flip the selected components from the previous level
hypervector. In line 22 the new hypervector is saved
so it can be used in the following iteration. This pro-
cedure will be performed M times resulting in a ma-
trix of M × D.
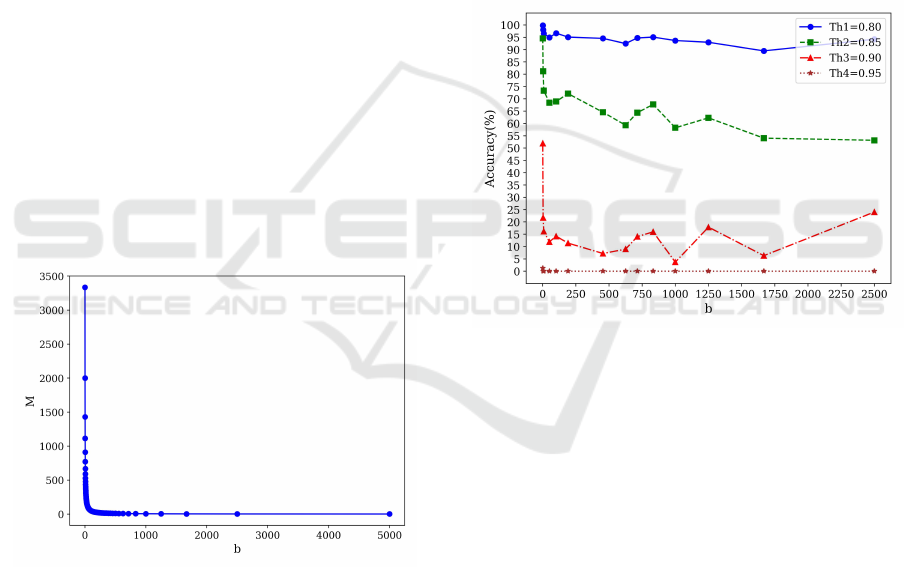
We have evaluated the model using different M
numbers of level hypervectors, which are calculated
by varying the range of items that flip between two
consecutive hypervectors b from 1 to 2500. Note that
An Efficient and Scalable Hyperdimensional Computing Framework for Anomaly Classification in Industrial Systems
433
1 def range_hdv_levels(D, M):
2 matrix = []
3 fst_hdv = torchhd.random(1, D,
4 "MAP", dtype=torch.int8)
5 matrix.append(fst_hdv[0])
6 b = round(D / (2 * (M - 1)))
7 if b == 0: b = 1
8 idx = set()
9 for i in range(M):
10 if i == 0:
11 prev_tsr = matrix[0].clone()
12 else:
13 prev_tsr = matrix[i-1].clone()
14 idx_av = list(set(range(D)) - idx)
15 if len(idx_av) < b:
16 idx = set()
17 idx_av = list(range(D))
18 selected = random.sample(idx_av, b)
19 idx.update(selected)
20 indices = torch.tensor(selected)
21 prev_tsr[indices] *= -1
22 matrix[i] = prev_tsr
23 return matrix
Listing 1: Generation of a matrix of correlated hypervec-
tors.
the number of level hypervectors is an important met-
ric to consider, as it poses an interesting tradeoff be-
tween model accuracy and resources employed. We
have computed M as as function of b, and the results
can be seen in Figure 2.
Figure 2: Number of M for each b.
5.1 Accuracy
The objective of the system is to determine whether
the similarity between two hypervectors, one repre-
senting the x
th
sample and other a hypervector of ref-
erence of the device that represents its normality, is
lower than a certain threshold such that x
th
is clas-
sified as an anomaly. Specifically, we are interested
in evaluating the accuracy of our HDC model, by ac-
counting the number of samples correctly classified
with respect to the total number of samples.
The first test was conducted using the testing
dataset, where each sample is assumed to represent
normal behavior. Figure 3 illustrates the accuracy of
the HDC model across different threshold values for
S
+
and for different values of b. As expected, increas-
ing the threshold results in decreased accuracy. This
behavior arises because achieving a high cosine sim-
ilarity value requires the test sample to closely match
the reference. Consequently, the best results were ob-
tained with a threshold of 0.8. In contrast, when the
threshold was increased to 0.95, the model’s accuracy
dropped to nearly zero, which means that the majority
of test samples fail to meet the stricter threshold. On
the other hand, the highest accuracy is obtained with
b = 1; note that, however, for small values of b, the
accuracy of the system remains similar to the results
obtained with b = 1.
Figure 3: Accuracy of the model for different values of b.
In order to evaluate how the HDC model behaves
with samples whose values differ significantly from
the values in the dataset that, as explained, represent
the normal behavior of the device, we had to gener-
ate synthetic data. The synthetic data was generated
by repeatedly selecting the first 100 samples from the
dataset and applying two different deviation values:
0.5 and 0.9. For each case, the same set of 100 en-
tries was used: first, the deviation was applied to a
single characteristic; then, to two characteristics; and
progressively to more, until all characteristics were
included. This procedure resulted in the generation
of two more datasets that were used to test the per-
formance of the system anomaly detection. Both
datasets have a total of 3400 samples each and a total
size of 3.9MB. The results of testing the HDC system
with the synthetic data may be observed in Figure 4.
The left side of the figure shows the accuracy for a
deviation of 0.5, while the right side corresponds to a
deviation of 0.9. As observed, when the threshold is
set to 0.95 or 0.9, the accuracy remains close to 100%
ICINCO 2025 - 22nd International Conference on Informatics in Control, Automation and Robotics
434
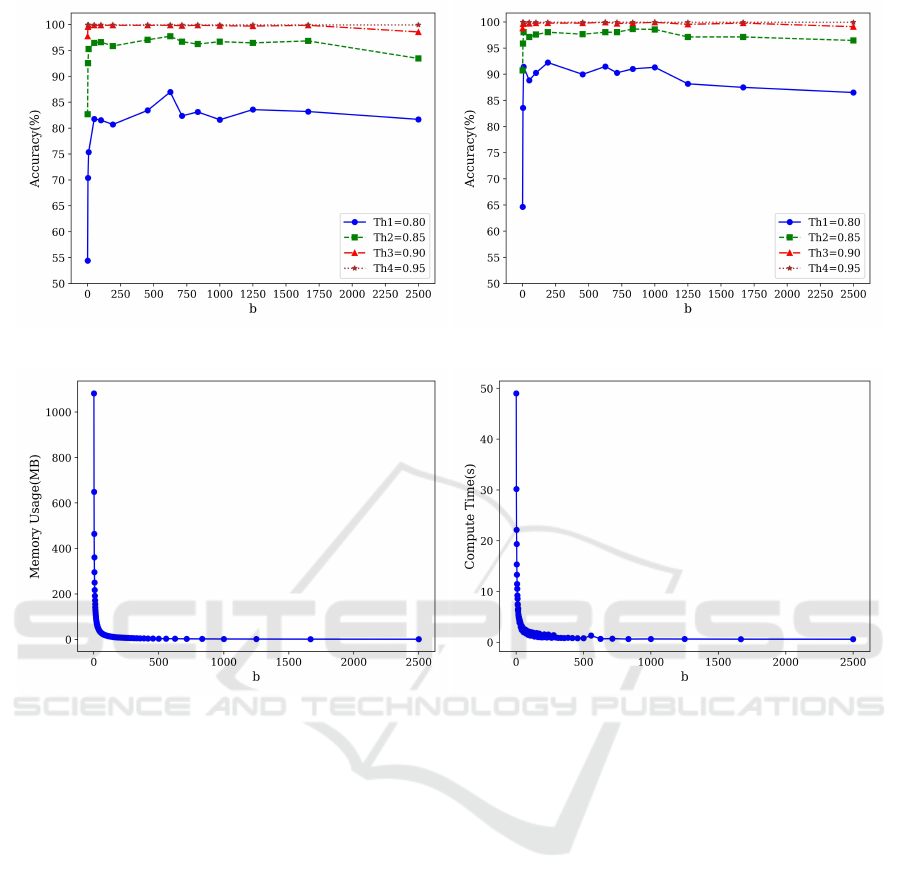
Figure 4: Accuracy of the model with deviations on the synthetic data of 0.5 (left) and 0.9 (right) for different thresholds.
Figure 5: Memory RAM consumption (left) and execution time (right) for different values of b.
across all values of b. In contrast, lower threshold val-
ues result in a noticeable decrease in model accuracy.
These results are due to the fact that these synthetic
data samples are expected to be classified as anoma-
lies. Therefore, with a higher threshold, it is more
likely that the cosine similarity of a given sample does
not reach the threshold, resulting in its classification
as an anomaly and, consequently, in high accuracy. In
contrast, with a lower threshold, it is more likely that
samples reach the threshold, leading to misclassifica-
tions and, therefore, lower accuracy.
5.2 Memory Usage and Execution
Times
HDC systems are influenced by several key param-
eters that critically affect the resource-performance
tradeoff, as outlined in Table 2. Specifically, the hy-
pervector dimensionality (D), the number of input
features (k), and the total number of level hypervec-
tors (M) have a substantial impact on RAM consump-
tion, with the storage cost scaling as O(k ×M ×D). In
addition, the size of the dataset used for training and
testing plays a critical role in system design and eval-
uation. Although larger datasets can improve model
accuracy, they also impose greater demands on mem-
ory, computational power, and processing time, which
could limit the feasibility of implementing the HDC
system in an embedded system.
To illustrate this, we have computed the require-
ments of RAM for different values of b of our HDC
system, which will store a different number of level
hypervectors M for different values of b, thus affect-
ing the RAM consumption. In Figure 5 on the left side
is shown how RAM decreases when b increases, since
the HDC system will require less number of level hy-
pervectors. Figure 5 on the right side shows the im-
pact of varying b on the time invested in computing
the level hypervectors. Recall that the procedure of
computing the level hypervectors was parallelized on
a GPU. As observed, in the worst-case scenario with
the lowest value of b, computing the corresponding
M = 3336 level hypervectors takes approximately 50
seconds. However, as illustrated in Figure 3, reducing
An Efficient and Scalable Hyperdimensional Computing Framework for Anomaly Classification in Industrial Systems
435

the number of level hypervectors (M) still yields ac-
curacy results comparable to those obtained with the
maximum M. This reduction significantly enhances
the feasibility of implementing the HDC system on
embedded platforms.
6 CONCLUSIONS
We have proposed an efficient and scalable HDC sys-
tem for anomaly classification in industrial environ-
ments. The system was evaluated in a real-world
scenario involving 118 devices periodically transmit-
ting status information. Our HDC system operates
autonomously, without requiring prior knowledge of
what constitutes an anomaly or labeled training data.
As a result, the system behaves in an unsupervised
manner, continuously learning normal patterns of be-
havior and identifying deviations that may indicate
faults or abnormal conditions, making it particularly
suitable for dynamic and data-scarce industrial set-
tings. As future work, we propose the implementa-
tion of our HDC system on customized accelerators
for the optimization of vector instructions.
ACKNOWLEDGEMENTS
This paper is partially supported by the
Spanish Ministry of Science and Innovation
MCIN/AEI/10.13039/501100011033 under Grant
TALENT-BELIEF (PID2020-116417RB-C44), the
project OASIS (PID2023-148285OB-C41) and the
Project MIRATAR TED2021-132149B-C41 funded
by MCIN/AEI/10.13039/501100011033 and by
European Union NextGenerationEU/PRTR.
REFERENCES
Arliss, W., Godbehere, A. B., and Mueller, G. (2024). Using
hypervectors for efficient anomaly detection in graph
streams. In 2024 IEEE 11th International Conference
on Data Science and Advanced Analytics (DSAA),
pages 1–10.
Aygun, S., Shoushtari Moghadam, M., Najafi, M. H., and
Imani, M. (2023). Learning from hypervectors: A sur-
vey on hypervector encoding.
Baddar, S. W. A.-H., Merlo, A., and Migliardi, M. (2014).
Anomaly detection in computer networks: A state-of-
the-art review. J. Wirel. Mob. Networks Ubiquitous
Comput. Dependable Appl., 5:29–64.
Basaklar, T., Tuncel, Y., Narayana, S. Y., Gumussoy, S., and
Ogras, U. Y. (2021). Hypervector design for efficient
hyperdimensional computing on edge devices.
Bhuyan, M. H., Bhattacharyya, D. K., and Kalita, J. K.
(2014). Network anomaly detection: Methods, sys-
tems and tools. IEEE Communications Surveys & Tu-
torials, 16(1):303–336.
Chandola, V., Banerjee, A., and Kumar, V. (2009).
Anomaly detection: A survey. ACM Comput. Surv.,
41(3).
Chang, C.-Y., Chuang, Y.-C., Huang, C.-T., and Wu, A.-
Y. (2023). Recent progress and development of hy-
perdimensional computing (hdc) for edge intelligence.
IEEE Journal on Emerging and Selected Topics in
Circuits and Systems, 13(1):119–136.
Ghajari, G., Ghimire, A., Ghajari, E., and Amsaad, F.
(2025). Network anomaly detection for iot using hy-
perdimensional computing on nsl-kdd.
Heddes, M., Nunes, I., Verg
´
es, P., Kleyko, D., Abraham, D.,
Givargis, T., Nicolau, A., and Veidenbaum, A. (2023).
Torchhd: an open source python library to support
research on hyperdimensional computing and vector
symbolic architectures. J. Mach. Learn. Res., 24(1).
Hern
´
andez-Cano, A., Matsumoto, N., Ping, E., and Imani,
M. (2021). Onlinehd: Robust, efficient, and single-
pass online learning using hyperdimensional system.
In 2021 Design, Automation & Test in Europe Confer-
ence & Exhibition (DATE), pages 56–61.
Kanerva, P. (2009). Hyperdimensional computing: An
introduction to computing in distributed representa-
tion with high-dimensional random vectors. Cognitive
Computation, 1:139–159.
Morris, J., Imani, M., Bosch, S., Thomas, A., Shu, H., and
Rosing, T. (2019). Comphd: Efficient hyperdimen-
sional computing using model compression. In 2019
IEEE/ACM International Symposium on Low Power
Electronics and Design (ISLPED), pages 1–6.
Nassif, A. B., Talib, M. A., Nasir, Q., and Dakalbab, F. M.
(2021). Machine learning for anomaly detection: A
systematic review. IEEE Access, 9:78658–78700.
Shahhosseini, S., Ni, Y., Kasaeyan Naeini, E., Imani, M.,
Rahmani, A. M., and Dutt, N. (2022). Flexible and
personalized learning for wearable health applications
using hyperdimensional computing. In Proceedings of
the Great Lakes Symposium on VLSI 2022, GLSVLSI
’22, page 357–360, New York, NY, USA. Association
for Computing Machinery.
Wang, R., Jiao, X., and Hu, X. S. (2022). Odhd:
one-class brain-inspired hyperdimensional computing
for outlier detection. In Proceedings of the 59th
ACM/IEEE Design Automation Conference, DAC ’22,
page 43–48, New York, NY, USA. Association for
Computing Machinery.
Wang, R., Kong, F., Sudler, H., and Jiao, X. (2021). Brief
industry paper: Hdad: Hyperdimensional computing-
based anomaly detection for automotive sensor at-
tacks. In 2021 IEEE 27th Real-Time and Embed-
ded Technology and Applications Symposium (RTAS),
pages 461–464.
Yu, T., Zhang, Y., Zhang, Z., and Sa, C. D. (2022). Un-
derstanding hyperdimensional computing for parallel
single-pass learning. In Oh, A. H., Agarwal, A., Bel-
grave, D., and Cho, K., editors, Advances in Neural
Information Processing Systems.
ICINCO 2025 - 22nd International Conference on Informatics in Control, Automation and Robotics
436
