
Play Evaluation Based on Predicting the Outcome of Back-Row Attacks
in Volleyball
Hikaru Yoshihara
1
, Ning Ding
2
and Keisuke Fujii
1 a
1
Nagoya University, Japan
2
Nagoya Institute of Technology, Japan
Keywords:
Machine Learning, Volleyball, Tracking Data.
Abstract:
In volleyball, statistical analysis based on data aggregation at the team or match levels has developed, and its
use for player performance evaluation and tactical analysis has expanded. However, there has been limited
discussion on the quantitative evaluation of how individual plays affect rally outcomes. To address this issue,
a model that predicts rally outcomes under specific conditions using player location data is useful. This study
aims to evaluate plays based on a prediction model, focusing on the first transition following a back-row
attack. We extracted 103 target scenes from game footage recorded from behind the end line and manually
created tracking data for six players per team. Using this dataset, we trained an XGBoost model to predict
the future probability of scoring and the probability of blocking by two or more opponents in each game state
(receive, toss, attack). To quantify play evaluation, we propose the Valuating Volleyball States by Estimating
Probabilities (V2SEP), which expresses play evaluation values in each state based on the prediction model,
weighting them according to the percentage of points scored when a player is blocked. To verify the validity
of the prediction model used in V2SEP, we assessed F1 scores and SHAP values for each state. The results
indicate that the predictions were reasonably accurate and reflected not only the contributions of directly
involved players but also those of other players affecting scoring and block induction. Furthermore, the play
evaluation metrics demonstrate expected trends whereas some scenes show the limitations, suggesting that
V2SEP may be useful for play evaluation in volleyball.
1 INTRODUCTION
Volleyball is a six-player team sport in which players
rally the ball across a net while trying to prevent it
from touching the ground. The game is played on
a rectangular court measuring 18 m × 9 m. Each
team is allowed a maximum of three touches before
returning the ball to the opponent’s court. The basic
sequence of play consists of a receive, a set, and an
attack.
According to volleyball rules, back-row players
are not allowed to attack near the net. If they attack,
they must jump from behind the attack line. An at-
tack executed under this restriction is called a back-
row attack (or back-row attack). One advantage of a
back-row attack is that involving a back-row player in
the offense can create a numerical advantage against
the opponent’s block. Additionally, combination at-
tacks from both front-row and back-row players in-
a
https://orcid.org/0000-0001-5487-4297
creases the variety of offensive plays, such as exe-
cuting a delayed attack. Furthermore, pressure ex-
erted by the back-row attack can contribute to a higher
success rate for front-row attacks. However, because
back-row attacks are performed farther from the net,
they have a higher likelihood of errors, such as hit-
ting the net or sending the ball out of bounds. There-
fore, players must carefully adjust their approach and
attack angles. Moreover, not only the attacker but
also the positioning and movements of surrounding
players play a crucial role in reducing the number of
blockers and enhancing the effectiveness of the attack.
In this study, we focus on back-row attacks and aim
to quantitatively evaluate sequences of play by pre-
dicting attack outcomes based on player positions and
movements.
In recent years, data analysis in volleyball has ad-
vanced, expanding its applications in player perfor-
mance evaluation and tactical analysis. One exam-
ple is a study that analyzed the number, duration,
and height of tosses in a single men’s World Champi-
Yoshihara, H., Ding, N. and Fujii, K.
Play Evaluation Based on Predicting the Outcome of Back-Row Attacks in Volleyball.
DOI: 10.5220/0013666100003988
Paper published under CC license (CC BY-NC-ND 4.0)
In Proceedings of the 13th International Conference on Sport Sciences Research and Technology Support (icSPORTS 2025), pages 29-37
ISBN: 978-989-758-771-9; ISSN: 2184-3201
Proceedings Copyright © 2025 by SCITEPRESS – Science and Technology Publications, Lda.
29
onship match (Hashihara et al., 2009). Additionally,
by tabulating the tosses and spikes that occur during
transitions (switching between offense and defense in
response to an opponent’s attack), it was revealed that
the ability to execute first transitions significantly im-
pacts match results (Yonezawa, 2003). In particu-
lar, first transitions in response to combination attacks
were found to have a strong influence on match results
(Yonezawa, 2004).
Machine learning has also been applied to vol-
leyball analysis. For example, studies have used
both rule-based and black-box models (Lalwani et al.,
2022), as well as Bayesian networks with hidden
Markov processes (Ge and Song, 2024). The former
utilizes team-level factors such as win percentage, av-
erage points per match, and team ranking, while the
latter incorporates intra-match factors such as points
scored, successful serves, and successful blocks to
predict match results and analyze the influence of
these features on predictions. While team-based and
match-based data aggregation analyses are progress-
ing, discussions on the quantitative evaluation of each
play’s impact on rally outcomes remain insufficient.
Simple statistical analysis is challenging because rally
outcomes depend on numerous factors, including the
attacker’s position, their approach, the setter’s accu-
racy, coverage by surrounding players, and the oppo-
nent’s defense. In addition, although player location
data on the court coordinates have been publicly re-
leased and utilized for analysis in other sports (Fujii,
2025) such as soccer (Somers et al., 2024), basketball
(Scott et al., 2024), and badminton (Ding et al., 2024),
no such datasets are publicly available for volleyball.
To assess the impact of plays on rally outcomes
while considering multiple factors simultaneously, a
predictive model based on tracking data is needed.
For instance, in soccer, the Valuing Actions by Es-
timating Probabilities (VAEP) framework quantita-
tively evaluates the contribution of actions such as
passing and dribbling to goal-scoring opportunities
(Decroos et al., 2019). Additionally, a method called
Valuing Defense by Estimating Probabilities (VDEP),
derived from VAEP, has been introduced to assess de-
fensive effectiveness (Toda et al., 2022; Umemoto
et al., 2022), contributing to the development of a
framework for analyzing both offensive and defensive
plays. Although such quantitative evaluation meth-
ods for individual plays have been proposed in other
sports and have contributed to improving competitive
performance, similar research in volleyball remains in
its early stages.
In this study, we propose Valuating Volleyball
States by Estimating Probabilities (V2SEP), a frame-
work for evaluating plays based on predictive mod-
els that utilizes tracking data of six players per team,
extracted from match videos (Figure 1). Our anal-
ysis focuses specifically on the first transition fol-
lowing a back-row attack. The key contributions
of this study are as follows: The main contribu-
tions of this study are: (1) We propose a quan-
titative framework to evaluate the impact of indi-
vidual volleyball plays on rally outcomes. (2) We
present the first publicly available volleyball player
location and event dataset for performance analy-
sis. (3) Experimental results indicated that the pre-
diction models were reasonably accurate and capture
both direct and indirect player contributions on scor-
ing and block, and demonstrate the overall validity
of the proposed method while showing some limi-
tations. The rest of this paper is structured as fol-
lows. Section 2 reviews related work. Section 3 intro-
duces our dataset and Section 4 describes our V2SEP
method. Section 5 presents experimental results, and
Section 6 concludes the paper. Datasets are avail-
lable at https://github.com/keisuke198619/V2SEP-
volleyball.
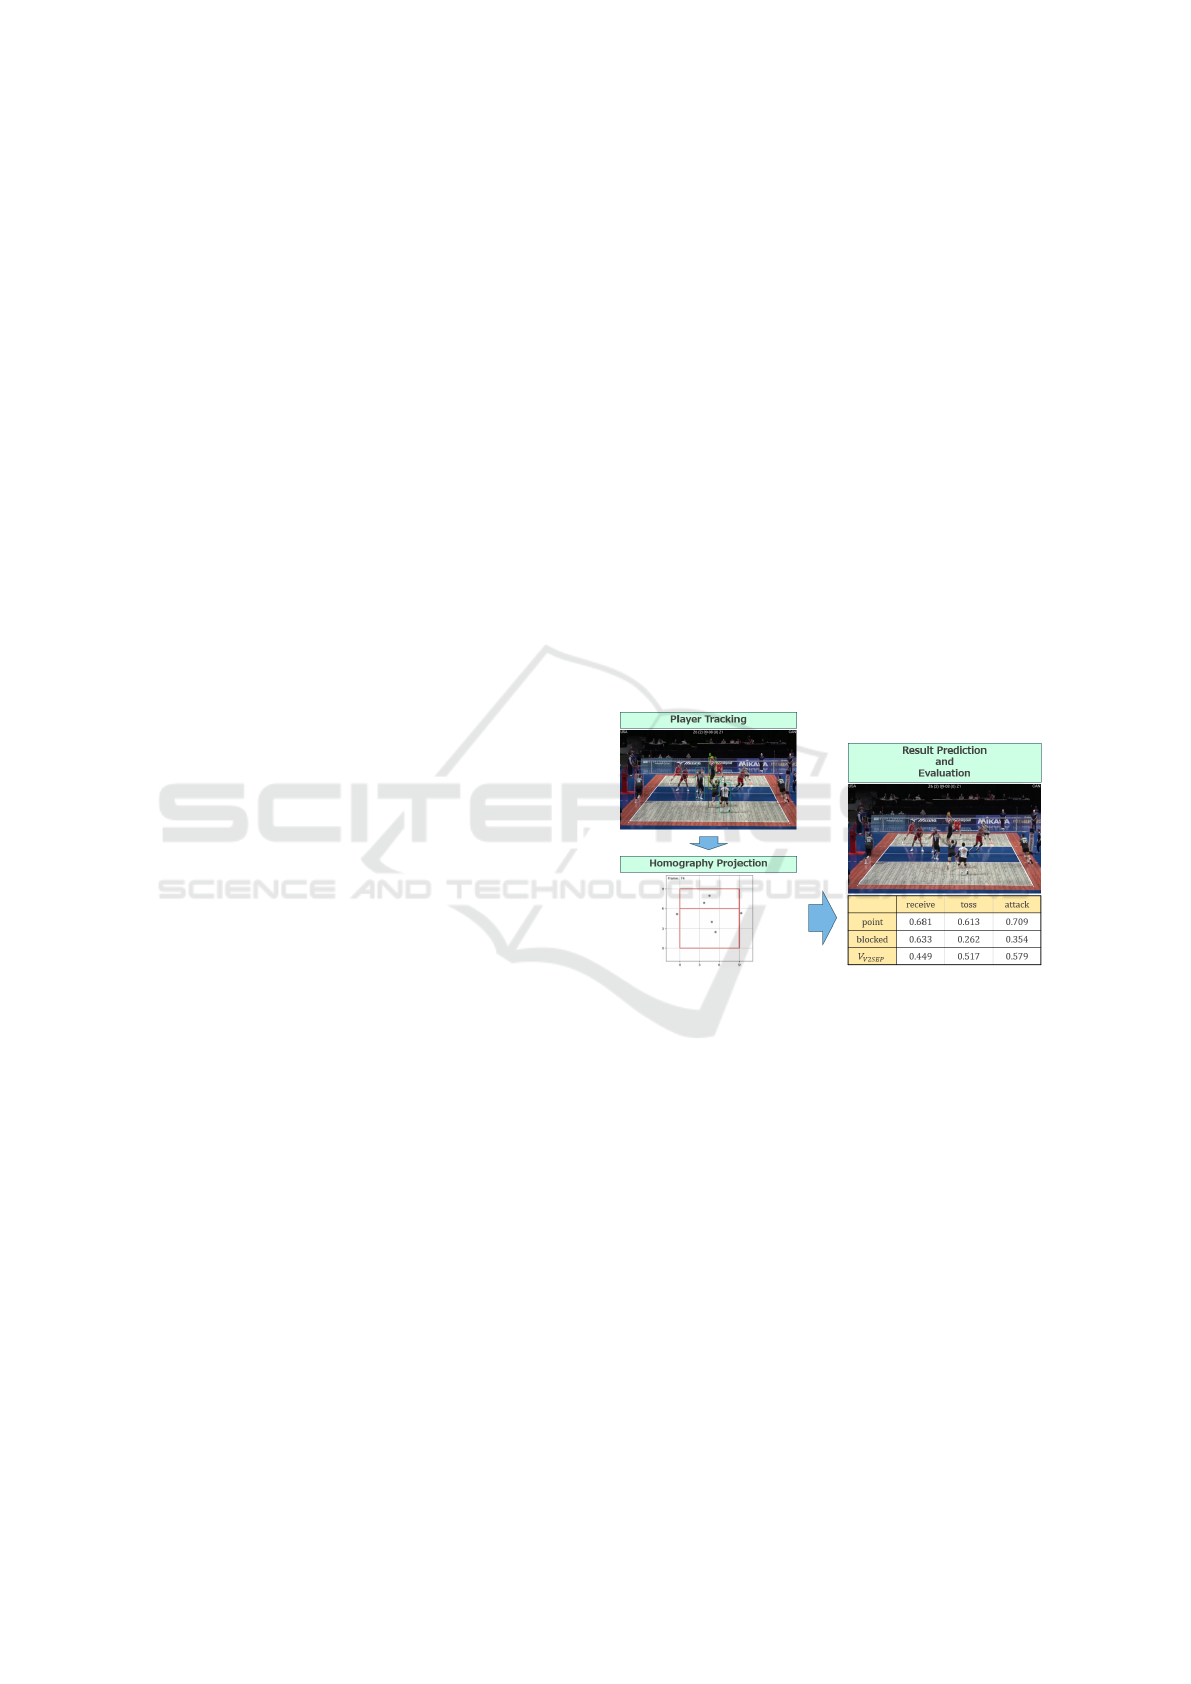
Figure 1: Overview of this study. We tracked the players
and obtained their coordinates on the court by using a ho-
mography transformation. Then, we used this data to pre-
dict the result of the attack and evaluate the play.
2 RELATED WORK
As studies analyzing data on a match-by-match ba-
sis, a study has analyzed the relationship between the
number of blockers and the type of attack against the
opponent’s attack during the first transition, as well
as the match outcome, reconfirming the significant ef-
fect of spiking on match results (Minowa et al., 2016).
There is also a study on the defensive side that an-
alyzed factors such as the position before the block,
the number of blockers, and block height, and that
different factors were weighted in different phases of
the game (Matsui et al., 2011). Another study has re-
ported measurements of the time required for block-
icSPORTS 2025 - 13th International Conference on Sport Sciences Research and Technology Support
30
ing at different attack positions, and it showed that
reaction time is delayed for attacks from the left and
right due to the larger movement steps required (Ya-
mada et al., 2012).
A previous study on back-row attacks found that
about 90% of combination attacks included a back-
row attack (Yoshida et al., 2018). It was also noted
that the occurrence rate and scoring rate of back-row
attacks have increased, and that the increase in the
scoring rate of back-row attacks has also influenced
the scoring rate of other attacks (Yoshida et al., 2016;
Nakanishi and Ohkubo, 2021). Additionally, it was
reported that the choice of back-row attack position
depends on the position of the toss (Adin-Marian and
Marilena, 2014).
To analyze the movement of individual players,
for example, from a biomechanics perspective, there
is a research that analyzes the speed and jump time
during a spike, and the angle of the torso and arms at
each timing such as during the jump, attack, and land-
ing (Awang Irawan et al., 2023). Another research
compared spiking with one foot and both feet, ana-
lyzing their respective advantages in terms of center
of gravity velocity and horizontal speed (Huang et al.,
1999). Furthermore, the study examining the rela-
tionship between players’ physical characteristics and
performance revealed strong correlations, particularly
with height, muscle mass, and bone mass (Sanjayku-
mar et al., 2024). Machine learning has also been ap-
plied to analyze individual player contributions. For
example, one study used a Bayesian hierarchical lo-
gistic model to estimate data from the World Cham-
pionships (W. Fellingham, 2022).
As described above, previous studies have mainly
focused on collecting and analyzing data on a match-
by-match basis or examining methods for analyzing
individual player performance. However, detailed
analysis on a rally-by-rally basis using tracking data,
such as player movement and placement, is still un-
explored field. This study takes a different approach
from previous research by aiming to use tracking data
to predict attack outcomes and evaluate play on a
rally-by-rally basis.
3 METHODS
3.1 Datasets
In this section, we explain the dataset in this study,
preprocessing, and computing variables. We empha-
size that our dataset is the first publicly available vol-
leyball player location and event dataset for perfor-
mance analysis.
3.1.1 Videos
In this study, we selected and analyzed 13 match
videos uploaded to the YouTube channel “Volleyball
Watchdog”. We chose these videos because they were
all filmed with a fixed camera positioned behind the
end line, providing a relatively clear view of all six
players on each team. All videos had a frame rate
of 30 fps. The beginning and ending frames of se-
quences in which a serve, reception, set, and back-row
attack occurred were recorded in a spreadsheet. Based
on these records, 103 video clips were extracted using
the free software Aviutl.
3.1.2 Video Annotation
We performed automatic tracking using basketball-
SORT (Hu et al., 2024) on the split videos.
Basketball-SORT is an object detection approach spe-
cialized for tracking basketball plays, designed to re-
solve complex occlusion issues involving multiple ob-
jects by utilizing players’ trajectories and appearance
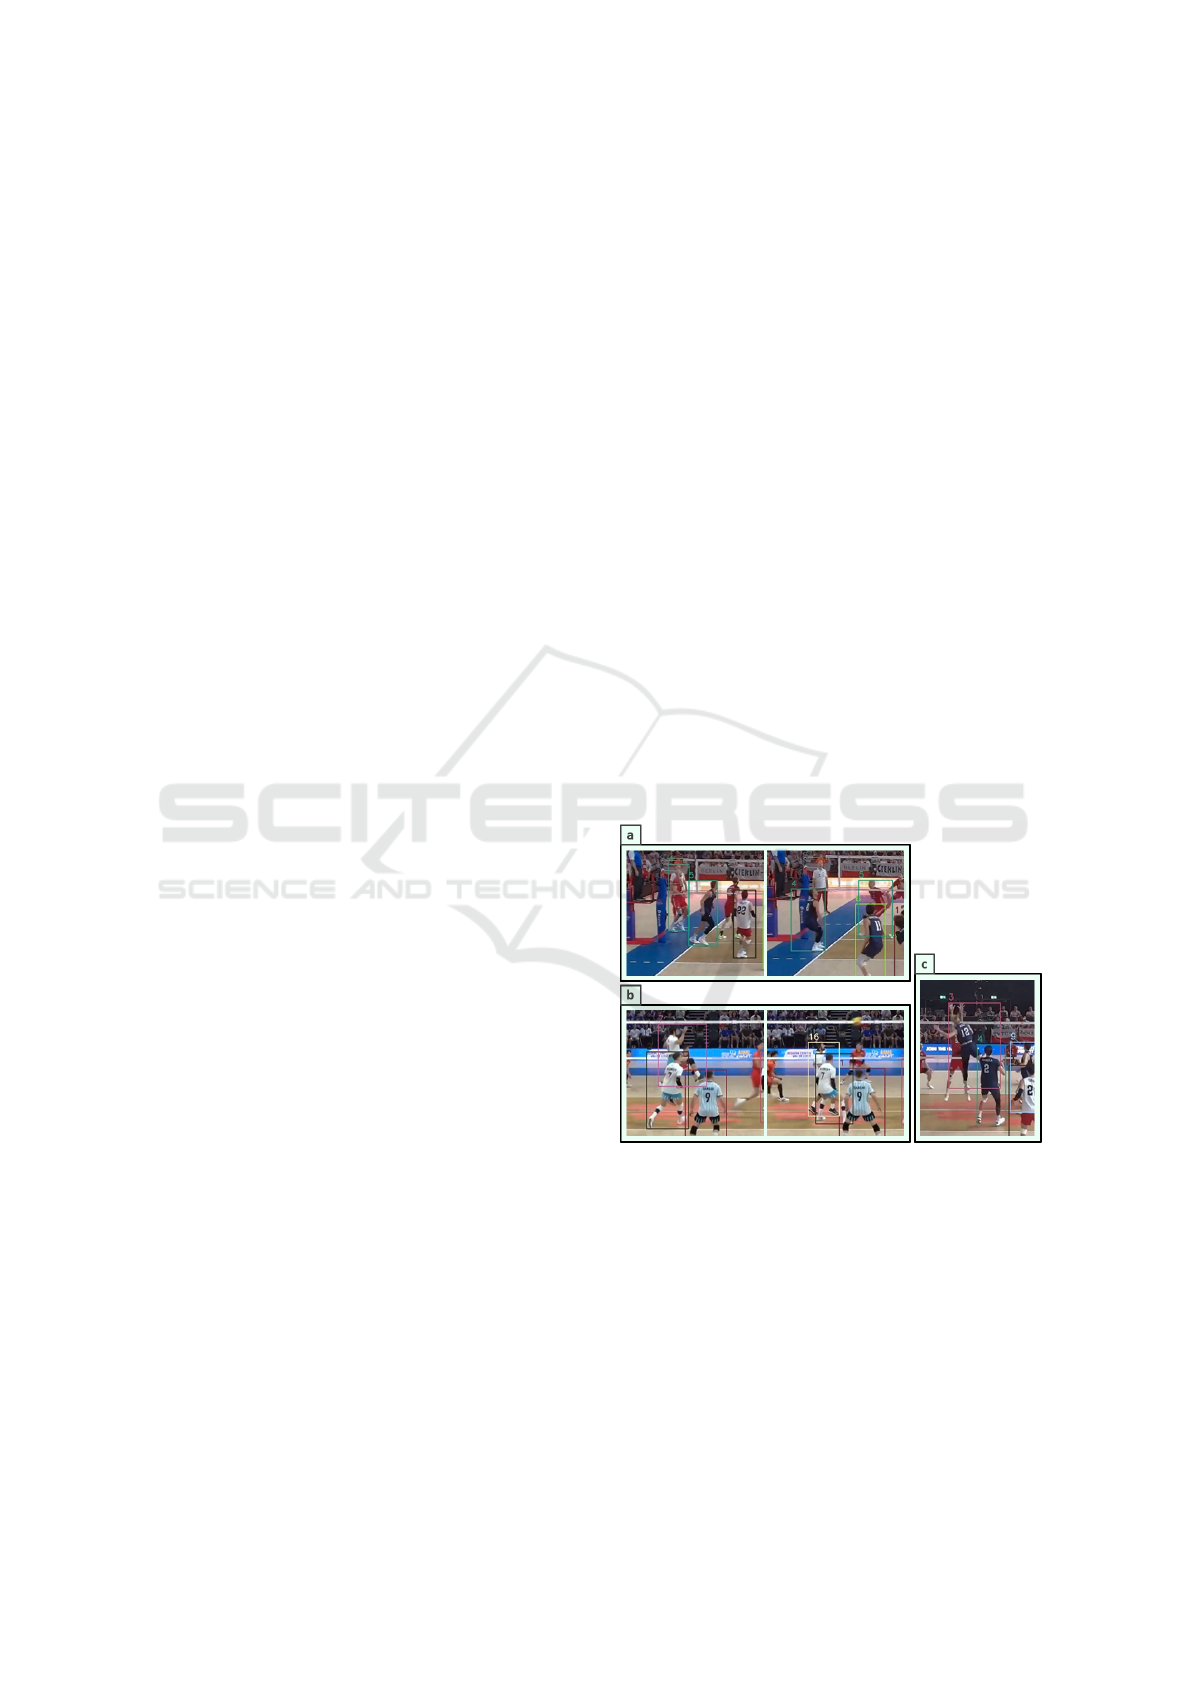
features. The tracking results contained errors such as
multiple IDs assigned to a single player, ID swaps be-
tween different players, and incorrectly sized bound-
ing boxes (Figure 2). We corrected these issues man-
ually using Labelbox, an online annotation software.
Figure 2: Examples of errors in tracking. (a) is an example
of the ID being swapped. (b) is an example of a player
with multiple IDs. (c) is an example of an incorrectly sized
bounding box.
3.1.3 Acquisition of Player Coordinates
Based on the corrected bounding box data, we applied
a homography transformation to obtain player coordi-
nates on a 9 m × 9 m court. We used the center of the
bottom edge of each bounding box as the reference
point for player coordinates. Additionally, during the
homography transformation, the coordinates of the
Play Evaluation Based on Predicting the Outcome of Back-Row Attacks in Volleyball
31
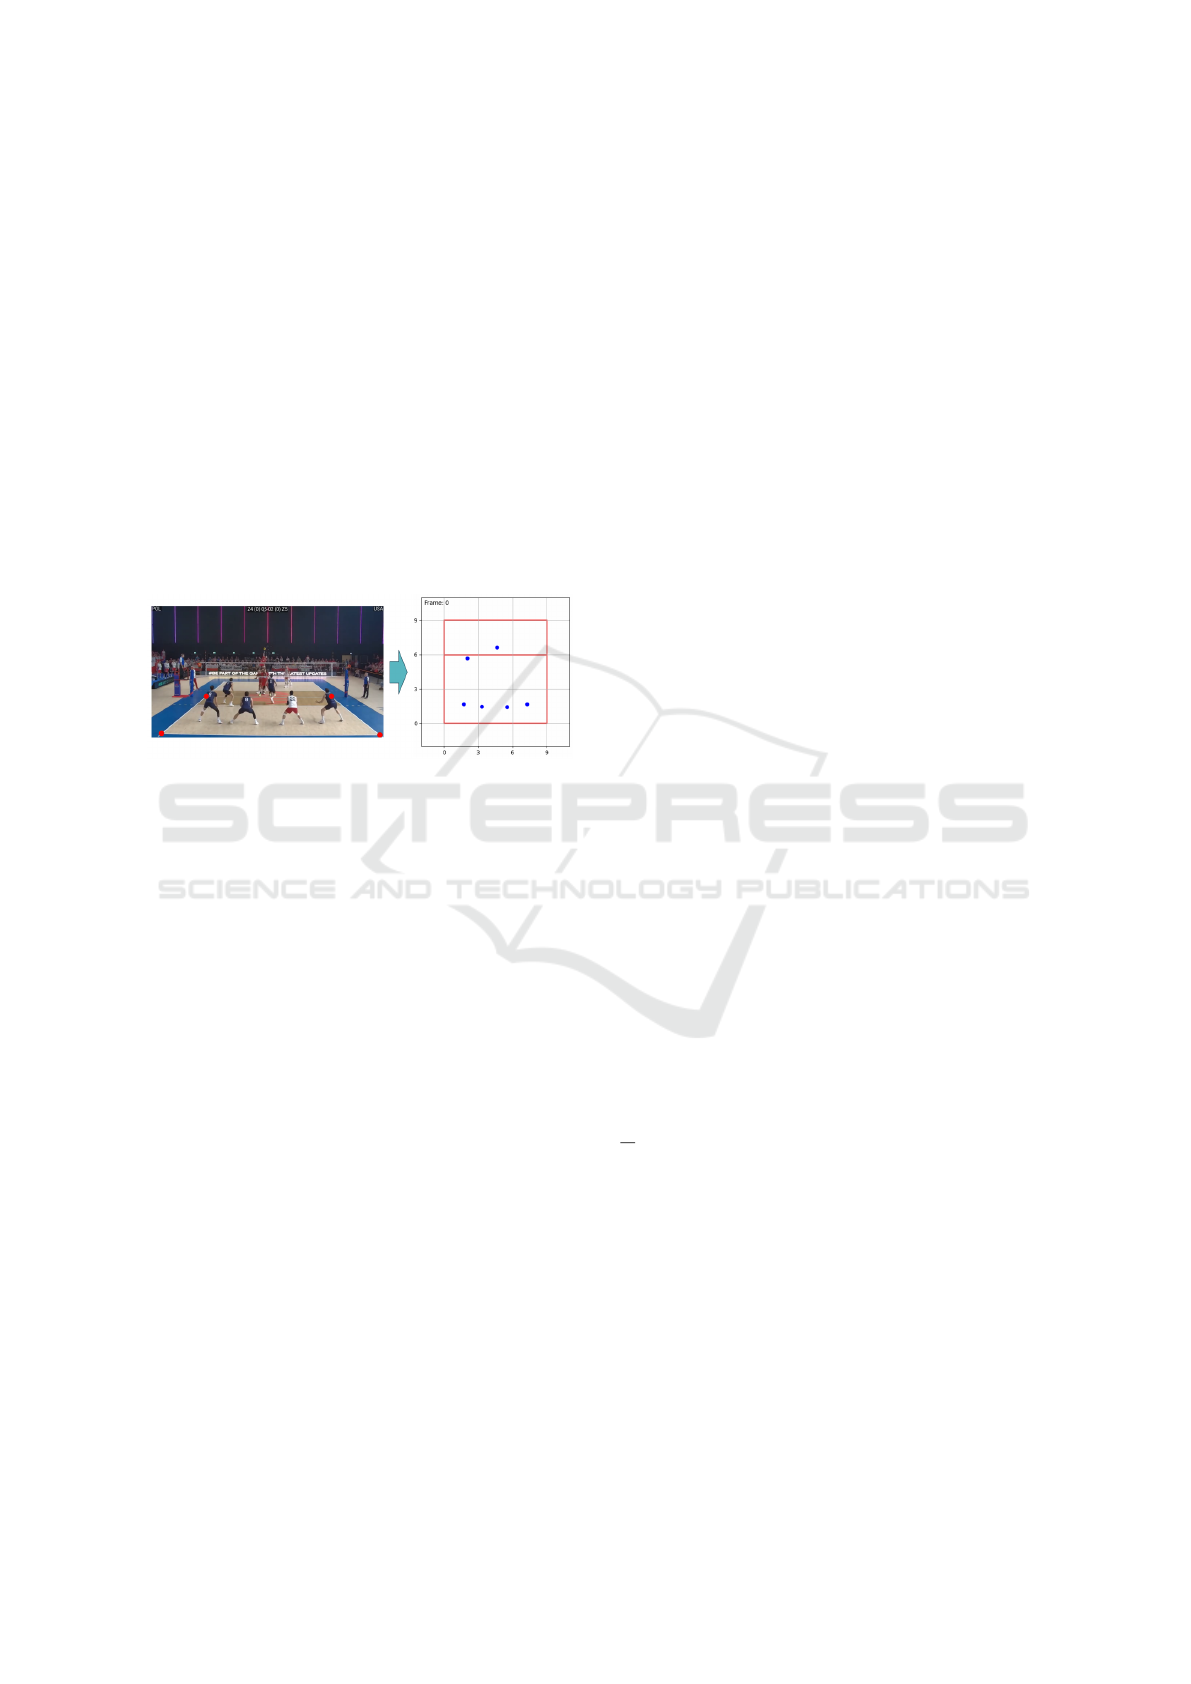
four corners of the court were manually recorded in
advance and used as reference points (Figure 3). The
transformed coordinate data had issues such as in-
terruptions in tracking data when players moved off-
screen and fluctuations in the y-coordinates due to
jumping. To address tracking interruptions, we ap-
plied linear interpolation using the last known coordi-
nates before a player exited the screen and the first de-
tected coordinates upon their return. To correct fluc-
tuations in the y-coordinates, We checked frames im-
mediately before takeoff and after landing manually,
and performed linear interpolation using the recorded
coordinates at these points. After these corrections,
we smoothed the coordinate data to mitigate abrupt
velocity changes caused by manual annotation adjust-
ments. A moving average with a window width of 5
was applied for smoothing.
Figure 3: By performing a homography transformation
based on the four red points shown on the left, we obtained
the coordinates on the coat as shown on the right.
3.1.4 Event Annotation
For each of the videos, we recorded the frame num-
ber at which each event occurred, the ID of the player
who executed it, the time elapsed between events, the
attacker’s jump time, and the attack result. The three
types of events considered here are receive, toss, and
attack. The player ID was assigned based on the cre-
ated coordinate data.
3.2 Proposed Method: V2SEP
Here we show a quantitative framework to evaluate
the impact of individual volleyball plays on rally out-
comes.
3.2.1 Preprocessing
In this study, we computed evaluation indices based
on the VDEP concept proposed in previous study
(Toda et al., 2022). As a preliminary step, we cre-
ated a dataset for predicting attack outcomes by calcu-
lating the movement speed and direction of all play-
ers at the moment of an event, using their position
data and event information. To compute these val-
ues, we first extracted the five frames before and after
the event frame. The movement speed was calculated
as the average speed over these ten frames, while the
movement direction was determined by calculating
the direction from the player’s coordinates in the first
frame to those in the last frame. For the five players
other than the one performing the event, we calculated
both their distance from the event-performing player
and the direction to that player, then sorted them
by distance. Finally, for each event, we compiled
the event-performing player’s coordinates, movement
speed, and direction at the time of the event, as well
as the other players’ coordinates, movement speed,
direction, and their distance and direction relative to
the event-performing player. We stored the compiled
data in a CSV file.
3.2.2 V2SEP
We propose V2SEP to evaluate volleyball play.
Specifically, we apply the VDEP methodology to vol-
leyball and modify it to evaluate the process of attack.
In this study, we extracted the scenes from the op-
ponent’s serve, receive, toss, and attack. Hereafter,
the game states in which the attack outcome is pre-
dicted are called the receive, toss, and attack states,
respectively, and are given by the states s
i
= [s
receive
,
s
toss
, s
attack
]. We define the future probability of scor-
ing P
point
(s
i
) and the probability of an opponent block
by two or more players P
blocked
(s
i
) (hereafter called
the block probability) in each state. The attacking
team is preferred to act so that P
point
(s
i
) is higher
or P
blocked
(s
i
) is lower. Therefore, we propose the
following formula to calculate the evaluated value of
play.
V
V 2SEP
(s
i
) = P
point
(s
i
) − C ∗ P
blocked
(s
i
) (1)
C is a parameter that weights the scoring probability
and blocking probability. In the collected data, there
were 41 videos where two or more players blocked
during an attack, and in 15 of those cases, the at-
taching team lost the point due to a block. Thus,
15
41
≃ 0.366, so we set C = 0.366.
3.2.3 Probability Prediction Method
For the classifier to predict probabilities, we used eX-
treme Gradient Boosting (XGBoost), following pre-
vious studies. Gradient boosting methods are known
to perform well on a variety of learning problems in-
volving heterogeneous features, noisy data, and com-
plex dependencies. For the features used to predict
the probability in a state, we assumed that not only the
features in that state but also all the previous features
were used. Specifically, the features of the receiving
and tossing states were used to predict the probability
icSPORTS 2025 - 13th International Conference on Sport Sciences Research and Technology Support
32
of the tossing state, and the features of the receiving,
tossing, and attacking states were used to predict the
probability of the attacking state. For the attack re-
sult, we defined point and blocked as labels to record
whether a point was scored as a result of a back-row
attack and whether two or more opponents jumped for
a block against the attack, respectively. If the attack
results in a score, point = 1 is assigned, and if the at-
tack fails to score, point = 0 is assigned. Similarly,
blocked = 1 was assigned when two or more oppo-
nents jumped for a block. In the data created for this
study, out of 103 videos, there were 52 videos with
point = 1 and 51 videos with point = 0. Addition-
ally, 42 videos had blocked = 1, and 61 videos had
blocked = 0.
3.2.4 Validation
Since the method proposed in this study assumes that
the predictions made by the classifier are valid, it is
necessary to first verify that the classifier is making
valid predictions. In addition, by visualizing the de-
gree of influence in the prediction, it will be possible
to assess which features have the most influence and
to what extent. Therefore, we calculated F1 scores
and SHAP values for the score and block predictions
in each state, respectively. Next, two verifications are
performed to determine whether the calculated eval-
uation values work as expected. In the first verifica-
tion, we divided the data into four groups based on
the result labels point and blocked, and calculated the
average evaluation value for each group. In the sec-
ond verification, we compared the calculated evalua-
tion values with the actual footage to qualitatively de-
termine whether the evaluation values are legitimate.
Scenes that are prone to receiving unjustified evalua-
tion values are then investigated to identify areas for
improvement in the proposed method.
4 EXPERIMENTS
4.1 Validation of the Models
The proposed method (V2SEP) in this study assumes
that the attack result predictions are valid. Therefore,
we first calculated the F1 score for both the score and
block predictions. The results are shown in Table 1.
In both predictions, the F1 score gradually increased,
which was consistent with our intuition that the at-
tack result becomes more predictable as the game pro-
gresses.
Next, feature importance was visualized and qual-
itatively analyzed by calculating SHAP values. SHAP
Table 1: Evaluation Results for point and blocked.
receive toss attack
point 0.501 0.531 0.553
blocked 0.493 0.633 0.647
values quantify how each feature contributes to a
paticular prediction, showing how each variable in-
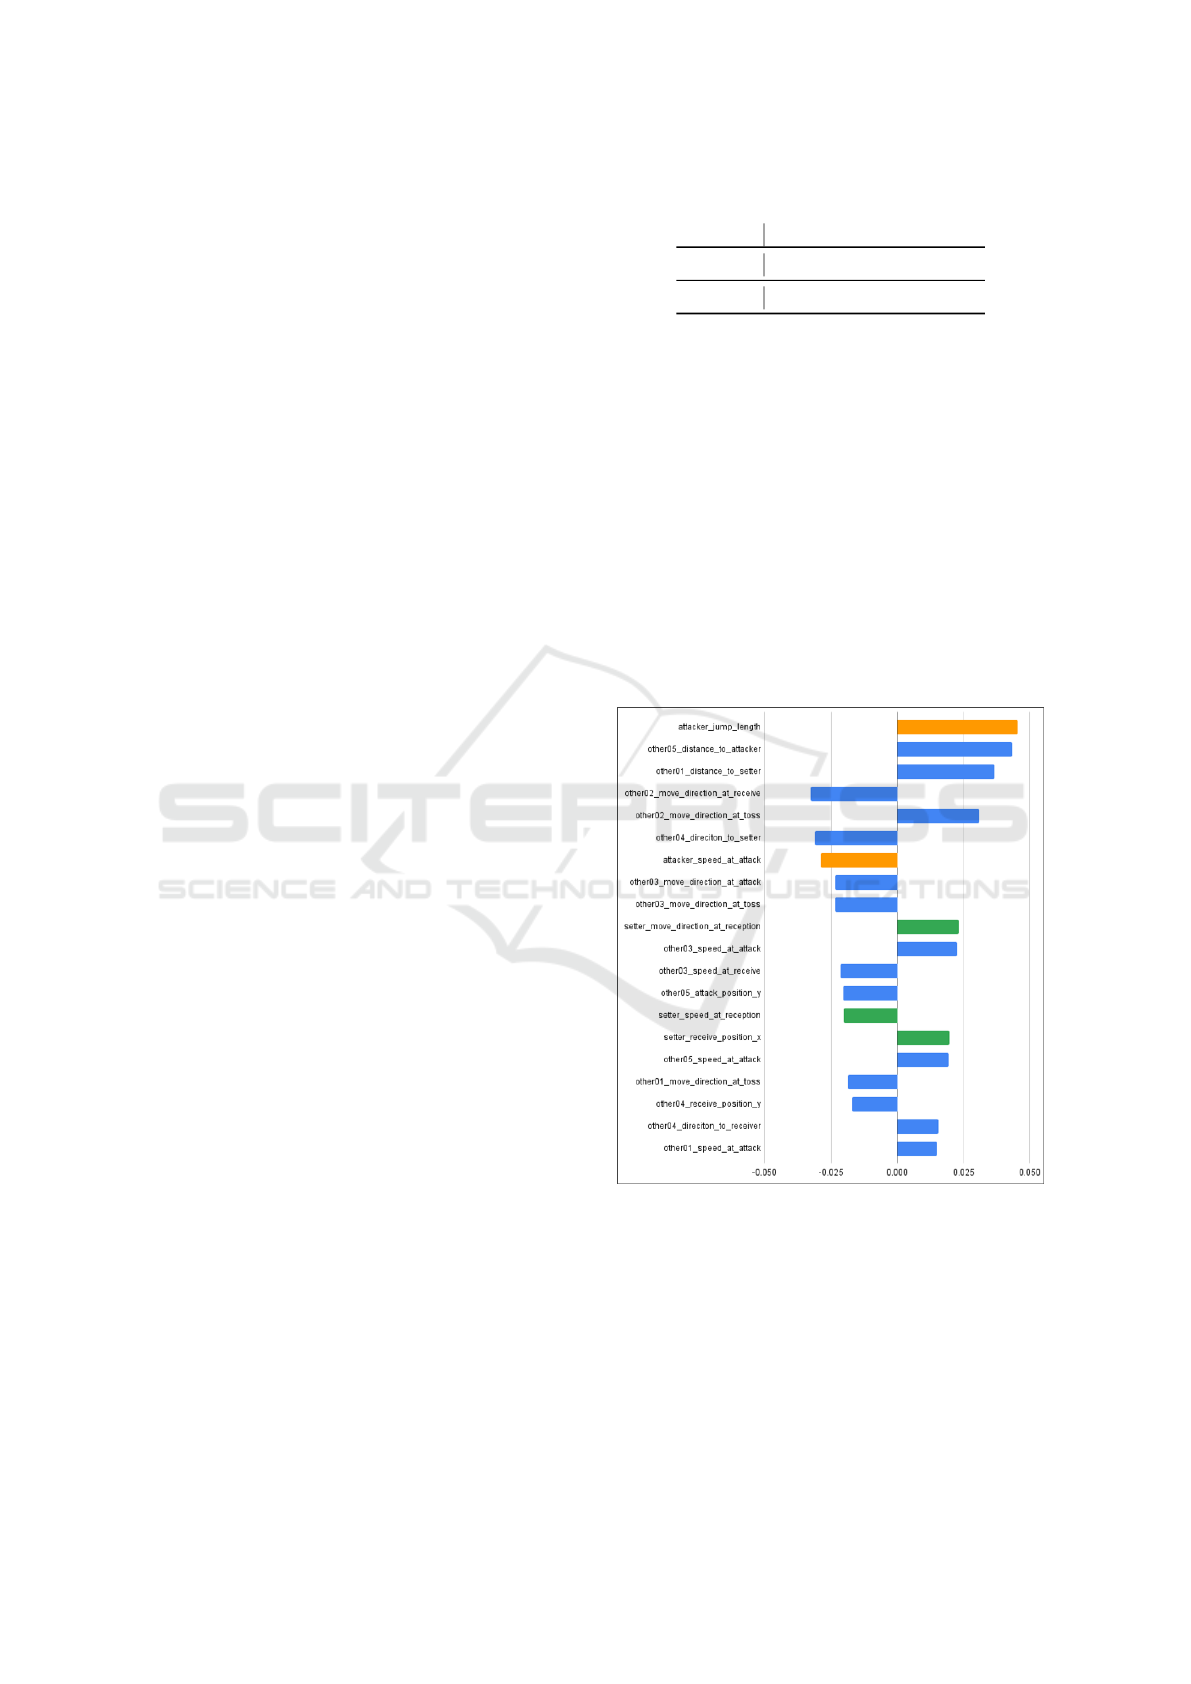
fluences the model’s output. Figure 4 and Figure 5
shows the top-ranked feature importance in the at-
tack state. For the estimation of scoring probability
in the attack state, the features of players who per-
formed back-row attacks tended to have higher ab-
solute SHAP values than those of players who made
tosses. On the other hand, for the estimation of block
probability, the features of players who made tosses
tended to have larger absolute SHAP values. In both
predictions for the attack state, 14 or 15 of the top 20
features with the highest absolute importance values
belonged to players who were not directly involved
in the event, confirming that the movements of such
players have a significant impact on the prediction.
Figure 4: Top 20 absolute SHAP values of features in attack
events for score predictions. Orange indicates the feature
values for the player who attacked, green for the player who
tossed, yellow for the player who received, and blue for the
other players.
4.2 Validation of Evaluation Values
We conducted two validations to determine whether
the evaluation values calculated based on V2SEP
functioned as expected. First, we divided the data
Play Evaluation Based on Predicting the Outcome of Back-Row Attacks in Volleyball
33
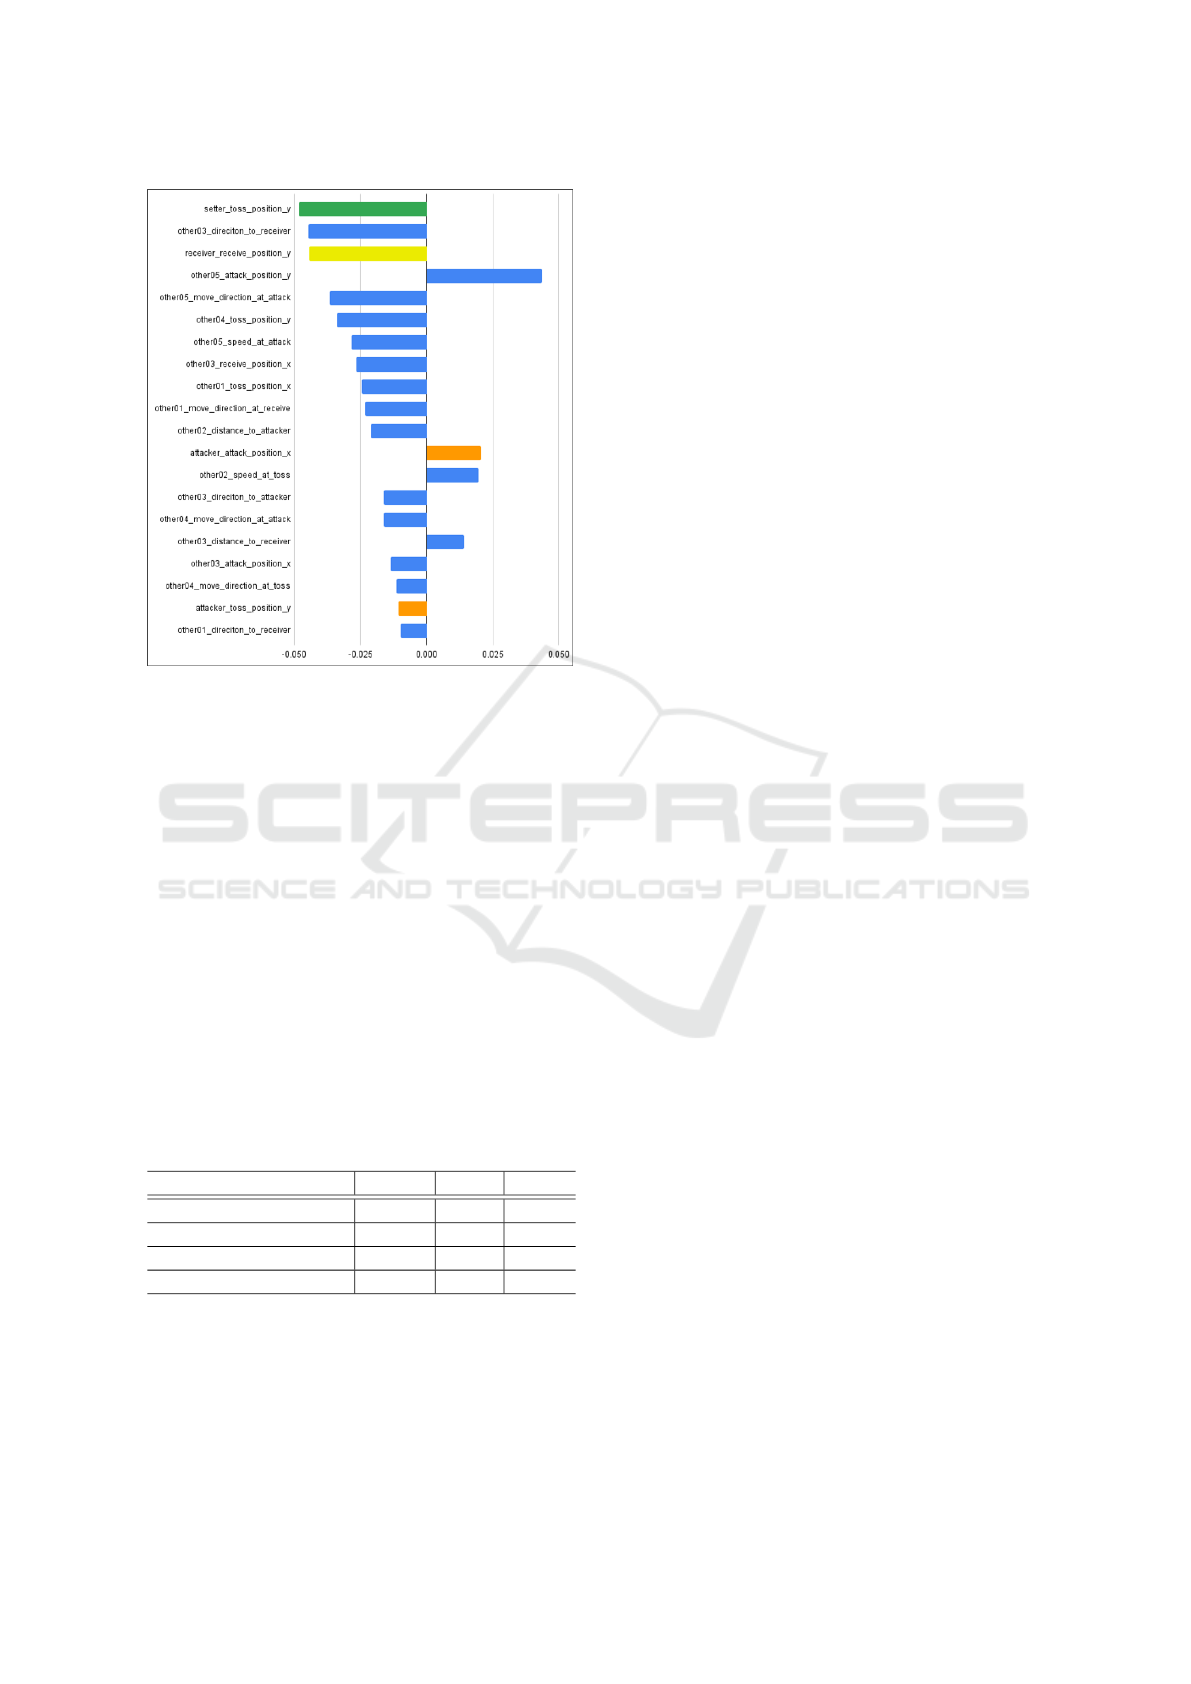
Figure 5: Top 20 absolute SHAP values of features in attack
events for block predictions. Orange indicates the feature
values for the player who attacked, green for the player who
tossed, yellow for the player who received, and blue for the
other players.
into four groups based on the attack result labels,
point and blocked, and calculated the average eval-
uation value for each group. The results are shown
in Table 2. When comparing the evaluation values in
the receiving state, although the group with point =
1, blocked = 0 had a lower value, there was no signifi-
cant difference between the groups. However, the dif-
ferences became more pronounced as the game pro-
gressed toward the attack state. Furthermore, when
comparing the two groups where point = 1, the group
with blocked = 0 had a higher average evaluation
value. Similarly, for the two groups where point = 0,
the group with blocked = 0 also had a higher average
evaluation value.
Table 2: The average evaluation value for each group.
receive toss attack
point = 1, blocked = 0 0.332 0.352 0.362
point = 1, blocked = 1 0.357 0.307 0.333
point = 0, blocked = 0 0.365 0.317 0.316
point = 0, blocked = 1 0.352 0.305 0.281
Next, we visually and qualitatively analyzed
whether each video had a valid evaluation value.
Specifically, we compared the calculated evaluation
values with the actual footage, selected scenes where
the evaluation was clearly justified or unjustified,
and examined trends in scenes that were particularly
prone to unjustified evaluation values. For this analy-
sis, we used the following criteria: whether there was
any disruption in movement during receiving or toss-
ing, whether the setter (who tosses the ball directly
leading to an attack) was forced to move due to a dis-
rupted receive, and how many players participated in
the attack.
First, an example of a scene that received a cor-
rectly high evaluation is shown in Figure 6. In this
case, the evaluation values were 0.449 for the receiv-
ing state, 0.517 for the tossing state, and 0.579 for
the attacking state. When checking the frames be-
fore and after the tossing state, the movement of the
player making the toss appeared relatively smooth,
with three front-row players and one back-row player
participating in the attack. Furthermore, from the
tossing state to the attacking state, the opponent’s
blockers were drawn toward the two front-row play-
ers, leaving the back-row attacker unblocked.
Figure 7 shows an example of a scene that re-
ceived a correctly low evaluation. In this case, the
evaluation values were 0.483 for the receiving state,
0.086 for the tossing state, and -0.025 for the attack-
ing state. While there was no significant disruption in
movement during the receiving state, the unsuccessful
receive forced the tosser to make a toss while moving
backward from the edge of the court. The toss then
went to a back-row player, but due to its predictable
trajectory and the delay between the toss and the at-
tack, the attacker was blocked by three opponents.
Figure 8 shows an example of a scene with an un-
justified evaluation. In this situation, the 6th player
was originally supposed to make the toss, but due to a
disrupted receive, another player was forced to do so.
Additionally, tossing from a position far from the net
limits the attack patterns and increases the likelihood
of a block, meaning this scene should have received a
lower evaluation.
5 DISCUSSIONS
This section discusses the validity of the prediction
model and the proposed method (V2SEP) based on
the analysis results from the previous section. Table 1
shows that the F1 score tends to improve as the game
progresses and the number of features used for predic-
tion increases. In particular, the F1 scores for predic-
tions in the attack state were 0.553 for score predic-
tion and 0.647 for block prediction. Considering the
difficulty of predicting outcomes in team sports, these
can be regarded as relatively accurate predictions.
The analysis of SHAP values in Figure 4 and
icSPORTS 2025 - 13th International Conference on Sport Sciences Research and Technology Support
34
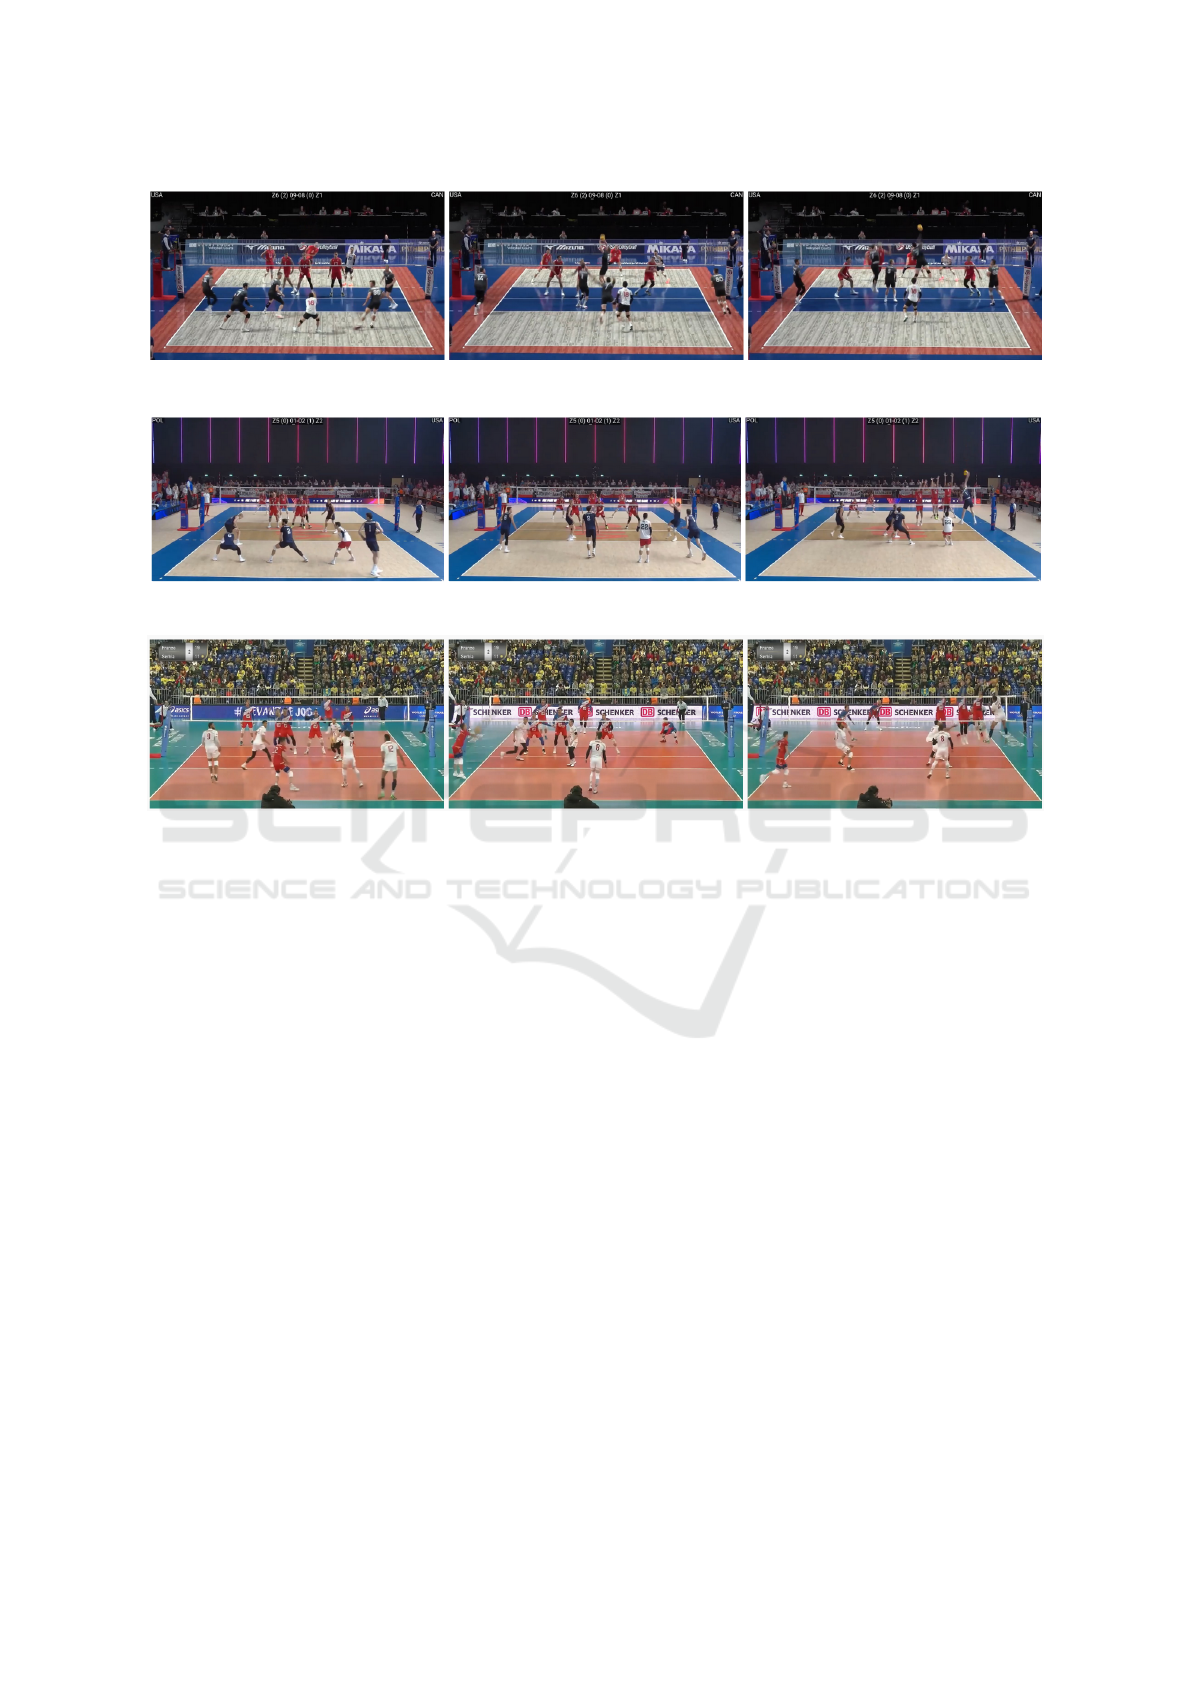
Figure 6: Examples of scenes with correctly high ratings. From left to right: receiving state, tossing state, and attacking state.
Figure 7: Examples of scenes with correctly low ratings. From left to right: receiving state, tossing state, and attacking state.
Figure 8: Examples of scenes with incorrect evaluation values. From left to right: receiving state, tossing state, and attacking
state.
Figure 5 suggests that the attacker’s movement has
a greater influence on whether a point is scored,
while the setter’s movement has a greater influence
on whether the opponent blocks. Furthermore, among
the top 20 features ranked by SHAP value, informa-
tion from players not directly involved in the event
also impacted the prediction. This indicates that the
proposed method can incorporate the movements of
players who are not directly involved in the event into
its evaluation. However, the SHAP values for features
related to players not directly involved in the event
tended to be larger than those for features related to
setters and attackers, suggesting that the influence of
non-involved players may be overly emphasized.
Table 2 also confirms that as the game progresses,
differences emerge in the average evaluation values
across groups. This aligns with the analysis of Ta-
ble 1, which indicated that prediction accuracy im-
proves as the game progresses. In the attack state,
when comparing groups with the same point value,
those with blocked = 0 tend to have a higher average
evaluation value. Similarly, when comparing groups
with the same blocked value, those with point = 1
tend to have a higher average evaluation value. These
findings suggest that the evaluation values follow the
expected trend to some extent.
In the qualitative evaluation based on matching
with actual video footage, higher evaluation values
were often assigned to scenes in which the player suc-
cessfully guided the opponent’s block (Figure 6) and
scenes where multiple players were involved in the
attack (Figure 7), confirming a certain level of valid-
ity. On the other hand, there were cases where evalua-
tion values were not assigned correctly. For example,
higher-than-expected evaluation values were given in
scenes where the number of players able to participate
in the attack decreased due to a loss of balance after
receiving (see figure) and in scenes where the setter
was unable to make the toss (Figure 8). The former
issue is likely due to the fact that changes in player co-
ordinates were small for both stable and unbalanced
receptions, making it difficult for the model to distin-
guish between them. Additionally, since there were
only a limited number of scenes where a player lost
balance during receiving, the dataset appears insuffi-
cient for considering the impact of reception stabil-
ity on attack outcomes. The latter issue likely arises
from the fact that the dataset used in this study does
Play Evaluation Based on Predicting the Outcome of Back-Row Attacks in Volleyball
35

not distinguish players by specific positions, such as
front/rear or left/center/right, and does not explicitly
identify the setter’s movements.
Aside from these issues, this study limited the
target scenes and created the dataset by extracting
footage from matches of multiple teams, making
team-by-team comparisons difficult. To enable such
comparisons, it would be necessary to construct a
dataset by focusing on specific teams and selecting
target scenes accordingly. Furthermore, since this
study focused solely on back-row attacks against op-
ponent serves, its general applicability remains undis-
cussed. To confirm whether the proposed method can
be applied to other situations, its validity must be ver-
ified by expanding the range of target scenes.
6 CONCLUSIONS
In this study, we evaluated plays in each state based
on a prediction model for the outcomes of back-row
attacks in volleyball. To assess play performance,
we proposed V2SEP, which utilizes the probabil-
ity of scoring—estimated based on features in each
state—as well as block prediction. We then veri-
fied the validity of the calculated evaluation values.
Given that volleyball is a team sport where outcome
prediction is inherently difficult, the prediction model
was found to be reasonably accurate. Although some
scenes were still not evaluated appropriately, the cal-
culated evaluation values demonstrated a certain de-
gree of validity and generally followed the expected
trends.
Future challenges include distinguishing players
by specific positions when inputting features for pre-
diction and verifying the general applicability of the
proposed method by extending the target scene to
cover the period from the opponent’s serve until
the ball drops. Additionally, to generate prediction
data more efficiently, it is necessary to develop a
volleyball-specific tracking method or automate the
modification of tracking data.
REFERENCES
Adin-Marian, C. and Marilena, C. (2014). Preferential and
performance-related lateralization in volleyball as far
as attack hit execution is concerned. Procedia - Social
and Behavioral Sciences, 127:58–62.
Awang Irawan, F., Widya Permana, D. F., Nurrahmad, L.,
Anam, K., Hadi, Romadhoni, S., and Syarafina Ghas-
sani, D. (2023). A motion analysis of volleyball open
spike: Kinematics and performance. International
Journal of Human Movement and Sports Sciences,
11(1):134–142.
Decroos, T., Haaren, J. V., Bransen, L., and Davis, J.
(2019). Actions speak louder than goals: Valuing
player actions in soccer. In Proceedings of the 25th
ACM SIGKDD International Conference on Knowl-
edge Discovery & Data Mining, pages 1851–1861.
Ding, N., Takeda, K., Jin, W., Bei, Y., and Fujii, K.
(2024). Estimation of control area in badminton dou-
bles with pose information from top and back view
drone videos. Multimedia Tools and Applications,
83(8):24777–24793.
Fujii, K. (2025). Machine Learning in Sports: Open Ap-
proach for Next Play Analytics. Springer.
Ge, Y. and Song, N. (2024). Exploring the relationship be-
tween key factors and victory and defeat in volleyball
matches using bayesian network modeling. Journal of
Electrical Systems, 20(6):2241–2250.
Hashihara, Y., Yoshida, Y., and Yoshida, M. (2009). The
playing system of international-class men’s volleyball
teams. Journal of volleyball sciences, 11(1):12–18.
Hu, Q., Scott, A., Yeung, C., and Fujii, K. (2024).
Basketball-sort: An association method for complex
multi-object occlusion problems in basketball multi-
object tracking. Multimedia Tools and Applications,
83(38):86281–86297.
Huang, C., Liu, G.-C., and Sheu, T.-Y. (1999). Kinematic
analysis of the volleyball back row jump spike. 17
International Symposium on Biomechanics in Sports,
pages 49–52.
Lalwani, A., Saraiya, A., Singh, A., Jain, A., and Dash, T.
(2022). Machine learning in sports: A case study on
using explainable models for predicting outcomes of
volleyball matches. In Proceedings of the 2nd Inter-
national Conference on Sports Engineering.
Matsui, T., Yajima, T., and Miyakozawa, T. (2011). The
composition for the accomplishment process of block-
ing action for producing effective it in volleyball
game: With focus on serve phase, rally phase and at-
tack tempos. Journal of volleyball sciences, 13(1):30–
37.
Minowa, K., Imamaru, K., and Matsumoto, Y. (2016). Team
performance evaluation and outcome of the game by
the first transition in volleyball games. Journal of vol-
leyball sciences, 18(1):19–26.
Nakanishi, Y. and Ohkubo, S. (2021). Research on the at-
tack tactics in volleyball. Journal of volleyball sci-
ences, 23(1):31–38.
Sanjaykumar, S., Natarajan, S., Yoga Lakshmi, P.,
Kalmykova, Y., Lobo, o., Pavlovic, R., and Setiawan,
E. (2024). Machine learning analysis for predicting
performance in female volleyball players in india: Im-
plications for talent identification and player develop-
ment strategies. Journal of Human Sport and Exer-
cise, 20(1):207–215.
Scott, A., Uchida, I., Ding, N., Umemoto, R., Bunker, R.,
Kobayashi, R., Koyama, T., Onishi, M., Kameda, Y.,
and Fujii, K. (2024). Teamtrack: A dataset for multi-
sport multi-object tracking in full-pitch videos. In
icSPORTS 2025 - 13th International Conference on Sport Sciences Research and Technology Support
36

Proceedings of the IEEE/CVF Conference on Com-
puter Vision and Pattern Recognition, pages 3357–
3366.
Somers, V., Joos, V., Cioppa, A., Giancola, S.,
Ghasemzadeh, S. A., Magera, F., Standaert, B., Man-
sourian, A. M., Zhou, X., Kasaei, S., et al. (2024).
Soccernet game state reconstruction: End-to-end ath-
lete tracking and identification on a minimap. In Pro-
ceedings of the IEEE/CVF Conference on Computer
Vision and Pattern Recognition, pages 3293–3305.
Toda, K., Teranishi, M., Kushiro, K., and Fujii, K. (2022).
Evaluation of soccer team defense based on prediction
models of ball recovery and being attacked: A pilot
study. In Published in PLOS ONE.
Umemoto, R., Tsutsui, K., and Fujii, K. (2022). Location
analysis of players in uefa euro 2020 and 2022 using
generalized valuation of defense by estimating proba-
bilities. arXiv preprint arXiv:2212.00021.
W. Fellingham, G. (2022). Evaluating the performance of
elite level volleyball players. Journal of Quantitative
Analysis in Sports, 18(1):15–34.
Yamada, Y., Fukutomi, K., Kanda, S., Kaneko, M., Goto,
H., Ueda, Y., Eto, N., Takanashi, Y., Kawagishi, Y.,
and Ishigaki, H. (2012). Measurement of the time
structure of the block in volleyball: in the light of
the offence area and height. Journal of volleyball sci-
ences, 14(1):7–11.
Yonezawa, T. (2003). A study on the transition of the vol-
leyball game. Fukuoka University Review of Sports
and Health Science, 33(1):27–34.
Yonezawa, T. (2004). A study on the first transition of the
volleyball game : The performance which influenced
on the first transition. Fukuoka University Review of
Sports and Health Science, 35(1):1–9.
Yoshida, Y., Hamagushi, J., and Yamada, K. (2016). The
research in the ways they attack patterns on woman’s
volleyball. BULLETIN OF Sports Research Center,
HOSEI UNIVERSITY, 34:5–10.
Yoshida, Y., Hamagushi, J., and Yamada, K. (2018). The
research in the ways they attack patterns on men’s vol-
leyball. BULLETIN OF Sports Research Center, HO-
SEI UNIVERSITY, 38:93–99.
Play Evaluation Based on Predicting the Outcome of Back-Row Attacks in Volleyball
37
