
Analyzing Clustering Algorithms for Non-Linear Data to Evaluate
Robustness and Scalability
Jahnu Tanai Kumar Hindupur
a
, Navaneeth A D
b
, Hida Fathima P H
c
and Swati Sharma
d
Presidency School of Computer Science, Presidency University, Bengaluru, Karnataka, India
Keywords:
Clustering Algorithms, Non-Linear Data, Robustness, Scalability, Synthetic Datasets, DBSCAN, K-Means,
Hierarchical Clustering, Performance Evaluation.
Abstract:
Clustering algorithms are fundamental in unsupervised machine learning, but they face significant challenges
when applied to non-linear and complex data geometries. This study evaluates the performance of three
clustering methods—K-Means, DBSCAN, and Hierarchical Clustering—on a Synthetic Circle Dataset and a
Random Non-Synthetic Dataset. The Synthetic Circle Dataset, designed with concentric circular clusters, ex-
poses the limitations of K-Means, which assumes convex cluster boundaries. In contrast, DBSCAN effectively
detects non-linear clusters but is sensitive to parameter selection. Hierarchical Clustering demonstrates flex-
ibility and interpretability through dendrogram visualizations, though it becomes computationally expensive
for larger datasets. Quantitative metrics, including the Silhouette Score, Adjusted Rand Index, and Calinski-
Harabasz Index, are employed to assess cluster quality. Visual comparisons reinforce that K-Means performs
well on uniform, random data, while DBSCAN and Hierarchical Clustering excel at identifying complex
structures. However, challenges such as parameter tuning and scalability persist. This study highlights the
importance of selecting clustering techniques suited to data geometry and complexity. Future advancements,
including adaptive parameter tuning, hybrid clustering approaches, and kernel-based methods, are proposed
to address existing limitations. These findings provide a foundation for improving clustering algorithms to
handle real-world datasets with irregular patterns, noise, and diverse densities.
1 INTRODUCTION
Clustering remains a cornerstone technique in unsu-
pervised machine learning, allowing data points to be
grouped based on similarity without reliance on pre-
defined labels (Jain, 2010). Its widespread applica-
tion includes fields such as bioinformatics, image pro-
cessing, and social network analysis (Xu and Wunsch,
2005). Despite its success, clustering algorithms of-
ten struggle with datasets that exhibit complex struc-
tures, particularly those involving non-linear or over-
lapping boundaries.
The importance of synthetic datasets lies in their
ability to serve as controlled benchmarks for evaluat-
ing algorithmic performance (Dandekar et al., 2018).
In this study, the Synthetic Circle Dataset, character-
ized by concentric circular clusters, is used to explore
a
https://orcid.org/0009-0006-5531-3161
b
https://orcid.org/0009-0005-6624-095X
c
https://orcid.org/0009-0009-3691-2267
d
https://orcid.org/0000-0002-1926-3586
the limitations and capabilities of clustering methods.
Unlike conventional datasets with spherical or con-
vex clusters, the geometric challenges posed by cir-
cular data highlight the need for advanced techniques
to capture non-linear relationships effectively. Fur-
thermore, to assess algorithm generalizability, a ran-
domly generated non-synthetic dataset is introduced,
devoid of inherent cluster structure.
This paper evaluates the performance of cluster-
ing algorithms—K-Means, DBSCAN, and Hierarchi-
cal Clustering—on these datasets using a combina-
tion of visual and quantitative metrics. Approaches
like K-Means++, which improve initialization, and
DBSCAN, capable of detecting clusters of arbitrary
shapes, are explored to overcome existing algorithmic
shortcomings (Arthur and Vassilvitskii, 2006).
1.1 Motivation and Context
The challenges associated with clustering circular
datasets stem from the geometric assumptions embed-
770
Hindupur, J. T. K., A D, N., P H, H. F. and Sharma, S.
Analyzing Clustering Algorithms for Non-Linear Data to Evaluate Robustness and Scalability.
DOI: 10.5220/0013659600004664
Paper published under CC license (CC BY-NC-ND 4.0)
In Proceedings of the 3rd International Conference on Futuristic Technology (INCOFT 2025) - Volume 3, pages 770-780
ISBN: 978-989-758-763-4
Proceedings Copyright © 2025 by SCITEPRESS – Science and Technology Publications, Lda.
ded in traditional methods. For example, K-Means
assumes clusters are convex and spherical, which
leads to inaccurate segmentations in circular patterns
(Arthur and Vassilvitskii, 2006). On the other hand,
density-based algorithms like DBSCAN offer flexi-
bility but remain sensitive to parameter tuning (Ester
et al., 1996).
This study is motivated by:
• Understanding the clustering challenges posed by
circular datasets.
• Evaluating algorithm performance under struc-
tured (synthetic) and unstructured (random)
datasets.
• Providing insights into the geometric limitations
of widely used clustering algorithms (Madhu-
latha, 2012).
1.2 The Synthetic Circle Dataset
The Synthetic Circle Dataset consists of concentric
circular clusters in a two-dimensional space. Each
cluster represents a distinct group of points positioned
around a common origin but separated by radius and
density variations. This dataset serves as an ideal can-
didate for testing the robustness of clustering algo-
rithms under complex, non-linear structures.
A random non-synthetic dataset is also generated
to serve as a baseline. Unlike the structured circles,
the random dataset distributes points uniformly, en-
suring no inherent cluster pattern exists (Dandekar
et al., 2018).
1.3 Goals and Scope of the Study
This paper has the following primary objectives:
1. Evaluate clustering algorithms, including K-
Means, K-Means++, DBSCAN, and Hierarchical
Clustering, on the Synthetic Circle Dataset and a
randomly generated dataset.
2. Visualize clustering results to understand algo-
rithm behavior under non-linear and random sce-
narios.
3. Quantify performance using metrics such as the
Silhouette Score, Adjusted Rand Index, and
Davies-Bouldin Index (Rousseeuw, 1987).
4. Compare clustering results between structured
and unstructured datasets to identify strengths,
limitations, and areas for improvement.
This research contributes to a better understanding
of how clustering algorithms adapt to non-convex ge-
ometries and provides practical recommendations for
handling similar datasets in real-world applications.
2 THE DATASET: STRUCTURE
AND PREPARATION
2.1 Understanding the Synthetic Circle
Dataset
The Synthetic Circle Dataset is designed to challenge
clustering algorithms by introducing concentric circu-
lar clusters in a two-dimensional space. Each cluster
consists of points distributed uniformly around a cen-
ter with varying radii and densities. This geometric
complexity introduces significant challenges for clus-
tering methods, particularly those that assume convex
or spherical boundaries (Dandekar et al., 2018).
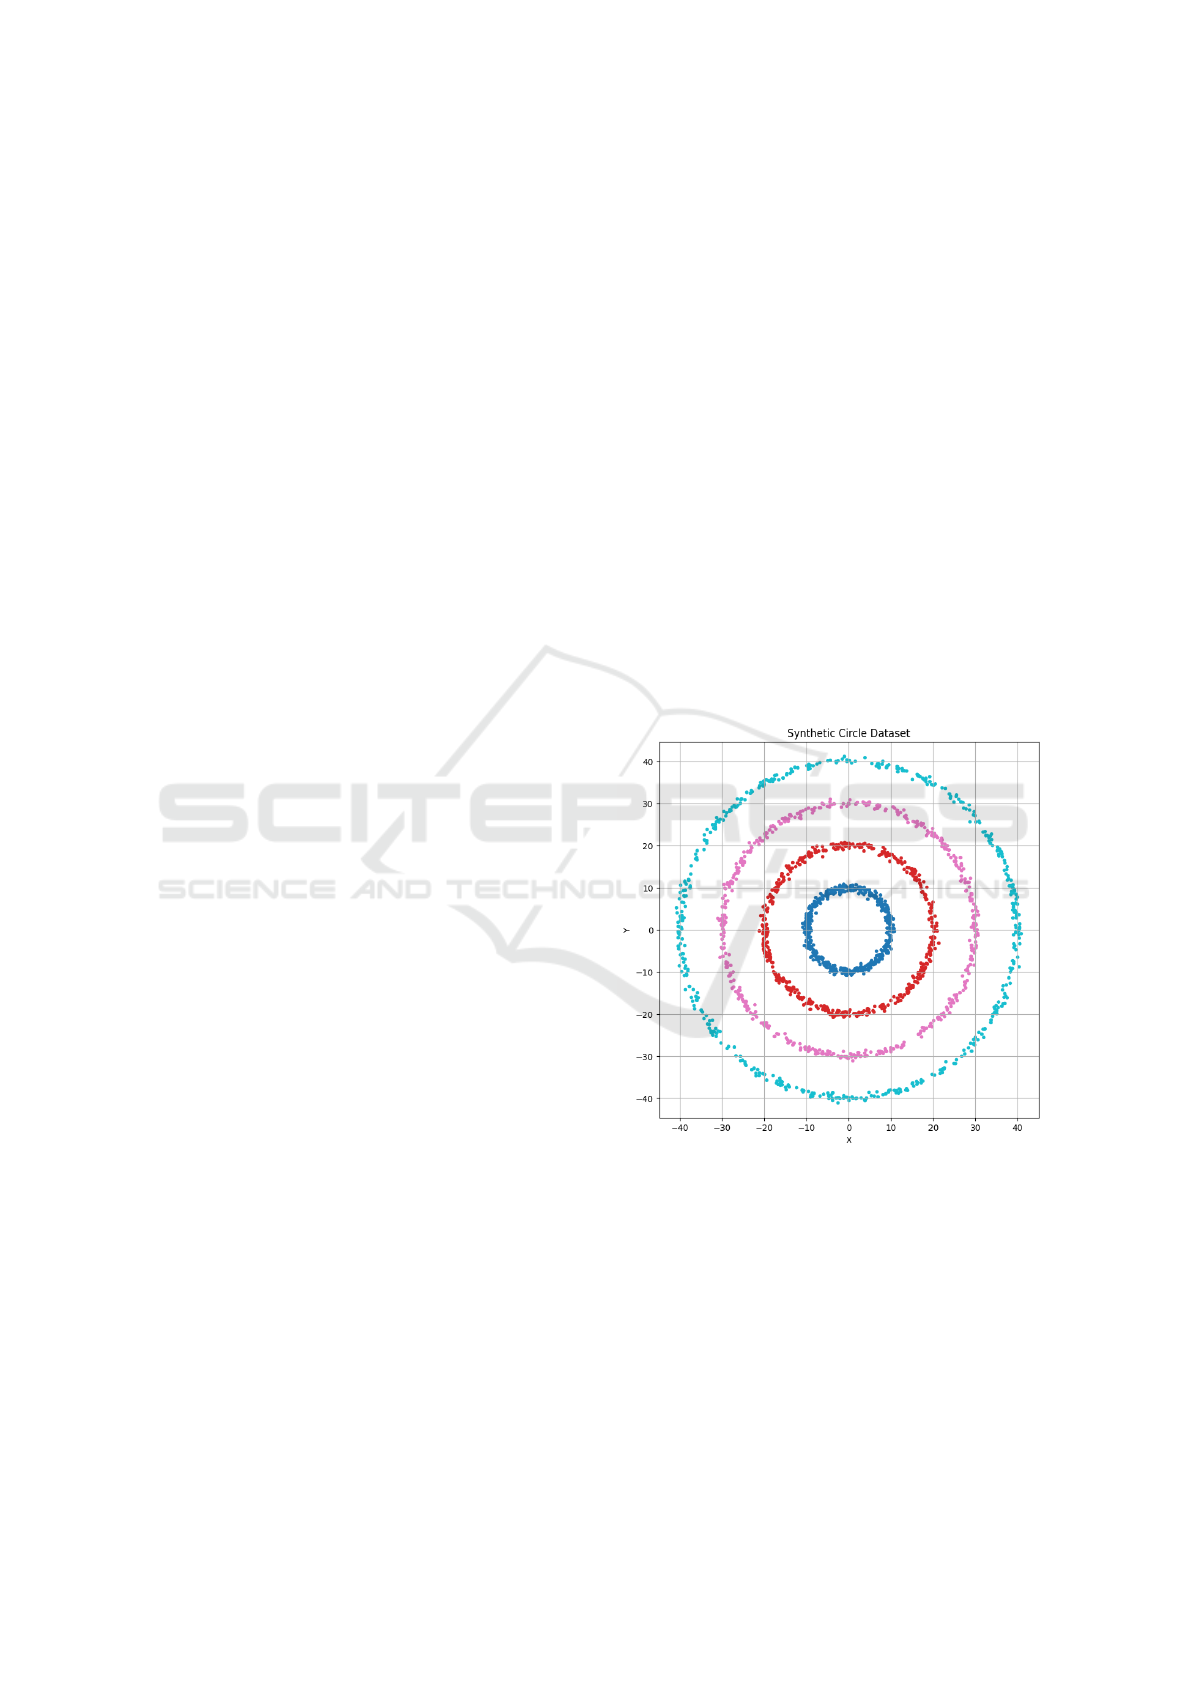
Figure 1 illustrates the structure of the Synthetic
Circle Dataset, showing the clear separation between
concentric clusters. Such visualization highlights the
need for clustering methods capable of capturing non-
linear structures.
Figure 1: Visualization of the Synthetic Circle Dataset with
concentric clusters.
2.2 Creating a Random Non-Synthetic
Dataset
To establish a baseline for comparison, a random non-
synthetic dataset is generated. This dataset serves
to evaluate the robustness of clustering algorithms
when confronted with unstructured and uniformly
distributed points.
Analyzing Clustering Algorithms for Non-Linear Data to Evaluate Robustness and Scalability
771
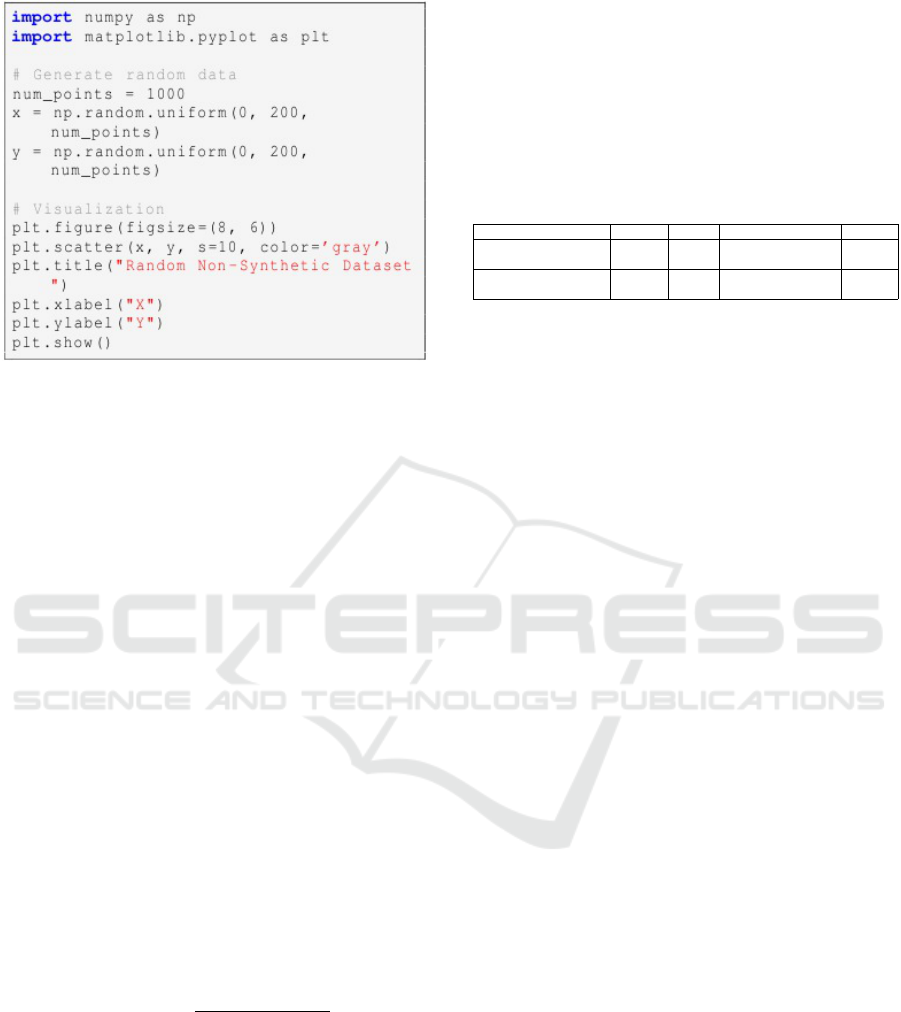
Figure 2: Code for generating random non-synthetic dataset
The dataset is constructed using the above pro-
cess and the resulting dataset is characterized by a
lack of distinct groupings, which tests the ability of
algorithms to avoid overfitting noise and to identify
inherent patterns where none exist.
2.3 Data Preprocessing
Before applying clustering algorithms, preprocessing
steps such as normalization and consistency checks
are performed to ensure data readiness. These steps,
which include scaling features to a range of [0, 1],
are critical for ensuring algorithm stability and con-
vergence (Pedregosa et al., 2011).
2.3.1 Feature Splitting and Normalization
The Synthetic Circle Dataset and the random dataset
contain two primary features: x- and y-coordinates.
These features are separated, and normalization is ap-
plied to scale values between 0 and 1, which ensures
that clustering algorithms operate effectively with-
out being biased by large-scale differences in feature
ranges.
The normalization formula used is:
x
normalized
=
x − min(x)
max(x) − min(x)
. (1)
2.3.2 Ensuring Consistency
Both datasets are inspected for any inconsistencies,
such as duplicate points or missing values, which
could compromise clustering results. Any duplicate
entries are removed, and missing values are imputed
using the mean of the respective features.
2.4 Statistical Properties of the Data
Statistical analysis provides insights into the char-
acteristics of both datasets, aiding in understanding
their inherent complexity. Table 1 summarizes key
statistics, including the mean, standard deviation, and
range of the features.
Table 1: Statistical properties of the Synthetic and Random
Datasets.
Dataset Feature Mean Standard Deviation Range
Synthetic Circle X 100.12 45.23 [0, 200]
Y 100.67 44.89 [0, 200]
Random Non-Synthetic X 99.86 57.34 [0, 200]
Y 99.42 56.78 [0, 200]
The Synthetic Circle Dataset displays a lower
standard deviation, reflecting the clustered nature of
its points, whereas the random dataset exhibits a
higher dispersion, indicating a lack of structure.
2.5 Summary and Observations
The preparation and analysis of the Synthetic Cir-
cle Dataset and the random non-synthetic dataset
lay the foundation for evaluating clustering methods.
The structured nature of the Synthetic Circle Dataset
challenges algorithms to identify concentric clusters,
while the random dataset serves to test their ability
to distinguish between noise and meaningful patterns.
These contrasting datasets provide a comprehensive
framework for assessing clustering algorithms under
varied conditions.
3 VISUAL EXPLORATION OF
THE DATA
Visual exploration is an essential preliminary step in
clustering analysis, as it allows researchers to identify
patterns visually and validate assumptions about the
data structure (Madhulatha, 2012).
3.1 Visualizing the Synthetic Dataset
3.1.1 Global View of Data Distribution
To better understand the characteristics of the Syn-
thetic Circle Dataset, a global visualization is per-
formed. The visualization highlights the concentric
structure of the clusters, which poses challenges for
traditional clustering algorithms.
The two-dimensional scatter plot of the Synthetic
Circle Dataset is shown in Figure 3. It demonstrates
the presence of well-separated, concentric clusters
INCOFT 2025 - International Conference on Futuristic Technology
772
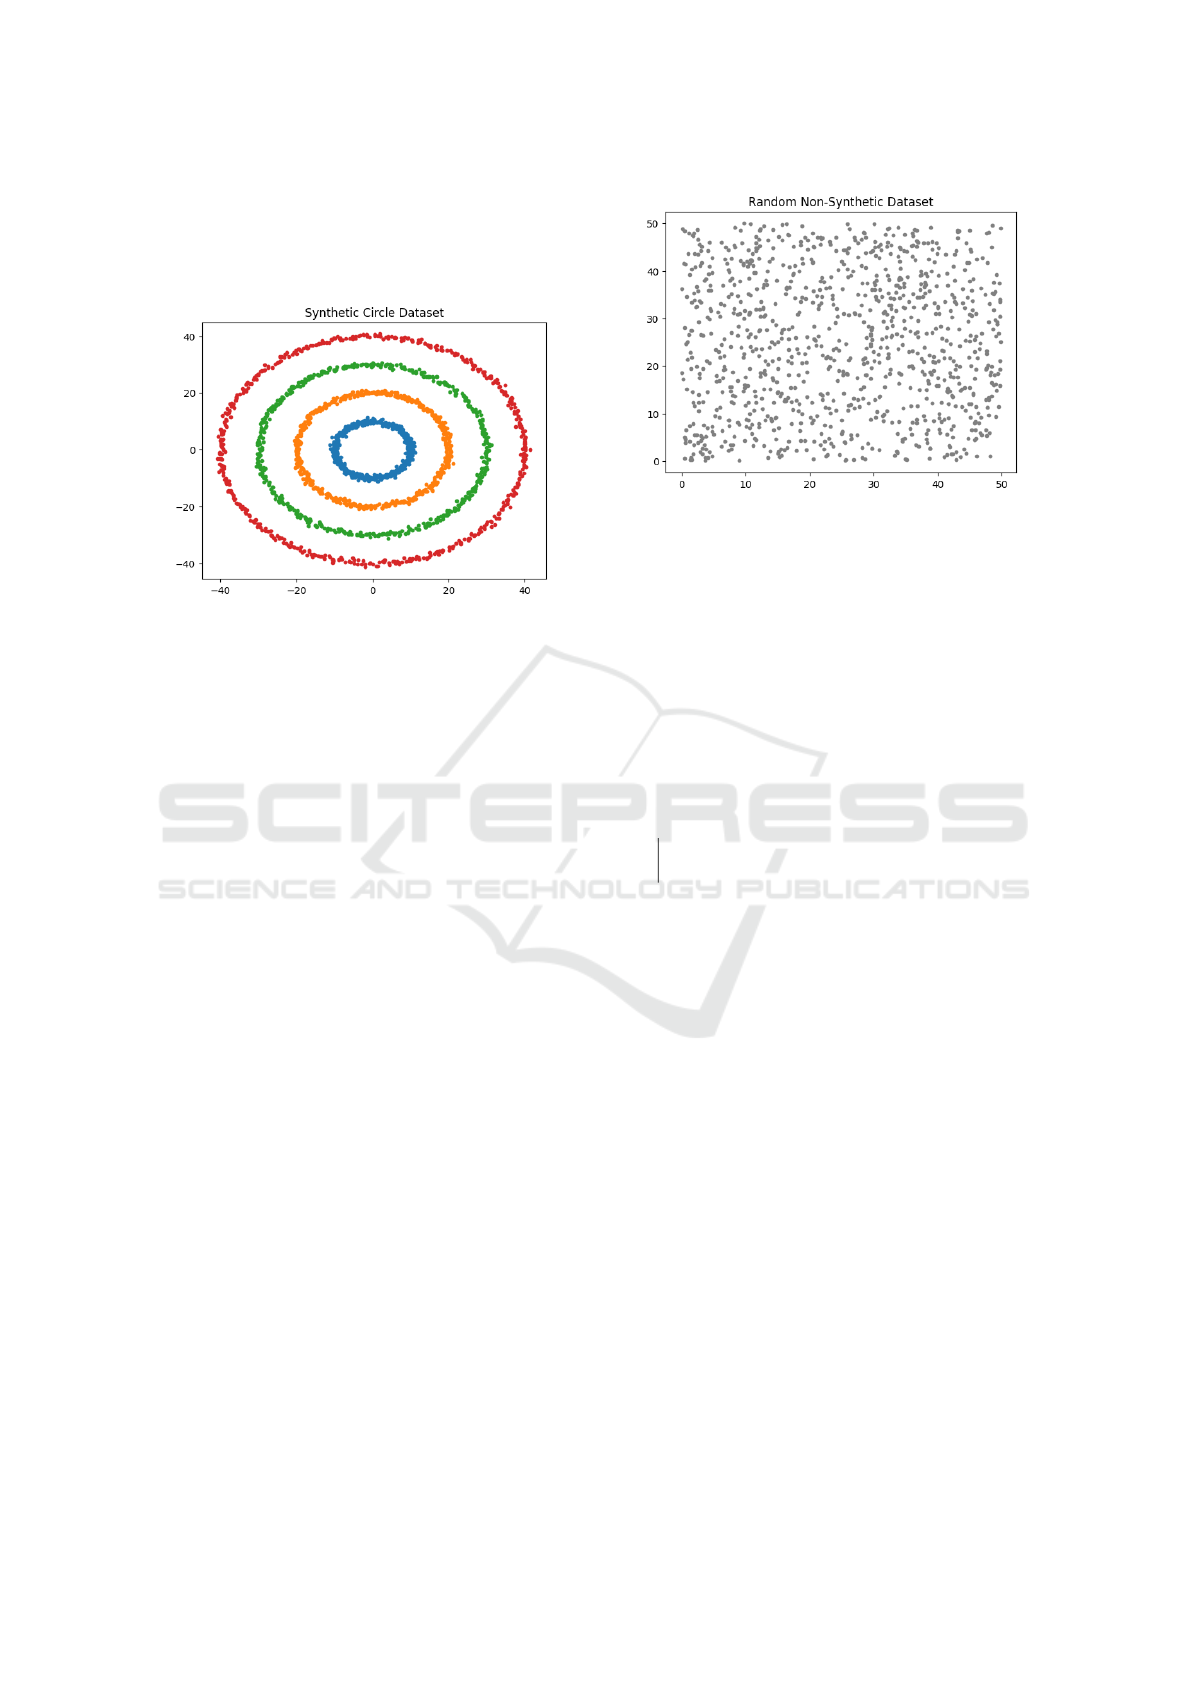
with different radii and densities. The non-linear na-
ture of these clusters is evident, making them suitable
for testing density-based and hierarchical clustering
methods.
Figure 3: Global view of the Synthetic Circle Dataset. Con-
centric clusters are clearly visible.
3.1.2 Observations on Cluster Separation
The visualization shows distinct boundaries between
the clusters. However, traditional clustering methods
like K-Means struggle to segment these due to their
assumption of spherical and convex shapes. In con-
trast, density-based clustering algorithms such as DB-
SCAN are better equipped to handle such complex ge-
ometries.
3.2 Visualizing the Generated Dataset
3.2.1 Individual Cluster Patterns
To assess the behavior of clustering algorithms on
unstructured data, the random non-synthetic dataset
is visualized in Figure 4. The points are uniformly
distributed across the two-dimensional space without
any discernible structure. This dataset serves as a con-
trol to evaluate the algorithms’ ability to avoid over-
fitting to noise.
3.2.2 Comparison with Synthetic Data
When compared to the Synthetic Circle Dataset, the
random dataset lacks inherent clusters or patterns.
This provides a baseline to evaluate the performance
of clustering algorithms, particularly their ability to
distinguish meaningful clusters from noise.
Figure 4: Visualization of the Random Non-Synthetic
Dataset. Points are uniformly distributed.
3.3 Algorithm for Visual Exploration
To systematically visualize and analyze both datasets,
the following algorithm is employed:
Data: Dataset D, Feature set {x, y}
Result: Scatter Plot Visualization
1 Input: D = {(x
i
, y
i
)} for i = 1, . . . , n
2 Normalize features x and y to range [0, 1]
3 Partition D into subsets for distinct classes (if
available)
4 foreach class C
k
in D do
Plot (x
i
, y
i
) for all points in C
k
with
distinct colors;
end
5 Add gridlines, axis labels, and title for clarity
6 Save plot as an image file
Algorithm 1: Visual Exploration of Datasets
The above algorithm ensures a consistent and
systematic visualization process, facilitating effective
comparisons between datasets.
3.4 Key Observations from Visual
Exploration
The visualization highlights significant contrasts be-
tween the datasets:
• The Synthetic Circle Dataset exhibits clear, con-
centric clusters that require methods capable of
handling non-linear geometries.
• The Random Non-Synthetic Dataset lacks inher-
ent patterns, serving as a baseline for evaluating
algorithm performance on noise.
These insights guide the subsequent analysis of clus-
tering methods in later sections, where performance
metrics and results are discussed.
Analyzing Clustering Algorithms for Non-Linear Data to Evaluate Robustness and Scalability
773
4 CLUSTERING: METHODS AND
ANALYSIS
4.1 Finding the Ideal Number of
Clusters
4.1.1 The Elbow Method: Concept and
Limitations
The Elbow Method is a widely-used heuristic for de-
termining the optimal number of clusters in a dataset.
The idea is to plot the Sum of Squared Errors (SSE)
as a function of the number of clusters k. Mathemati-
cally, the SSE is defined as:
SSE =
k
∑
i=1
∑
x
j
∈C
i
||x
j
− µ
i
||
2
, (2)
where C
i
is the i-th cluster, µ
i
is its centroid, and x
j
are the data points within the cluster.
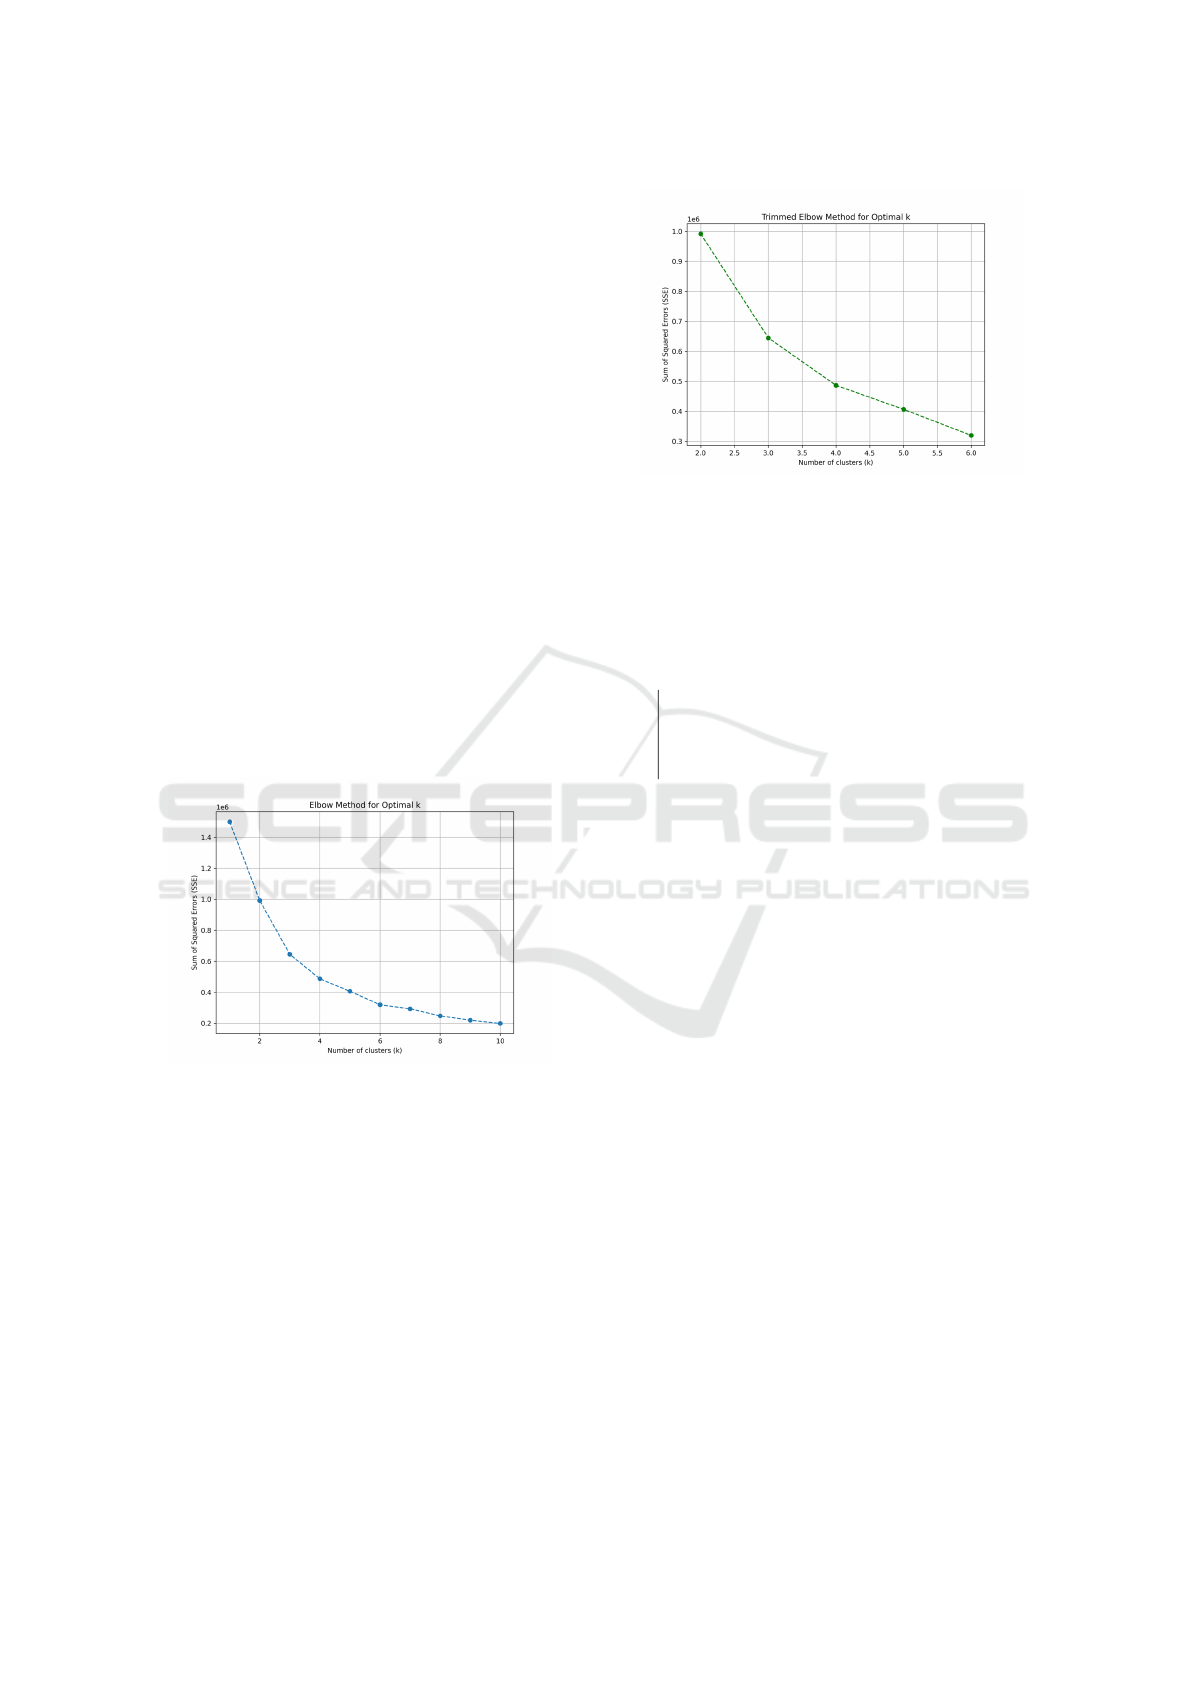
The ”elbow point” is where the decrease in SSE
becomes less pronounced, indicating diminishing re-
turns from increasing k. Figure 5 illustrates this con-
cept for the Synthetic Circle Dataset.
Figure 5: Elbow Method visualization for the Synthetic Cir-
cle Dataset.
However, the method can be ambiguous for non-
linear datasets, such as circular clusters, where SSE
reductions may not provide a clear elbow point (Cui,
2020).
4.1.2 Range Trimming for Better Visualization
To mitigate the limitations of the Elbow Method,
range trimming is applied to focus on a smaller k-
range where significant cluster separations occur. The
trimmed visualization (Figure 6) shows a clearer tran-
sition for the Synthetic Circle Dataset.
Figure 6: Trimmed Elbow Method plot for improved clarity.
Data: Dataset D = {x
1
, x
2
, . . . , x
n
}, Number
of clusters k
Result: Cluster assignments
C = {C
1
, C
2
, . . . , C
k
}
1 Initialize k centroids µ
1
, µ
2
, . . . , µ
k
using
K-Means++;
2 repeat
Assign each point x
j
to the nearest
centroid µ
i
;
Update each centroid µ
i
as the mean of
points in cluster C
i
;
until convergence;
Algorithm 2: K-Means Clustering
4.2 K-Means Clustering
K-Means remains a cornerstone algorithm due to its
simplicity and computational efficiency (Arthur and
Vassilvitskii, 2006). However, its assumption of con-
vex cluster boundaries restricts its ability to handle
complex structures, as seen in the Synthetic Circle
Dataset.
4.2.1 Parameter Tuning and Setup
The K-Means algorithm partitions n data points into k
clusters by minimizing intra-cluster variance. The al-
gorithm involves: 1. Initializing k centroids (e.g., us-
ing K-Means++). 2. Iteratively assigning each point
x to the nearest centroid µ
i
. 3. Updating the centroids
as the mean of all points in each cluster.
4.2.2 Results on the Synthetic Dataset
Applying K-Means to the Synthetic Circle Dataset re-
veals its geometric limitations. Figure 7 shows that
K-Means fails to separate concentric clusters due to
its assumption of convex boundaries.
INCOFT 2025 - International Conference on Futuristic Technology
774
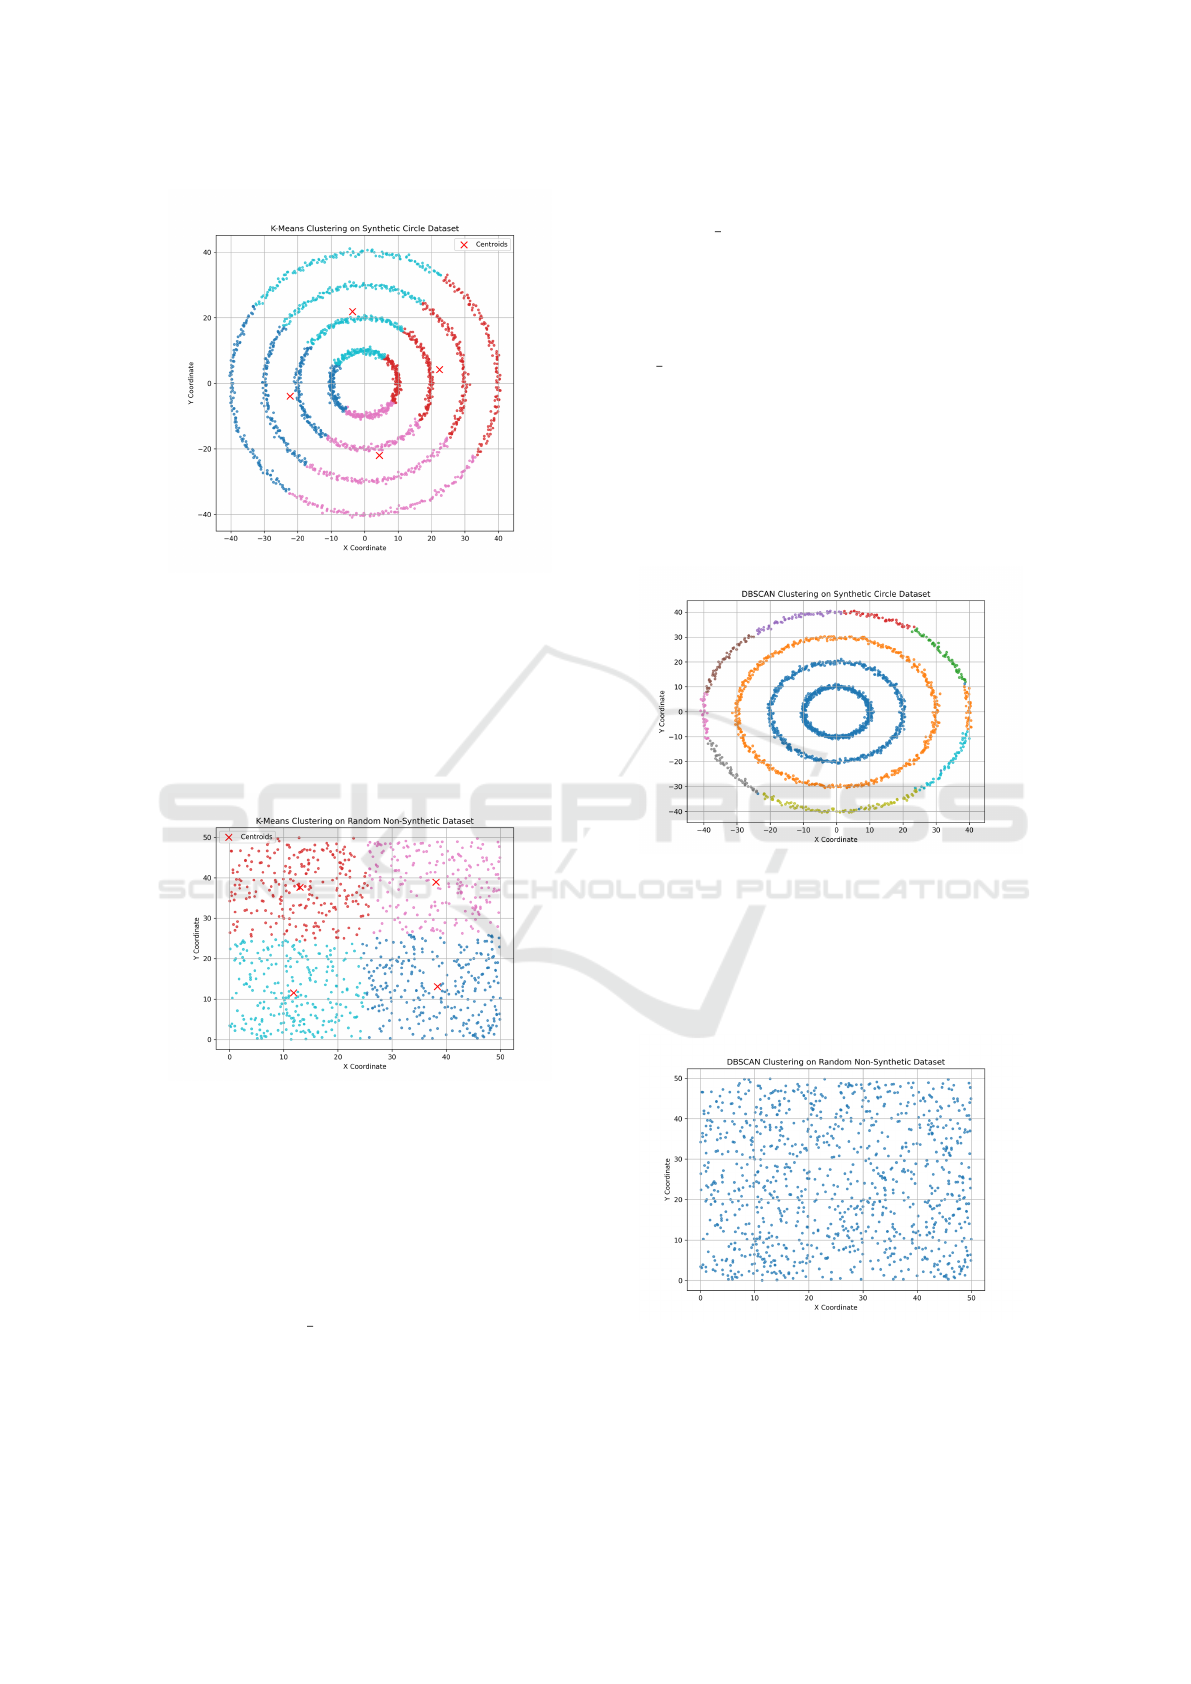
Figure 7: K-Means clustering result on the Synthetic Circle
Dataset.
4.2.3 Results on the Random Dataset
Conversely, K-Means performs well on the Random
Non-Synthetic Dataset, where no inherent structure
exists. Figure 8 demonstrates effective partitioning
into arbitrary clusters.
Figure 8: K-Means clustering result on the Random Non-
Synthetic Dataset.
4.3 DBSCAN Clustering
DBSCAN excels in detecting clusters of varying den-
sities and shapes, making it well-suited for non-linear
data like the concentric circles (Ester et al., 1996).
However, the sensitivity of DBSCAN to parameters
such as eps and min samples presents a notable chal-
lenge (Steinbach and Kumar, 2003).
4.3.1 Parameter Selection: eps and
min samples
The Density-Based Spatial Clustering of Applica-
tions with Noise (DBSCAN) algorithm detects clus-
ters of arbitrary shapes by defining a neighbor-
hood radius (eps) and a minimum number of points
(min samples) required to form a dense region (Ester
et al., 1996).
4.3.2 Results and Observations
DBSCAN successfully identifies the concentric circu-
lar clusters in the Synthetic Circle Dataset (Figure 9).
Its density-based approach overcomes the limitations
of K-Means.
Figure 9: DBSCAN clustering result on the Synthetic Circle
Dataset.
However, DBSCAN is sensitive to the choice of
eps. For the Random Dataset, improper parameter
tuning may lead to excessive noise classification or
over-segmentation (Figure 10).
Figure 10: DBSCAN clustering result on the Random Non-
Synthetic Dataset.
Analyzing Clustering Algorithms for Non-Linear Data to Evaluate Robustness and Scalability
775
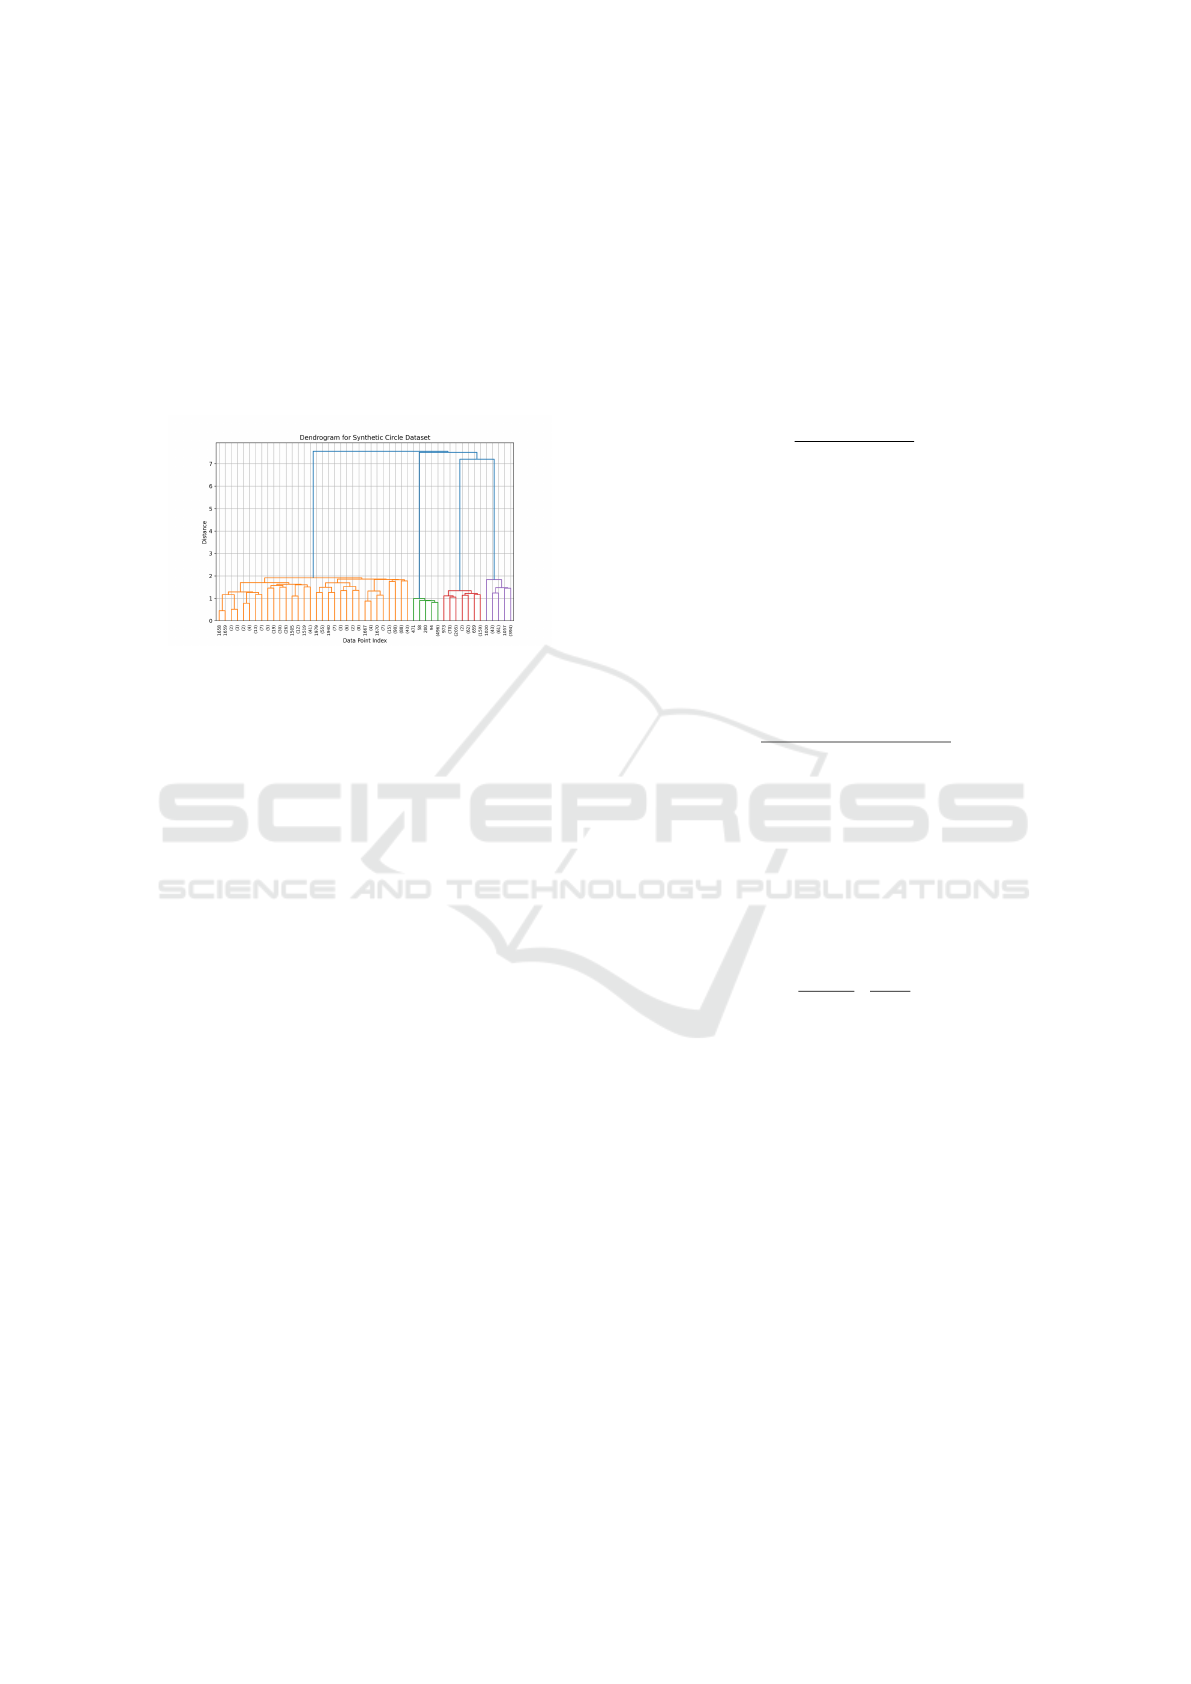
4.4 Hierarchical Clustering
4.4.1 Linkage Methods and Dendrograms
Hierarchical clustering builds a hierarchy of clusters
using linkage methods such as single, complete, or
average linkage (Murtagh and Contreras, 2012). A
dendrogram visualizes the hierarchy, allowing users
to determine an appropriate cluster cutoff.
Figure 11: Dendrogram of the Synthetic Circle Dataset us-
ing single linkage.
4.4.2 Observations and Results
Figure 11 shows the dendrogram for the Synthetic
Circle Dataset, where single-linkage clustering suc-
cessfully separates the circular clusters.
4.5 Summary of Clustering Methods
The results highlight the following:
• K-Means is unsuitable for non-linear clusters but
effective for random datasets.
• DBSCAN excels at identifying non-linear shapes
but requires careful parameter tuning.
• Hierarchical clustering provides flexibility and
clear visualizations via dendrograms.
These observations provide a comprehensive un-
derstanding of the strengths and limitations of each
method when applied to the Synthetic Circle and Ran-
dom Datasets.
5 COMPARATIVE EVALUATION
5.1 Metrics for Evaluation
The evaluation employed metrics like the Silhouette
Score (Rousseeuw, 1987), Adjusted Rand Index (Hu-
bert and Arabie, 1985), and Calinski-Harabasz Index
(Halkidi et al., 2001). These metrics provide a com-
prehensive understanding of cluster quality and sepa-
ration.
5.1.1 Silhouette Score
The Silhouette Score measures the consistency of
clustering by quantifying the compactness of clusters
and their separation. For a data point i, the silhouette
coefficient s(i) is defined as:
s(i) =
b(i) − a(i)
max(a(i), b(i))
, (3)
where a(i) is the average intra-cluster distance (cohe-
sion), and b(i) is the minimum inter-cluster distance
to the nearest neighboring cluster. A higher silhouette
score indicates well-separated and compact clusters.
5.1.2 Adjusted Rand Index (ARI)
The ARI quantifies the similarity between the cluster-
ing results and the ground truth labels. It is corrected
for chance and ranges between −1 (random labeling)
and 1 (perfect agreement). The ARI is defined as:
ARI =
Index − E(Index)
max(Index)− E(Index)
, (4)
where the index counts pair agreements across clus-
ters (Hubert and Arabie, 1985).
5.1.3 Calinski-Harabasz Index
The Calinski-Harabasz Index (CH Index) measures
the ratio of between-cluster dispersion to within-
cluster dispersion. For k clusters and n samples, the
CH Index is:
CH =
Tr(B
k
)
Tr(W
k
)
·
n − k
k − 1
, (5)
where B
k
is the between-cluster variance matrix and
W
k
is the within-cluster variance matrix.
5.2 Visual Comparison of Cluster
Outcomes
5.2.1 K-Means vs. DBSCAN
To illustrate the strengths and weaknesses of K-
Means and DBSCAN on circular and random
datasets, Figures 12 and 13 show the clustering out-
comes.
5.2.2 DBSCAN vs. Hierarchical Clustering
Figures 14 and 15 illustrate the results of DBSCAN
and hierarchical clustering on both datasets. Hierar-
chical clustering demonstrates flexibility through its
dendrogram visualization.
INCOFT 2025 - International Conference on Futuristic Technology
776
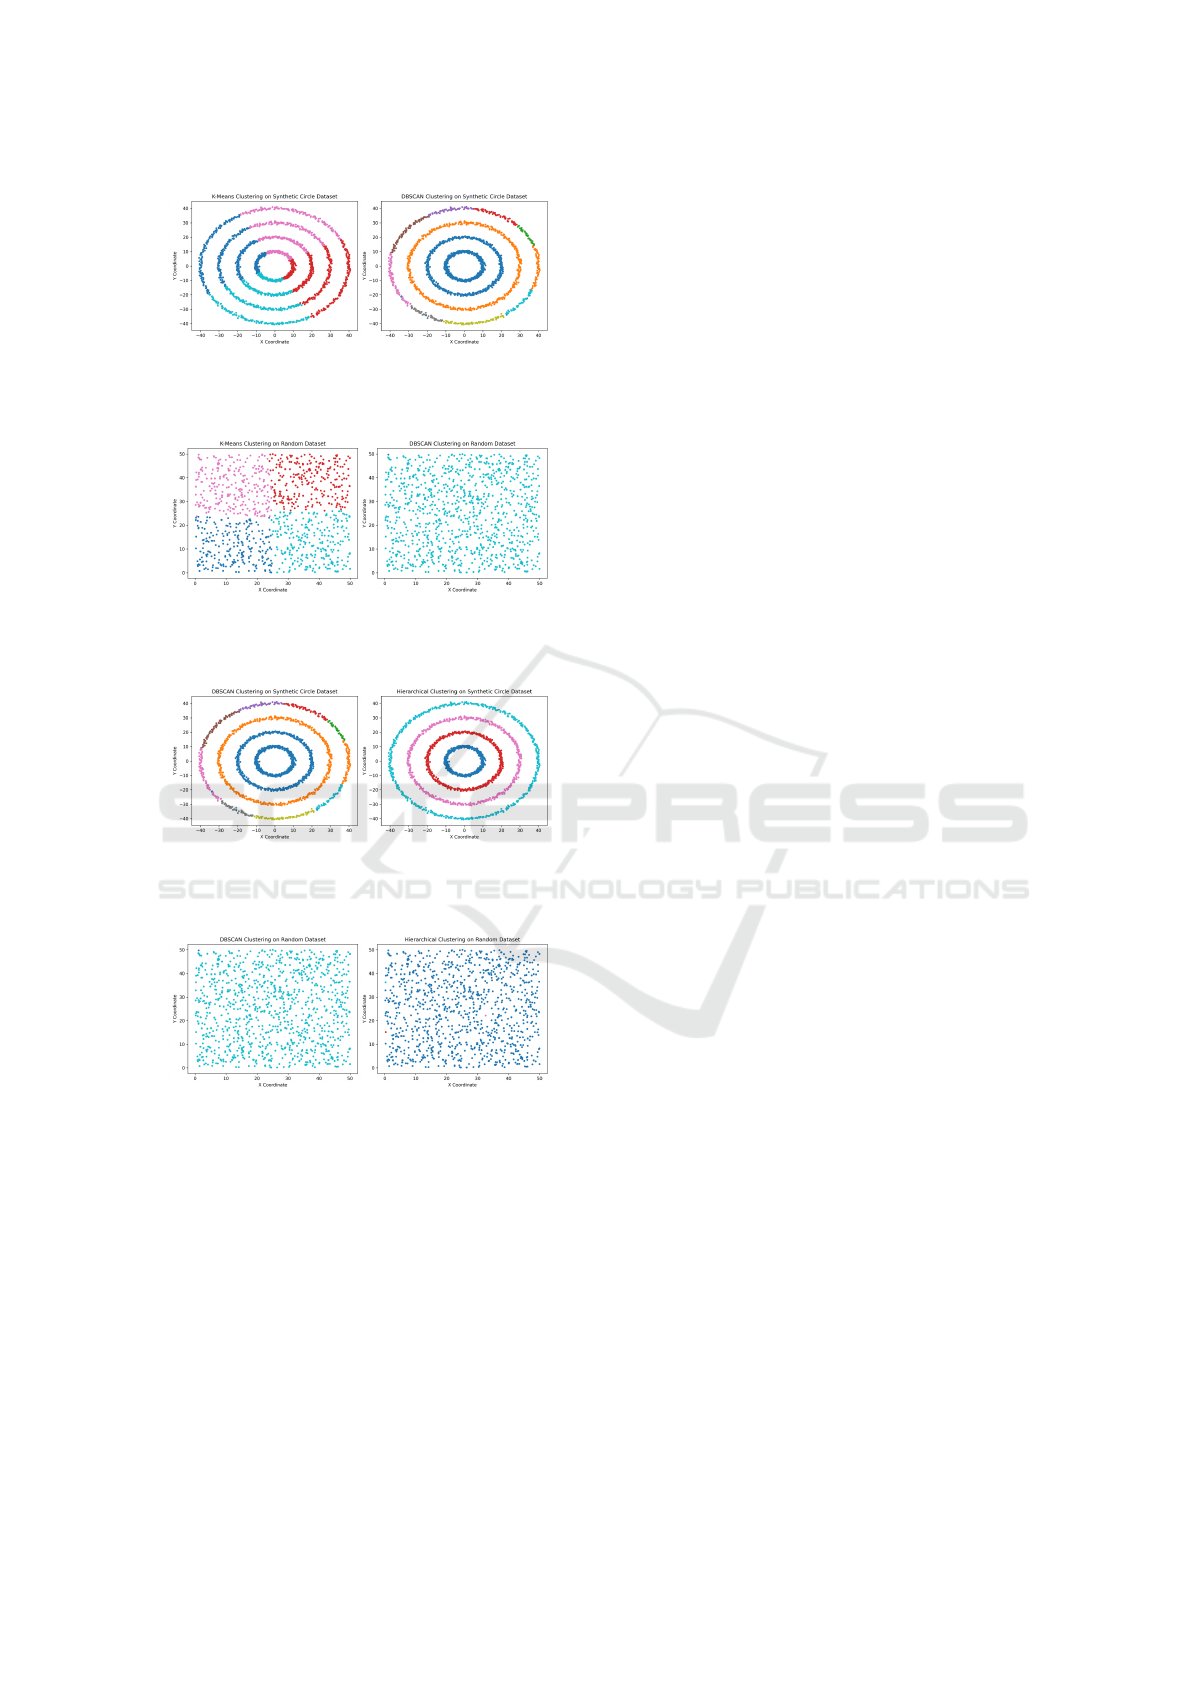
Figure 12: Comparison of K-Means and DBSCAN on the
Synthetic Circle Dataset. DBSCAN successfully identifies
concentric clusters, while K-Means fails.
Figure 13: Comparison of K-Means and DBSCAN on the
Random Dataset. K-Means partitions the data evenly, while
DBSCAN identifies noise effectively.
Figure 14: Comparison of DBSCAN and Hierarchical Clus-
tering on the Synthetic Circle Dataset. Single-linkage clus-
tering mirrors DBSCAN’s performance.
Figure 15: Comparison of DBSCAN and Hierarchical Clus-
tering on the Random Dataset. DBSCAN identifies noise,
while hierarchical methods impose a fixed structure.
5.3 Synthetic vs. Random Dataset: Key
Differences
The clustering results highlight the following distinc-
tions:
1. On the Synthetic Circle Dataset, density-based al-
gorithms like DBSCAN outperform K-Means due
to their ability to detect non-linear boundaries.
2. On the Random Non-Synthetic Dataset, K-Means
performs effectively by evenly partitioning points,
while DBSCAN identifies sparse regions as noise.
3. Hierarchical clustering provides interpretable
dendrograms, allowing users to adjust cluster
granularity.
5.4 Key Insights and Observations
The comparative evaluation reveals the following:
• K-Means: Effective for random datasets but
struggles with non-linear geometries.
• DBSCAN: Superior in detecting arbitrarily
shaped clusters but sensitive to parameter tuning.
• Hierarchical Clustering: Provides interpretable
results and performs well on both structured and
unstructured data.
The results demonstrate that DBSCAN outper-
forms K-Means on non-linear geometries, while hi-
erarchical clustering offers flexibility through its
dendrogram-based visualizations (Murtagh and Con-
treras, 2012). These findings emphasize the im-
portance of selecting appropriate clustering methods
based on data geometry and structure.
6 DISCUSSION
The findings reveal that density-based algorithms like
DBSCAN excel in detecting arbitrarily shaped clus-
ters, while K-Means struggles with non-linear geome-
tries (Steinbach and Kumar, 2003). Parameter sen-
sitivity remains a limitation for DBSCAN, necessi-
tating adaptive tuning methods (Shutaywi and Ka-
chouie, 2021). Future research can integrate hybrid
approaches that combine the efficiency of K-Means
with the flexibility of DBSCAN (Saxena et al., 2017).
6.1 Challenges of Clustering Circular
Data
6.1.1 Geometric Limitations of K-Means
K-Means assumes that clusters are convex and spher-
ical, which limits its effectiveness on datasets with
non-linear geometries, such as concentric circles.
This limitation arises because K-Means minimizes
intra-cluster distances without considering global
cluster shapes. Figure 16 demonstrates K-Means mis-
classifying circular clusters into arbitrary partitions.
The issue becomes more pronounced as cluster
complexity increases. Modifications such as kernel-
ized K-Means or density-based methods can allevi-
ate these problems by allowing non-linear boundaries
(Arthur and Vassilvitskii, 2006).
Analyzing Clustering Algorithms for Non-Linear Data to Evaluate Robustness and Scalability
777
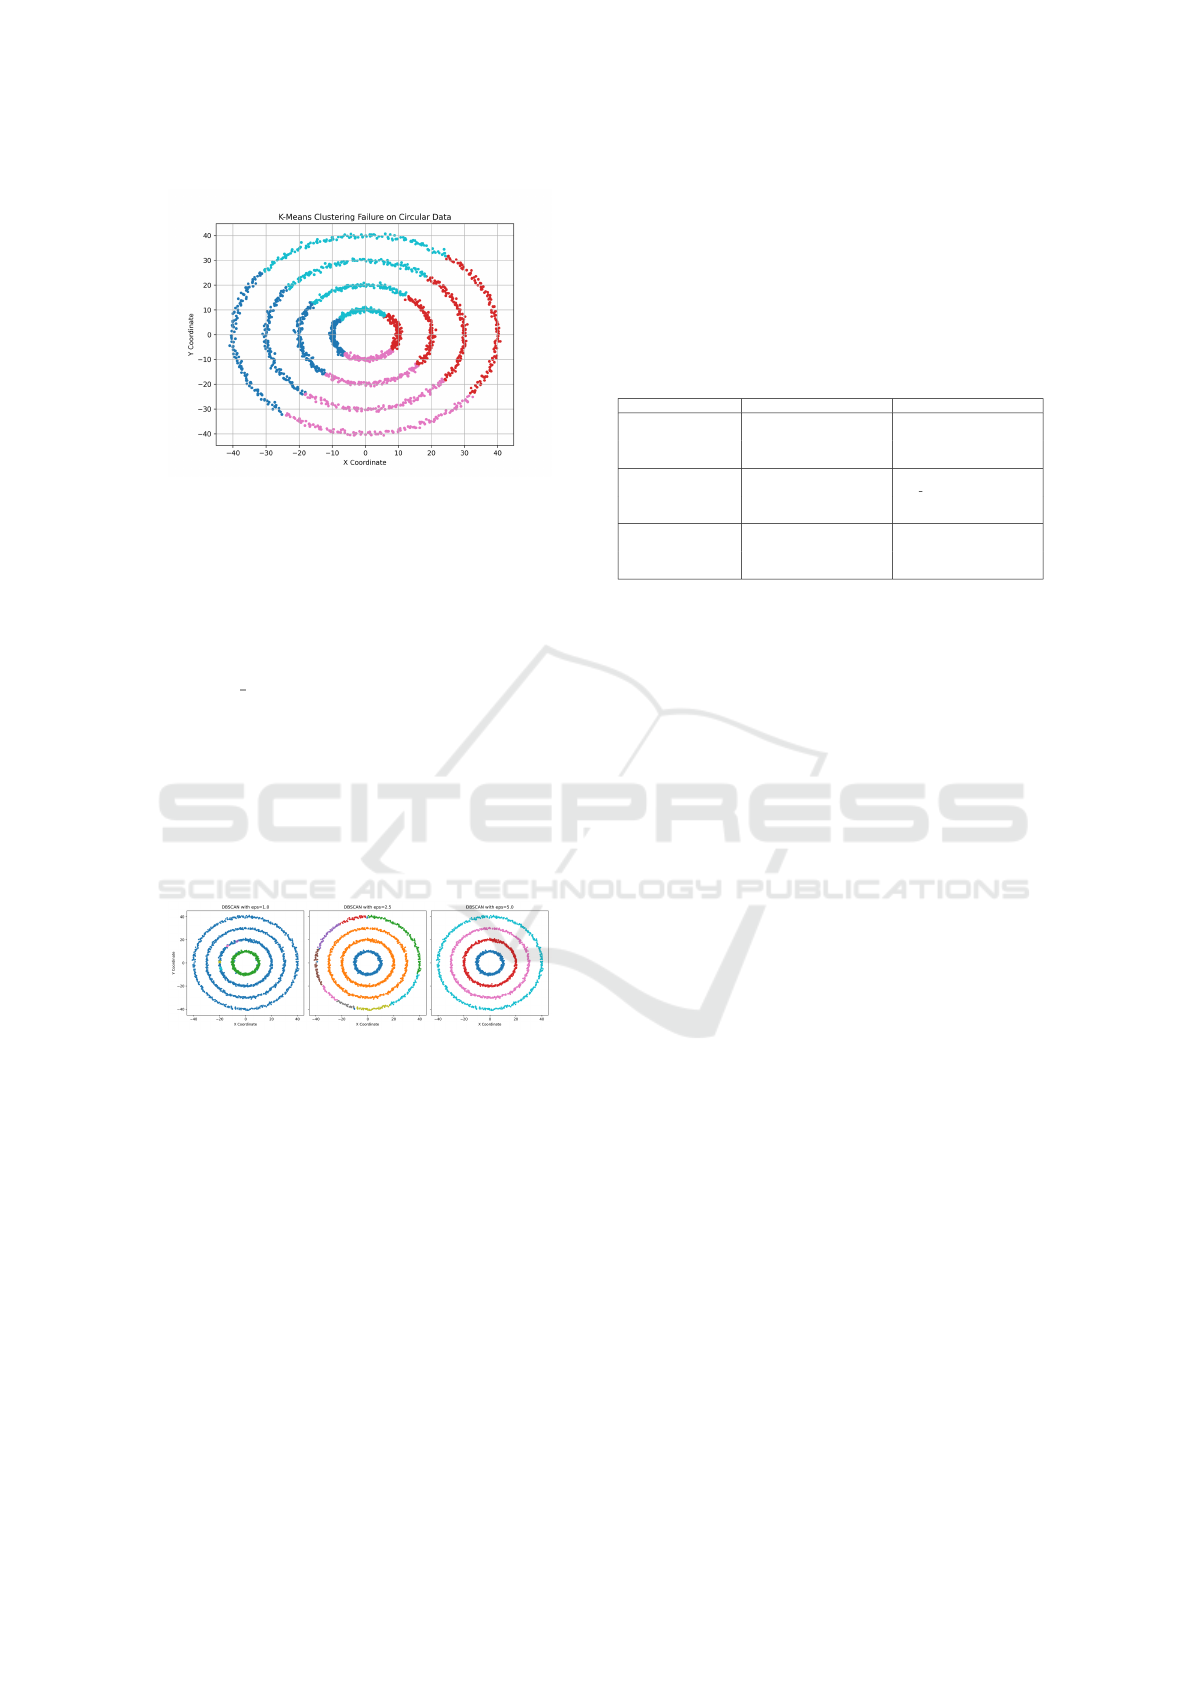
Figure 16: K-Means clustering failure on the Synthetic Cir-
cle Dataset. The algorithm splits circular clusters incor-
rectly due to its convex boundary assumption.
6.1.2 Parameter Sensitivity in DBSCAN
DBSCAN performs well on circular datasets; how-
ever, its performance is highly sensitive to the choice
of the neighborhood radius (eps) and minimum
points (min samples). Improper parameter selection
can result in:
• Over-segmentation, where clusters are frag-
mented into smaller regions.
• Under-segmentation, where distinct clusters are
merged together.
Figure 17 shows the impact of varying eps on the
Synthetic Circle Dataset.
Figure 17: Effect of varying eps in DBSCAN. Small values
lead to over-segmentation, while larger values merge clus-
ters into a single region.
To address this challenge, adaptive techniques
such as k-distance plots can be used to estimate the
optimal eps.
6.2 Lessons Learned from Visual and
Metric Comparisons
The comparative evaluation in Section 5 provides key
insights into algorithm behavior under different con-
ditions:
• K-Means is highly effective for uniformly dis-
tributed data but performs poorly on datasets with
non-linear boundaries.
• DBSCAN excels at detecting arbitrarily shaped
clusters but requires careful parameter tuning.
• Hierarchical Clustering offers flexibility through
linkage methods and dendrograms, making it
adaptable to diverse data geometries.
These observations are summarized in Table 2.
Table 2: Comparison of Clustering Algorithms on Synthetic
and Random Datasets.
Algorithm Strengths Limitations
K-Means
Fast and scalable for large
datasets
Fails on non-linear or non-
convex data
Effective for uniformly dis-
tributed data
Sensitive to initialization
DBSCAN
Detects arbitrarily shaped
clusters
Sensitive to eps and
min samples parameters
Handles noise effectively Struggles with varying den-
sities
Hierarchical
Clustering
Interpretable dendrograms Computationally expensive
for large datasets
Flexible linkage methods Sensitive to noise and out-
liers
6.3 Broader Implications for Similar
Datasets
6.3.1 Applicability to Real-World Scenarios
The challenges encountered with circular data can be
extrapolated to real-world datasets with complex ge-
ometries, such as:
• Geospatial Data: Natural clusters, such as geo-
graphic regions, often exhibit non-linear bound-
aries.
• Biological Data: Cell or molecular distributions
often form irregular, overlapping clusters.
• Sensor Data: Environmental sensor readings may
display spatial patterns that traditional clustering
methods fail to capture.
Figure 18 demonstrates a case where DBSCAN
successfully identifies non-linear clusters in a hypo-
thetical geospatial dataset.
6.3.2 Future Directions
To improve clustering outcomes on complex datasets,
future research should focus on the following:
1. Adaptive Parameter Selection: Techniques such
as elbow methods or k-distance plots can dynam-
ically determine DBSCAN parameters.
2. Hybrid Methods: Combining the strengths of K-
Means and DBSCAN could improve robustness.
For instance, initializing DBSCAN with K-Means
centroids may reduce parameter sensitivity.
3. Kernelized Clustering: Kernel methods can trans-
form non-linear data into a higher-dimensional
space where clusters become linearly separable.
INCOFT 2025 - International Conference on Futuristic Technology
778

Figure 18: DBSCAN applied to a real-world geospatial
dataset with non-linear clusters.
The integration of these techniques can address cur-
rent limitations and broaden the applicability of clus-
tering algorithms to real-world scenarios.
6.4 Summary of Key Takeaways
This section highlights the following points:
• Circular datasets pose significant challenges for
traditional clustering methods like K-Means due
to their convex boundary assumptions.
• DBSCAN provides a robust alternative for com-
plex data but requires careful parameter selection.
• Future advancements, including adaptive and hy-
brid methods, can enhance clustering perfor-
mance on non-linear and real-world datasets.
These insights underscore the importance of algo-
rithm selection and parameter tuning for datasets with
complex structures.
7 FUTURE WORK
This study has provided a comprehensive evalua-
tion of clustering methods on synthetic and random
datasets, emphasizing the challenges posed by non-
linear geometries and parameter sensitivity. However,
several opportunities remain for future research to fur-
ther enhance clustering performance:
1. Adaptive DBSCAN Parameter Tuning: The
sensitivity of DBSCAN to eps and min samples
limits its applicability to diverse datasets. Fu-
ture work could explore automated approaches
such as heuristic-based optimization, elbow-based
k-distance methods, or machine learning mod-
els to estimate optimal parameters dynamically.
2. Hybrid Clustering Approaches: Combining the
strengths of K-Means (speed and scalability) with
DBSCAN (ability to detect arbitrary shapes) may
yield robust clustering results. For instance, ini-
tializing DBSCAN with centroids derived from
K-Means could improve performance on noisy or
complex datasets.
3. Kernelized Clustering Techniques: Applying
kernel methods to transform data into higher-
dimensional spaces could allow algorithms like
K-Means to handle non-linear geometries effec-
tively. Kernel-based clustering has the potential to
bridge the gap between computational efficiency
and clustering accuracy.
4. Scalability Improvements for Hierarchical
Clustering: Hierarchical clustering methods are
computationally expensive for large datasets. Fu-
ture research could focus on approximations, par-
allel implementations, or pruning techniques to
improve scalability while preserving interpretabil-
ity.
5. Application to Real-World Complex Data: The
current study focuses on synthetic and uniformly
random datasets. Future work will apply these
methods to real-world datasets, such as biologi-
cal clustering (e.g., cell classification), geospatial
data, and sensor network clustering, to validate
the generalizability of the findings.
By addressing these challenges, future research
can advance clustering methodologies, making them
more adaptive, scalable, and robust for diverse and
complex datasets.
8 CONCLUSION
This study conducted a comprehensive evaluation
of clustering algorithms—K-Means, DBSCAN, and
Hierarchical Clustering—on synthetic and random
datasets to explore their strengths, limitations, and
suitability for complex data geometries. The Syn-
thetic Circle Dataset was instrumental in exposing
the limitations of traditional methods like K-Means,
which struggle to detect non-linear clusters due to
their assumption of convex boundaries. In contrast,
DBSCAN and Hierarchical Clustering demonstrated
superior performance on non-linear and arbitrarily
shaped data.
K-Means proved highly effective on the Random
Non-Synthetic Dataset, where the data lacked inher-
ent structure. Its simplicity, speed, and scalability
make it an attractive option for uniformly distributed
data. However, its inability to handle overlapping
or non-linear clusters highlights the need for alter-
native techniques when dealing with more complex
Analyzing Clustering Algorithms for Non-Linear Data to Evaluate Robustness and Scalability
779

datasets. DBSCAN excelled at identifying clusters
of arbitrary shapes and densities, making it well-
suited for non-linear data like the concentric circles.
Nonetheless, its sensitivity to parameters, particularly
the neighborhood radius (eps) and minimum points
(min samples), remains a challenge that warrants
further exploration.
Hierarchical Clustering emerged as a flexible and
interpretable method, particularly through its dendro-
gram visualizations, which allow researchers to an-
alyze cluster structures at various levels of granular-
ity. However, its computational complexity limits its
applicability to larger datasets, making scalability an
area for improvement. The study utilized quantita-
tive performance metrics such as the Silhouette Score,
Adjusted Rand Index, and Calinski-Harabasz Index to
provide an objective evaluation of the clustering re-
sults. These metrics, combined with visual analysis,
offered a holistic understanding of algorithm perfor-
mance under structured and unstructured data condi-
tions.
In summary, this work highlights the importance
of selecting appropriate clustering techniques based
on the underlying data geometry and complexity.
While K-Means is effective for convex and uniform
datasets, DBSCAN and Hierarchical Clustering are
better suited for non-linear and irregular data struc-
tures. Future advancements in hybrid clustering
methods, adaptive parameter tuning, and kernelized
techniques can address the observed limitations and
enhance clustering robustness. This study lays the
groundwork for further exploration of clustering al-
gorithms in real-world scenarios, where data often ex-
hibit noise, complexity, and diverse geometries.
REFERENCES
Arthur, D. and Vassilvitskii, S. (2006). k-means++: The
advantages of careful seeding. In Stanford.
Cui, M. (2020). Introduction to the k-means clustering al-
gorithm based on the elbow method. In Accounting,
Auditing and Finance, volume 1, pages 5–8.
Dandekar, A., Zen, R. A., and Bressan, S. (2018). A com-
parative study of synthetic dataset generation tech-
niques. In Database and Expert Systems Applications,
pages 387–395.
Ester, M., Kriegel, H. P., Sander, J., and Xu, X. (1996).
A density-based algorithm for discovering clusters in
large spatial databases with noise. In Proceedings of
KDD’96, pages 226–231.
Halkidi, M., Batistakisand, Y., and Vazirgiannis, M. (2001).
On clustering validation techniques. Journal of intel-
ligent information systems, 17:107–145.
Hubert, L. and Arabie, P. (1985). Comparing partitions.
Journal of classification, 2:193–218.
Jain, A. K. (2010). Data clustering: 50 years beyond k-
means. Pattern recognition letters, 31(8):651–666.
Madhulatha, T. S. (2012). An overview on clustering meth-
ods. arXiv preprint arXiv:1205.1117.
Murtagh, F. and Contreras, P. (2012). Algorithms for hi-
erarchical clustering: an overview. Wiley Interdisci-
plinary Reviews: Data Mining and Knowledge Dis-
covery, 2(1):86–97.
Pedregosa, F., Varoquaux, G., Gramfort, A., Michel, V.,
Thirion, B., Grisel, O., and Duchesnay, E. (2011).
Scikit-learn: Machine learning in python. The Journal
of Machine Learning Research, 12:2825–2830.
Rousseeuw, P. J. (1987). Silhouettes: a graphical aid to
the interpretation and validation of cluster analysis.
Journal of computational and applied mathematics,
20:53–65.
Saxena, A., Prasad, M., Gupta, A., Bharill, N., et al. (2017).
A review of clustering techniques and developments.
Neurocomputing, 267:664–681.
Shutaywi, M. and Kachouie, N. N. (2021). Silhouette anal-
ysis for performance evaluation in machine learning
with applications to clustering. Entropy, 23(6):759.
Steinbach, M. and Kumar, V. (2003). Finding clusters of
different sizes, shapes, and densities in noisy, high di-
mensional data. In Proceedings of SIAM International
Conference on Data Mining, pages 47–58.
Xu, R. and Wunsch, D. (2005). Survey of clustering al-
gorithms. IEEE Transactions on neural networks,
16(3):645–678.
INCOFT 2025 - International Conference on Futuristic Technology
780
