
Explainable AI Approach for Cardiac Involvement Detection in
Anderson-Fabry Disease
Chiara Verdone
1 a
, Matteo Gravina
2 b
, Grazia Casavecchia
2 c
, Rodolfo Belfiore
2
and Benedetta Di Millo
2
1
Department of Agricultural Science, Food, Natural Resources and Engineering, University of Foggia, Foggia, Italy
2
Department of Medical and Surgical Sciences, Section of Diagnostic Imaging, University of Foggia, Foggia, Italy
fi
Keywords:
Deep Learning, Healthcare, Anderson-Fabry Disease, Explainability.
Abstract:
Anderson-Fabry Disease (AFD) is a rare X-linked hereditary disorder caused by a deficiency of the enzyme
alpha-galactosidase A, leading to the accumulation of globotriaosylceramide (Gb3) in multiple organs, in-
cluding kidneys and the cardiovascular system. This study explores the role of deep learning techniques in the
analysis of cardiac imaging data for the early detection and monitoring of AFD-related cardiac involvement.
Using advanced image processing algorithms, we aim to improve diagnostic accuracy, assess myocardial fi-
brosis progression, and facilitate personalized patient management. Our findings highlight the potential of
artificial intelligence in enhancing diagnostic workflows, reducing variability in interpretation, and aiding
clinicians in making more informed decisions. Furthermore, the use of non-invasive imaging techniques and
Native T1 sequences for mapping studies in cardiac magnetic resonance imaging (CMR) could reduce the
need for contrast.
1 INTRODUCTION
Anderson-Fabry disease (AFD) is an X-linked hered-
itary disease caused by total or partial deficiency
of the enzyme alpha-galactosidase A which leads
to the lysosomial accumulation of globotriaosylce-
ramide (Gb3) in many organs, including the kid-
neys, nervous system, cardiovascular system and skin
(Torra, 2008; Tøndel et al., 2008).
Among the affected organs, the heart is partic-
ularly vulnerable, with Gb3 deposition in myocytes
(heart muscle cells) and fibroblasts leading to progres-
sive myocardial fibrosis, cardiomyopathy (enlarge-
ment and weakening of the heart), ventricular dys-
function, and arrhythmias. Early and accurate cardiac
involvement detection is crucial, as myocardial fibro-
sis significantly worsens the prognosis of AFD pa-
tients. Cardiac Magnetic Resonance Imaging (CMR)
has become the non-invasive gold standard for evalu-
ating cardiac manifestations, particularly through the
use of Native T1 sequences (Deva et al., 2016).
Native T1 sequences provides valuable informa-
tion on myocardial tissue characteristics without the
a
https://orcid.org/0000-0003-1335-5276
b
https://orcid.org/0000-0001-9601-8253
c
https://orcid.org/0009-0000-9320-7833
need for contrast agents. This is particularly impor-
tant in AFD patients, many of whom may have renal
impairment, where the use of gadolinium-based con-
trast agents poses a risk of nephrogenic systemic fi-
brosis and other complications.
Despite the effectiveness of CMR, the manual in-
terpretation of images remains subjective and prone
to variability. Artificial Intelligence (AI), particu-
larly Deep Learning techniques such as Convolutional
Neural Networks (CNNs), offers the potential to auto-
mate and standardize the evaluation process, improv-
ing diagnostic accuracy and reproducibility. How-
ever, to ensure clinical adoption, AI models must also
be explainable, enabling clinicians to understand the
rationale behind predictions (Aversano et al., 2024;
Denaro et al., 2024; Aversano et al., 2023).
In this work, we propose a CNN-based ap-
proach for the automated analysis of Native T1 car-
diac MRI scans to detect cardiac involvement in
AFD. Our pipeline integrates advanced preprocess-
ing techniques, model optimisation, and explainabil-
ity through Grad-CAM visualisation. We aim to
demonstrate that AI-driven, non-contrast-based diag-
nosis can support clinicians in managing AFD pa-
tients, reducing risks associated with contrast admin-
istration while maintaining high diagnostic reliability.
Verdone, C., Gravina, M., Casavecchia, G., Belfiore, R., Di Millo and B.
Explainable AI Approach for Cardiac Involvement Detection in Anderson-Fabry Disease.
DOI: 10.5220/0013653700003967
In Proceedings of the 14th International Conference on Data Science, Technology and Applications (DATA 2025), pages 811-818
ISBN: 978-989-758-758-0; ISSN: 2184-285X
Copyright © 2025 by Paper published under CC license (CC BY-NC-ND 4.0)
811

2 BACKGROUND
2.1 Cardiac Magnetic Resonance
Cardiac magnetic resonance imaging (CMR) with
Native T1 sequences is an advanced, non-invasive
method for the early diagnosis of lysosomal accumu-
lations in the heart, a crucial aspect of Fabry disease
(Deva et al., 2016). This approach allows the de-
tection of changes in the myocardium that may not
be visible with other diagnostic techniques, such as
echocardiography or electrocardiography. Key ben-
efits of this approach are early detection, that is the
ability to identify changes in cardiac tissue before ob-
vious clinical symptoms appear allows for early inter-
vention, potentially slowing or stopping the progres-
sion of the disease. It’s important for continuous mon-
itoring because offers the ability to follow the evolu-
tion of myocardial fibrosis and other cardiac changes
over time, which is essential for assessing the effec-
tiveness of treatments and the heart’s response to ther-
apy. The longitudinal relaxation time (T1) in native
sequences, such as the T1 Native used for tissue map-
ping studies, can vary depending on the magnetic res-
onance imaging (MRI) machine used. This depends
on several factors, including field strength, sequences
and image parameters, tissue type, machine calibra-
tion an customization.
2.2 Convolutional Neural Networks in
Medical Imaging
The approach adopted in this study leverages Con-
volutional Neural Networks (CNNs), a class of deep
learning models extensively utilized in medical imag-
ing (Yamashita et al., 2018). CNNs consist of con-
volutional layers, pooling layers, and fully connected
layers. Convolutional layers extract features from in-
put images by applying filters that detect spatial pat-
terns, such as edges and textures. Pooling layers re-
duce the spatial dimensions, preserving essential in-
formation while improving computational efficiency.
Fully connected layers aggregate these features and
produce the final classification output.
CNNs have demonstrated remarkable success in
detecting and classifying diseases in medical imaging,
including cardiovascular and renal pathologies (Lit-
jens et al., 2017). However, their use in distinguishing
patients with concomitant cardiac and renal diseases
remains an area of active research.
2.3 Explainability in Deep Learning:
The Role of Grad-CAM
One of the main challenges of AI in healthcare is the
black-box nature of deep learning models. Clinicians
require transparency and interpretability to trust AI-
generated diagnoses. In this work, we employ the
Gradient-weighted Class Activation Mapping (Grad-
CAM) technique (Selvaraju et al., 2017) to enhance
model explainability.
Grad-CAM extends the Class Activation Mapping
(CAM) method (Zhou et al., 2016) by generating lo-
calization maps that highlight relevant regions in an
image for classification. It computes the gradient of
the target class score with respect to the feature maps
of the last convolutional layer. These gradients are
then aggregated to assign importance weights to fea-
ture maps, producing heatmaps that overlay the origi-
nal MRI scans. This visualization helps clinicians un-
derstand which areas of the image contributed most
to the model’s decision, fostering trust in AI-assisted
diagnostics.
The integration of CNNs and explainability tech-
niques like Grad-CAM is essential for advancing AI-
driven diagnosis in cardiac and renal diseases. By
providing interpretable visualizations, this approach
bridges the gap between deep learning and clinical
applicability, ensuring that AI models support rather
than replace human expertise.
3 RELATED WORKS
In recent years, deep learning techniques have demon-
strated significant potential in medical imaging analy-
sis, particularly in the classification and segmentation
of cardiovascular and renal pathologies.
Several studies have explored the application of
Convolutional Neural Networks (CNNs) for the auto-
matic diagnosis of heart diseases using cardiac MRI.
For instance, (Bai et al., 2018) employed deep learn-
ing models to extract features from cardiac MRI
scans, achieving high accuracy in detecting various
cardiac abnormalities. Similarly, (Chen et al., 2019)
demonstrated that CNN-based architectures could ef-
fectively classify myocardial diseases, highlighting
the importance of spatial feature extraction.
Regarding kidney disease detection, recent works
have focused on integrating deep learning with MRI
scans to improve early diagnosis (Zhang et al.,
2024). For example, (Almuayqil et al., 2024)] uti-
lized a CNN-based approach to identify renal dis-
eases, achieving promising results in distinguishing
pathological cases from healthy ones. Additionally,
DMDH 2025 - Special Session on Data-Driven Models for Digital Health Transformation
812
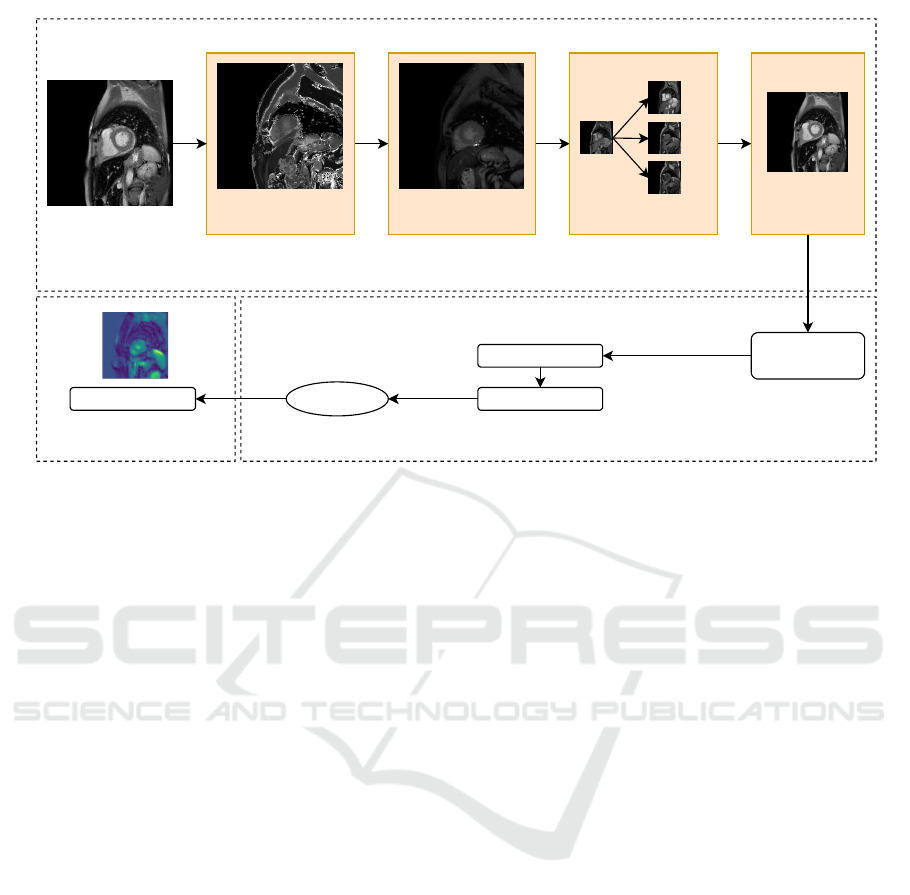
Blur Image Removal
a. Image Preprocessor
b. Model Construction c. Explainability
Dark Image Removal Resize
288 x 288
128 x 128
Talos optimization
Prediction
CNN Model
GradCam heatmap
288 x 288
288 x 288
Data Augumentation
Input RM images
Best Model
Figure 1: Approach.
multi-modal AI models that combine MRI with other
clinical data have been proposed to enhance diagnos-
tic performance (Qiao et al., 2025). (Gravina et al.,
2024) introduced a non-invasive technique for identi-
fying renal complications in Anderson-Fabry disease
using advanced imaging methods.
Given the growing interest in explainable AI
(XAI), some research efforts have also focused on
developing interpretable models for medical imaging.
Attention mechanisms and Grad-CAM visualizations
have been employed to highlight the most relevant re-
gions in MRI scans, ensuring that AI-driven decisions
align with expert knowledge (Selvaraju et al., 2020).
In this context,(Prencipe et al., 2023) proposed an ex-
plainable radiogenomic framework to predict muta-
tional statuses in lung adenocarcinoma, demonstrat-
ing how AI can be both predictive and interpretable
in complex medical diagnoses.
Our study builds upon these advancements by de-
veloping a CNN-based approach for distinguishing
patients with both cardiac and renal diseases from
those with only cardiac conditions. By leveraging
deep learning techniques we aim to improve diagnos-
tic accuracy and interpretability in the classification
of complex multi-organ pathologies.
4 APPROACH
Figure 1 shows the general approach adopted and we
observe that it is composed of 4 different phases: (a)
Image Preprocessor, (b) Model Construction and (c)
Explainability Task. The tasks will be detailed in
more detail in the following paragraphs.
4.1 Image Processor
The first task initially focuses on extracting the tho-
racic magnetic resonance slices (in DICOM format)
from each study belonging to each patient. Subse-
quently, the extracted images were subjected to sev-
eral preprocessing steps to eliminate from the analy-
sis images that did not have an acceptable quality and
which could, therefore, introduce noise into the model
training process (Figure 1 a).
The first preprocessing activity concerns the re-
moval of blurry images. To do this, a function writ-
ten in Python was used that uses the principle of the
variance of the Laplacian; it is a filter that measures
the variations in intensity of pixels in an image. In
particular, if an image has sharp and defined details,
the Laplacian will have very variable values (high
variance); if, instead, an image is blurry or grainy,
the changes between pixels will be smaller (low vari-
ance). In this specific analysis, a double threshold ap-
proach was adopted: a lower one equal to 5 to check
if the image was blurry and an upper one equal to 400
to check if the image was noisy or grainy. The reasons
behind the choice of this technique are that first of all,
the Laplacian is more effective on grayscale images as
in the case in question; it does not depend on the reso-
lution or orientation of the image, and furthermore, it
is used in radiology for image enhancement and noise
removal in medical scans (Fotin et al., 2019).
Explainable AI Approach for Cardiac Involvement Detection in Anderson-Fabry Disease
813

conv block 1
convolutional + ReLU
max pooling
fully connected + ReLU
softmax
input tensor
normalization
dropout
flatten
input shape
(128x 128)
conv block 2
conv block 4
binary output
conv block 3
conv block 5
Figure 2: CNN Architecture.
The second preprocessing step involves removing
images that are too dark compared to the average us-
ing an approach based on the image histogram. In
particular, it measures the proportion of pixels with
low-intensity values and compares it with a prede-
fined threshold. The basic idea is that in dark images,
most pixels have low light intensity, so a high number
of pixels with values close to zero indicates a possible
underexposure. Also, in this case, a function written
in Python was used. Specifically, first, all pixels with
an intensity value lower than 30 are counted, and then
the percentage of dark pixels compared to the entire
image is calculated; if this percentage is greater than
a threshold value set at 65%, the image is considered
too dark and is therefore discarded.
This technique was chosen because it does not de-
pend on the content of the image itself, and is also al-
ready used in the field of medical imaging (Agarwal
and Mahajan, 2018).
To improve the model’s generalisation ability and
reduce the risk of overfitting, a data augmentation
strategy was implemented using the imgaug library
1
.
The applied transformations were chosen to sim-
ulate realistic variations in chest MRI images without
significantly altering the anatomical features.
The augmentation operations adopted include:
• Slight rotation (-5° to 5°): useful to compensate
1
https://imgaug.readthedocs.io/en/latest/ last visit:
April 2025
for slight variations in the orientation of the scans.
• Scaling (0.95x – 1.05x): introduce slight changes
in the image size to improve the robustness of the
model at different acquisition resolutions.
• Random crop up to 5%: simulates variations in
the acquisition field of view and helps the model
to focus on discriminant features.
• Contrast variation (0.4x – 1.6x): emulates differ-
ences in imaging conditions and acquisition pa-
rameters.
• Gaussian blur (sigma = 0 – 0.1) with probability
50%: introduce slight noise to improve the robust-
ness of the model to variations in image quality.
• Horizontal and vertical translations: to introduce
slight variations in position (3%) since MRIs may
be centred slightly differently between patients.
Finally, the image was resized to a size of 128 ×
128 pixels.
4.2 Model Construction
The model used to perform the classification is based
on a 2-dimensional convolutional network (Figure 1
b) since it is a type of network widely used in medical
imaging (Anwar et al., 2018).
In particular, the model is made up of 5 con-
volutional layers interspersed with Normalization,
Dropout and Maxpooling layers.
DMDH 2025 - Special Session on Data-Driven Models for Digital Health Transformation
814

Table 1: Hyperparameters and values considered.
Hyperparameter Description Evaluated Values
Neurons Dimensionality of the output space; number
of output filters in the convolution.
128, 64, 32
Number of epochs Number of epochs to train the model. 10, 20
Batch size Number of samples per gradient update. 8, 16, 32, 64
Optimizer Algorithm used to decrease loss by tuning pa-
rameters and weights for better accuracy.
adam
Loss Function used to evaluate a candidate solu-
tion.
Binary Cross-Entropy
Dropout rate Probability of dropping a node during an iter-
ation.
0.15, 0.2
Last activation Activation function of the last layer. Sigmoid
In the Figure 2, the layers that compose each con-
volutional block are visible. In particular, we can no-
tice that each block is made up of a convolutional
layer followed by a normalization layer and a dropout
layer; after the first, third and fifth blocks, we find a
pooling layer.
Thus, the model was subjected to optimising the
hyperparameters that characterize it using Talos tech-
nology
2
. Talos automates hyperparameter tuning in
deep learning models, allowing researchers and de-
velopers to explore various hyperparameter combina-
tions using search methods such as grid search and
random search. Talos lets you easily set up a series of
hyperparameter experiments, run them, and analyze
them to find the best configuration.
In addition to the convolutional network built
specifically for the analysis, a pre-trained VGG16
(provided by Keras
3
) network was also tested to eval-
uate the performance of a state-of-the-art model using
the dataset in question.
4.3 Explainability Task
The explainability task is built on the application of
the GradCam technique. Both the CNN model and
the predictions are sent as input. GradCam generates
a heat map to locate the regions most influencing the
model predictions in chest MRI scans related to Fabry
disease.
As shown in the Figure 1 c represents the Grad-
CAM map for a diseased subject. In particular, we can
see the region that significantly influences the classifi-
cation of Fabry disease, which is highlighted in green.
2
https://autonomio.github.io/talos last visit: April 2025
3
https://keras.io last visit: April 2025
5 EXPERIMENTAL
DESCRIPTION
The adopted dataset and experiment settings will be
described in the following paragraphs.
5.1 Dataset
To validate the constructed model, a real dataset was
used, whose data were collected at the Azienda Os-
pedaliero Universitaria Policlinico Riuniti di Foggia,
Italy.
The data are related to 31 cardiac patients divided
into 17 men with an average age of approximately
40.65 years and 14 women with an average age of
47.79 years.
Of these 31 patients, 13 have cardiac involvement
in Fabry disease, so they are labelled as positive in the
analysis, while 18 patients do not have a correlation,
so they are marked as negative.
Some patients had multiple visits over the years,
so they were considered multiple times. Considering
that each scan can have a variable number of slices in-
side it, downstream of the slice extraction phase, we
have a total of 1621 images, from which 260 images
were removed because they were blurry and 28 be-
cause they were dark; therefore, the resulting dataset
is composed of 1333 grayscale images with a size of
288 x 288 pixels.
As for the data augmentation task, starting from
each image another one was generated using one of
the techniques, randomly chosen, mentioned in the
previous paragraph 4.1. In this way, the final dataset
used for the analysis is composed of 2666 images.
5.2 Experiment Setting
The experiments aim to evaluate the performance of
the proposed approach.
Explainable AI Approach for Cardiac Involvement Detection in Anderson-Fabry Disease
815
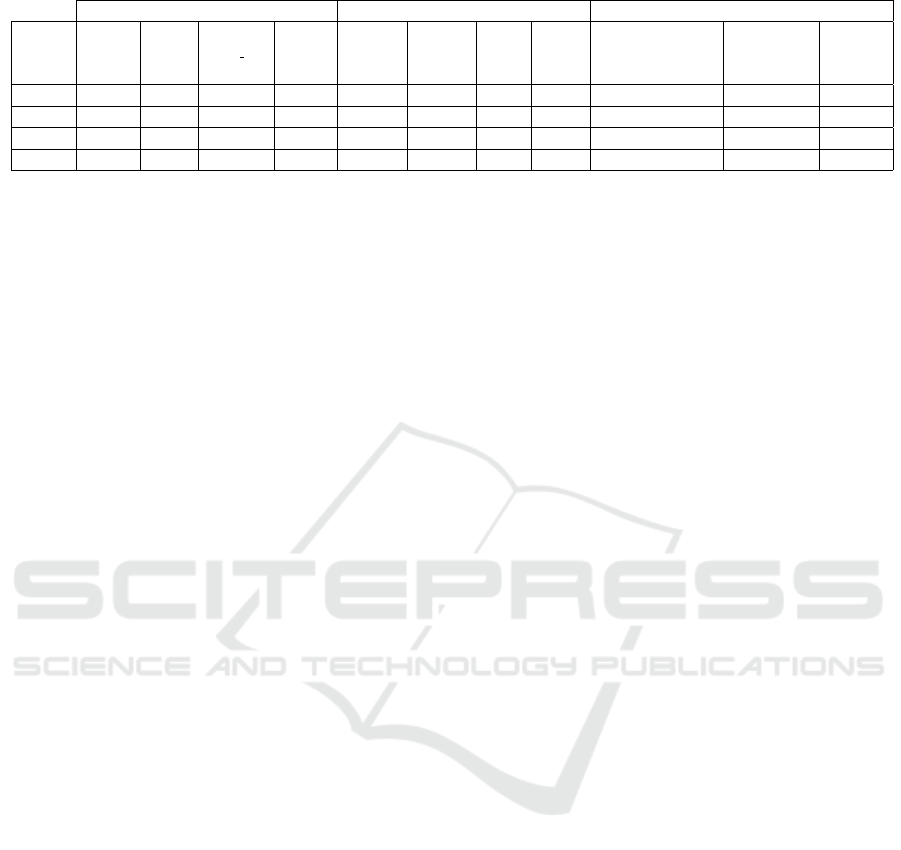
Table 2: Results obtained with hyperparameters optimization and ablative study.
Parameters Metrics Ablative Study
Low Quality
Network Neurons Epochs Batch size Dropout Accuracy Precision Recall F-score Data Augumentation Image Balancing
Removal
CNN 64 20 8 0.15 0.82 0.8082 0.8254 0.8129 yes no no
CNN 32 20 8 0.15 0.8117 0.8003 0.7913 0.7952 yes yes no
VGG16 128 20 8 0.2 0.7194 0.7787 0.7194 0.7037 yes yes yes
CNN 128 10 64 0.15 0.8917 0.9021 0.8917 0.891 yes yes yes
The classification process involves splitting each
considered sub-dataset into training, validation, and
test sets. Specifically, 30% of the dataset is allocated
for testing, while the remaining 70% is further divided
into 70% for training and 30% for validation.
The experiment is structured as an ablative study.
The first analysis concerned the use of the CNN net-
work to apply to the set of images resulting from the
data augmentation operation.
The second analysis adds the component related
to the removal of low-quality images, so after having
removed them, we proceeded to apply the data aug-
mentation operation; the network used in this case is
the same CNN network used before.
Considering the strong imbalance between the
classes, it was decided to apply a subsampling tech-
nique of the majority class so that the model sees the
same number of images for each class without syn-
thetically creating new samples. For this reason, the
third analysis adds this balancing component to the
data, always using the same CNN network.
This same experiment configuration was also
tested with the VGG16 network to obtain a compari-
son with a pre-trained network.
Regarding performance evaluation, the goal is to
assess the efficiency of the proposed classification
process on the considered sub-datasets. The evalua-
tion is conducted using the following metrics: Accu-
racy, Precision, Recall, and F1-score, which are de-
rived from the Confusion Matrix.
Additionally, a hyperparameter optimization step
is performed using Talos, which enables testing all
possible combinations of hyperparameters in a single
experiment. The best model is selected and saved for
future predictions.
The Table 1 outlines the considered hyperparame-
ters and their evaluated values.
The training phase for each classifier was done
twice, and the model with the highest average F1-
score was chosen. In the event of models with iden-
tical F1-scores, the one with the greatest average Ac-
curacy was chosen.
Finally, the experiment attempts to assess the sug-
gested approach’s capacity to deliver right interpreta-
tions using Grad-CAM heatmaps manual reviewed by
a team of specialists.
6 DISCUSSION OF RESULTS
This section shows and discusses the obtained results.
Table 2 reports the results obtained using the CNN
and VGG16 networks after undergoing hyperparame-
ter optimization using Talos.
In particular, the first column indicates the type of
network used, columns 2 to 5 indicate the hyperpa-
rameters that make up the best configuration for the
network being analyzed, the next 4 columns indicate
the validation metrics, and finally, the last 3 columns
indicate the flags related to each task of the ablative
study.
As we can see, the best result is obtained using
all three tasks for the ablative study and the custom
CNN network, reaching an accuracy of 89.1% and a
precision of 90.2%.
In order to further explore the differences in the
behaviour of the two networks considered, the confu-
sion matrices of both are reported relative to the last
configuration of the experiment.
In particular, we note that in the case of the
VGG16 network (Table 3), this presents a large num-
ber of correct predictions for patients with AFD with
cardiac involvement, but on the contrary, it misclassi-
fies many of the patients who do not present cardiac
involvement, leading to significant consequences if it
were used as a decision-making tool for the physician.
A different situation occurs for the confusion ma-
trix related to the CNN network (Table 4); first of
all we can notice that the main diagonal is the most
populated symptom of the fact that the prediction was
much more correct than the previous case, as can also
be seen from the validation metrics calculated starting
from the matrix (Table 2, last row).
We also notice only 5 misclassifications regarding
patients who do not present cardiac involvement; we
can, therefore, conclude that the CNN network is able
to predict the pathology in a more correct and bal-
anced way.
DMDH 2025 - Special Session on Data-Driven Models for Digital Health Transformation
816
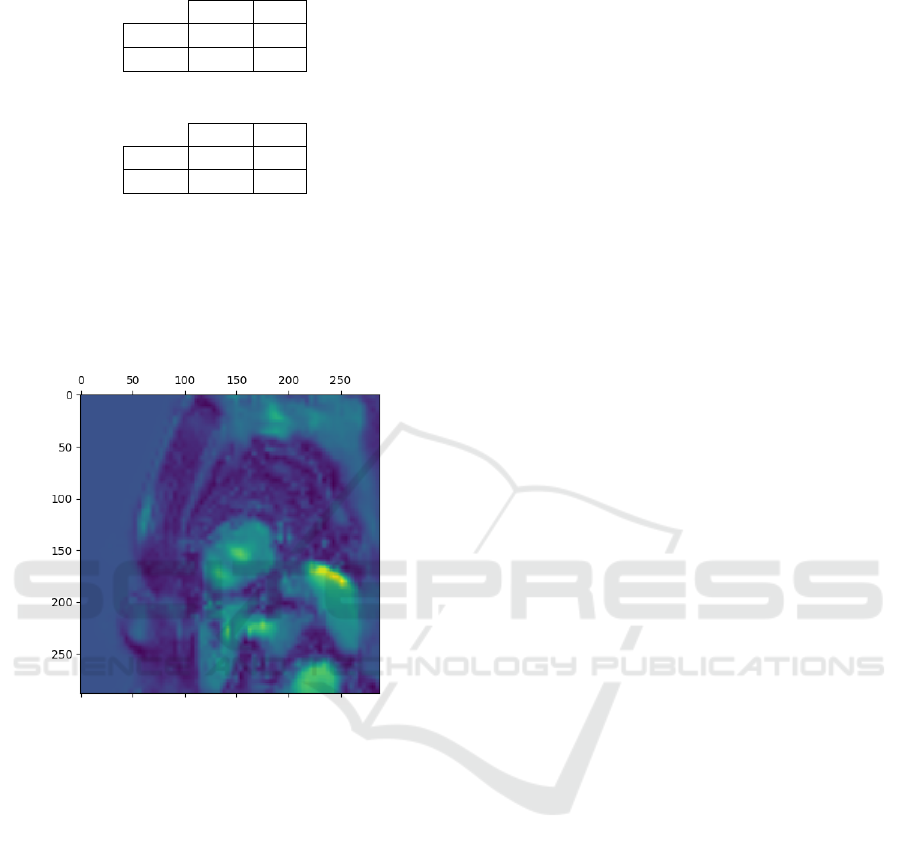
Table 3: VGG16 Confusion Matrix.
AFD HC
AFD 171 9
HC 92 88
Table 4: CNN Confusion Matrix.
AFD HC
AFD 146 34
HC 5 175
In addition to the quantitative measurement of the
model performance, in this study, we also report a
qualitative evaluation analysing the obtained interpre-
tation maps (heat maps) and the feedback of an expert.
A measure, therefore, to better understand where
the model has concentrated most to discriminate the
classes.
Figure 3: Grad-CAM heatmap for a patient with AFD and
cardiac implications.
In Figure 3, we observe an example of a heatmap
for a patient affected by AFD with cardiac involve-
ment obtained by applying the Grad-CAM technique
associated with the best model. In particular, the pix-
els in yellow represent the pixels that assume greater
importance in the model, and we can note that in ad-
dition to highlighting the kidney at the bottom, they
also highlight the cardiac area, indicating cardiac in-
volvement in the AFD pathology. We can therefore
conclude that the model is focusing on the right area
of the image to make its decisions.
7 CONCLUSIONS
The implementation of deep learning-based method-
ologies in the assessment of cardiac involvement in
Anderson-Fabry Disease has shown promising re-
sults. Our study demonstrates that AI-driven analysis
of cardiac imaging can improve diagnostic precision
and contribute to earlier detection of myocardial fi-
brosis. By reducing subjectivity and enhancing repro-
ducibility in image interpretation, these approaches
can help clinicians optimize treatment strategies. The
scope of creating a radiomic model for Native T1
assessment is ambitious, but it can certainly lead to
significant improvements in patient management, re-
ducing gadolinium dependency and providing useful
information for the diagnosis and monitoring of car-
diac diseases. However, it will be essential to de-
velop a robust pipeline that includes accurate segmen-
tation, feature extraction, and clinical validation to en-
sure that the model can effectively replace LGE se-
quences. Additionally, the ability to detect cardiac
abnormalities using non-invasive imaging methods,
such as CMR, could help avoid unnecessary contrast-
enhanced CT scans, improving patient safety and
comfort. Future research should focus on integrating
multi-modal imaging data and refining AI models to
further enhance their clinical applicability. The con-
tinued evolution of AI in medical imaging holds great
potential for improving patient outcomes in rare ge-
netic diseases like AFD.
REFERENCES
Agarwal, M. and Mahajan, R. (2018). Medical image con-
trast enhancement using range limited weighted his-
togram equalization. Procedia Computer Science,
125:149–156.
Almuayqil, S. N., Abd El-Ghany, S., Abd El-Aziz, A. A.,
and Elmogy, M. (2024). Kidneynet: A novel
cnn-based technique for the automated diagnosis of
chronic kidney diseases from ct scans. Electronics,
13(24).
Anwar, S. M., Majid, M., Qayyum, A., Awais, M., Al-
nowami, M., and Khan, M. K. (2018). Medical im-
age analysis using convolutional neural networks: a
review. Journal of medical systems, 42:1–13.
Aversano, L., Bernardi, M. L., Cimitile, M., Iammarino, M.,
Madau, A., and Verdone, C. (2023). An explainable
approach for early parkinson disease detection using
deep learning. Communications in Computer and In-
formation Science, 1875 CCIS:326 – 339. Cited by:
1.
Aversano, L., Bernardi, M. L., Cimitile, M., Montano, D.,
Pecori, R., and Veltri, L. (2024). Explainable anomaly
detection of synthetic medical iot traffic using ma-
chine learning. SN Computer Science, 5(5). Cited
by: 3; All Open Access, Green Open Access, Hybrid
Gold Open Access.
Bai, W., Sinclair, M., Tarroni, G., Oktay, O., Rajchl, M.,
Vaillant, G., Lee, A. M., Aung, N., Lukaschuk, E.,
Sanghvi, M. M., et al. (2018). Automated cardiovas-
cular magnetic resonance image analysis with fully
Explainable AI Approach for Cardiac Involvement Detection in Anderson-Fabry Disease
817

convolutional networks. Journal of cardiovascular
magnetic resonance, 20(1):65.
Chen, M., Fang, L., Zhuang, Q., and Liu, H. (2019). Deep
learning assessment of myocardial infarction from mr
image sequences. IEEE Access, 7:5438–5446.
Denaro, F., Madau, A., Martini, C., and Pecori, R. (2024).
An explainable approach to characterize heart dis-
eases using ecg images. In 2024 IEEE International
Conference on Metrology for eXtended Reality, Arti-
ficial Intelligence and Neural Engineering, MetroX-
RAINE 2024 - Proceedings, page 867 – 872. Cited
by: 0.
Deva, D. P., Hanneman, K., Li, Q., Ng, M. Y., Wasim, S.,
Morel, C., Iwanochko, R. M., Thavendiranathan, P.,
and Crean, A. M. (2016). Cardiovascular magnetic
resonance demonstration of the spectrum of morpho-
logical phenotypes and patterns of myocardial scar-
ring in anderson-fabry disease. Journal of Cardiovas-
cular Magnetic Resonance, 18(1):14.
Fotin, S. V., Yankelevitz, D. F., Henschke, C. I., and
Reeves, A. P. (2019). A multiscale laplacian of gaus-
sian (log) filtering approach to pulmonary nodule de-
tection from whole-lung ct scans. arXiv preprint
arXiv:1907.08328.
Gravina, M., Troise, D., Infante, B., Tartaglia, L., Minop-
oli, B., Allegra, C., Casavecchia, G., Gambacorta,
M., Montanile, C., Mercuri, S., et al. (2024). A
non-invasive technique to unveil renal implications in
anderson–fabry disease. Biomedicines, 12(9):1950.
Litjens, G., Kooi, T., Bejnordi, B. E., Setio, A. A. A.,
Ciompi, F., Ghafoorian, M., van der Laak, J. A., van
Ginneken, B., and S
´
anchez, C. I. (2017). A survey
on deep learning in medical image analysis. Medical
Image Analysis, 42:60–88.
Prencipe, B., Delprete, C., Garolla, E., Corallo, F., Gravina,
M., Natalicchio, M. I., Buongiorno, D., Bevilacqua,
V., Altini, N., and Brunetti, A. (2023). An explainable
radiogenomic framework to predict mutational status
of kras and egfr in lung adenocarcinoma patients. Bio-
engineering, 10(7):747.
Qiao, Y., Zhou, H., Liu, Y., Chen, R., Zhang, X., Nie,
S., Hou, F. F., Zhao, Y., Xu, X., and Zhao, L.
(2025). A multi-modal fusion model with enhanced
feature representation for chronic kidney disease pro-
gression prediction. Briefings in Bioinformatics,
26(1):bbaf003.
Selvaraju, R. R., Cogswell, M., Das, A., Vedantam, R.,
Parikh, D., and Batra, D. (2017). Grad-cam: Visual
explanations from deep networks via gradient-based
localization. In Proceedings of the IEEE international
conference on computer vision, pages 618–626.
Selvaraju, R. R., Cogswell, M., Das, A., Vedantam, R.,
Parikh, D., and Batra, D. (2020). Grad-cam: visual
explanations from deep networks via gradient-based
localization. International journal of computer vision,
128:336–359.
Tøndel, C., Bostad, L., Hirth, A., and Svarstad, E. (2008).
Renal biopsy findings in children and adolescents with
fabry disease and minimal albuminuria. American
journal of kidney diseases, 51(5):767–776.
Torra, R. (2008). Treatment and renal involvement in fabry
disease. Kidney International, 74(Suppl 111):S29–
S32.
Yamashita, R., Nishio, M., Do, R. K. G., and Togashi, K.
(2018). Convolutional neural networks: an overview
and application in radiology. Insights into imaging,
9:611–629.
Zhang, M., Ye, Z., Yuan, E., Lv, X., Zhang, Y., Tan,
Y., Xia, C., Tang, J., Huang, J., and Li, Z. (2024).
Imaging-based deep learning in kidney diseases: re-
cent progress and future prospects. Insights into imag-
ing, 15(1):50.
Zhou, B., Khosla, A., Lapedriza, A., Oliva, A., and Tor-
ralba, A. (2016). Learning deep features for discrim-
inative localization. In Proceedings of the IEEE con-
ference on computer vision and pattern recognition,
pages 2921–2929.
DMDH 2025 - Special Session on Data-Driven Models for Digital Health Transformation
818
