
Process Mining and Machine Learning for Predicting Clinical Outcomes
in Emergency Care: A Study on the MIMICEL Dataset
Antonella Madau
1 a
and Gianfranco Semeraro
2 b
1
Department of Engineering, University of Sannio, Benevento, Italy
2
Department of Computer Science, University of Bari Aldo Moro, Bari, Italy
Keywords:
Process Mining, Healthcare, Machine Learning, MIMICEL, Emergency Departments.
Abstract:
The digitization of organizations and the increasing availability of data generated by Information Systems
(IS) have led to the development of advanced techniques for business process improvement. Process Mining
has emerged as a key discipline bridging the gap between Data Science and Business Process Management
(BPM). In this study, we explore the application of classification techniques on the MIMIC-IV-ED dataset,
which records patient-level event logs during their stay in the emergency department. The proposed approach
starts with process mining to uncover underlying care pathways, followed by thorough data pre-processing
and cleaning to construct a structured dataset suitable for classification tasks. In the final stage, we evaluate
the performance of seven classification algorithms, encompassing both tree-based and boosting methods, to
predict relevant clinical or operational outcomes. Our methodology highlights the synergy between process
mining and machine learning, offering insights into patient flow and decision support in emergency care set-
tings.
1 INTRODUCTION
The healthcare sector encompasses a wide range of
services, infrastructures, and professional expertise
dedicated to the prevention, diagnosis, treatment and
rehabilitation of diseases. Its primary objective is
to promote the well-being of the population through
the provision of effective, accessible, and safe health-
care services. As technology continues to evolve
and information systems become more integrated,
the healthcare sector is increasingly embracing data-
driven methodologies to refine processes and improve
the quality of care delivered to patients.
Healthcare processes consist of a complex series
of activities designed to diagnose, treat, and prevent
diseases, all with the overarching goal of improving
patient health outcomes. These processes can exhibit
significant variability between different healthcare or-
ganizations, covering both clinical and administrative
functions performed by a wide range of profession-
als, including physicians, nurses, technical special-
ists, and administrative personnel. Each of these roles
contributes uniquely to the holistic care of patients.
a
https://orcid.org/0009-0003-2227-9778
b
https://orcid.org/0000-0003-1666-8323
Process mining, a specialized branch of data
mining, seeks to uncover, monitor and optimize
real-world processes through the analysis of event
logs generated by healthcare information systems.
This emerging methodology fosters vital synergy be-
tween data-driven analytical techniques and opera-
tional modeling, providing nuanced insights into the
actual execution of healthcare processes within var-
ious organizations. Using process mining, health-
care facilities can critically evaluate clinical path-
ways, verify adherence to medical protocols, analyze
resource utilization patterns, identify bottlenecks, and
pinpoint opportunities for ongoing improvement(De
Roock and Martin, 2022).
One of the pivotal challenges in hospital man-
agement revolves around patient admissions and the
intricate pathways that patients navigate upon entry
and exit from the emergency department(Xie et al.,
2022). The availability of hospital beds, the challenge
of overcrowding, and the overall effectiveness of the
emergency department are largely dependent on the
optimization of the patient triage and treatment pro-
cesses. Thus, performing a comprehensive analysis
of patient flow through the emergency department is
essential to enhance operational efficiency and miti-
gate critical issues stemming from overcrowding.
Madau, A., Semeraro and G.
Process Mining and Machine Learning for Predicting Clinical Outcomes in Emergency Care: A Study on the MIMICEL Dataset.
DOI: 10.5220/0013653500003967
In Proceedings of the 14th International Conference on Data Science, Technology and Applications (DATA 2025), pages 791-799
ISBN: 978-989-758-758-0; ISSN: 2184-285X
Copyright © 2025 by Paper published under CC license (CC BY-NC-ND 4.0)
791

Data mining techniques prove particularly valu-
able in detecting inefficiencies and bottlenecks
within healthcare processes(Ghasemi and Amyot,
2016). The increasing availability of health data
logs has paved the way for the application of ad-
vanced predictive analytics methods to assess pa-
tient health conditions. By utilizing a broad range
of risk variables—such as temperature and pulse fre-
quency—classification techniques in data mining en-
able a more accurate determination of the likelihood
that a patient will be discharged, admitted to a hospi-
tal ward, or transferred to a different facility.
Machine learning, a dynamic subset of artificial
intelligence, empowers computer systems to enhance
their performance by analyzing historical data and
identifying recurring patterns. This discipline focuses
on the development of algorithms and models capa-
ble of extracting insights from data and applying this
knowledge to predictive and classification tasks, as
for security (Coscia et al., 2024),(Dentamaro et al.,
2021) as well as for healthcare (Gattulli et al., 2023).
The primary categories of machine learning include
supervised learning, unsupervised learning, and re-
inforcement learning. Notably, classification tech-
niques within machine learning are widely utilized in
the healthcare context, as they allow for the assign-
ment of new data to predefined categories based on a
model that has been trained using labeled data. Fol-
lowing the training phase, the model can accurately
predict the class membership of new, unlabeled data
samples, thus aiding clinical decision-making with
enhanced precision and efficiency.
In this study, we delve into the application of
classification techniques using the MIMIC-IV-ED
dataset(Wei et al., 2023), which captures individ-
ual patient activities throughout their journeys in the
emergency department.
The structure of this paper is organized as follows:
Section II discusses related works in the field, Sec-
tion III introduces preliminary concepts essential for
understanding our approach, and Section IV presents
a detailed description of the proposed methodology.
Section V shares and analyzes the experimental re-
sults obtained, while Section VI concludes the study,
laying out potential future directions for research.
2 RELATED WORKS
The healthcare sector is intricate, involving various
stakeholders in care delivery, such as physicians, ad-
ministrators, and patients. Over the years, health-
care systems have increasingly embraced data-driven
methods to enhance care processes, minimize ineffi-
ciencies, and improve patient outcomes. For instance,
research by van der Aalst et al. (2016) (van der Aalst,
2016) explored how process mining can be employed
to model healthcare workflows, highlighting its abil-
ity to discover inefficiencies and support the optimiza-
tion of patient pathways. By analyzing event logs
from healthcare information systems, process min-
ing enables hospitals to evaluate clinical pathways,
ensure compliance with protocols, and optimize re-
source utilization (Aversano et al., 2025b). Data min-
ing and process mining techniques have proven par-
ticularly useful in this regard, offering a means to an-
alyze vast amounts of healthcare data to uncover hid-
den patterns and gain insights into operational pro-
cesses. For instance, the research by van der Aalst et
al. (2016) (van der Aalst, 2016) explored how process
mining can be employed to model healthcare work-
flows, highlighting its ability to identify inefficiencies
and support the optimization of patient pathways.
Several studies have also applied process mining
techniques to analyze patient flow in emergency de-
partments (EDs), ultimately enhancing hospital ef-
ficiency. For example, Rebuge and Ferreira (2012)
(Rebuge and Ferreira, 2012) utilized process mining
to examine patient pathways within an ED, identify-
ing delays in patient processing and assessing the im-
pact of resource availability on throughput. Similarly,
research by van der Heijden et al. (2020) (van der
Heijden et al., 2020) demonstrated that applying pro-
cess mining to ED operations can significantly im-
prove patient flow management, helping hospitals re-
duce bottlenecks and enhance triage processes. These
approaches are essential for optimizing resource allo-
cation and ensuring timely patient care, particularly
in high-demand settings such as emergency depart-
ments.
Additionally, recent work by Aversano et al.
(2025) (Aversano et al., 2025c) introduced innovative
methods for predicting the next activity in healthcare
processes, with a specific focus on the importance of
temporal features. This research emphasizes how pre-
dicting subsequent tasks in patient care can improve
workflow efficiency and enhance overall patient expe-
rience in hospital settings.
Furthermore, Aversano et al. (2025) (Aversano
et al., 2025a) proposed a machine learning-based ap-
proach to repair missing activity labels in healthcare
logs, which can significantly improve the accuracy of
process mining models. Their work offers a solution
to a common issue in healthcare process logs, where
incomplete or missing data can otherwise hinder the
effectiveness of process analysis.
Beyond process mining, machine learning (ML)
is increasingly being used in healthcare as a powerful
DMDH 2025 - Special Session on Data-Driven Models for Digital Health Transformation
792

tool to improve clinical decision-making and opera-
tional efficiency. ML algorithms, particularly super-
vised learning models, have shown remarkable poten-
tial in predicting patient outcomes by learning from
historical data. A notable study by Choi et al. (2016)
(Choi et al., 2017) demonstrated the use of ML al-
gorithms to predict patient mortality risk in intensive
care units, illustrating the potential of these methods
to provide real-time decision support for healthcare
professionals. In emergency departments, ML tech-
niques are frequently employed to assess patient risk,
prioritize care, and optimize triage. Similarly, rein-
forcement learning applications have gained traction
in healthcare, particularly in personalizing treatment
protocols based on individual patient responses, as ex-
plored by Topol (2019) (Topol, 2019). The potential
of these advanced ML techniques to support decision-
making in dynamic and high-pressure environments,
such as emergency departments, is significant.
The combination of process mining and machine
learning in healthcare systems offers significant po-
tential for enhancing patient care and operational effi-
ciency.
3 APPROACH
This section details the approach, providing infor-
mation on the dataset, the features model, and the
methodology adopted,initially introducing fundamen-
tal concepts of process mining.
3.1 Preliminaries
Process mining aims to enhance real-world processes
using event data, which is typically stored in event
logs. These logs capture details of completed pro-
cess instances, with each event representing a specific
step within the process. Key attributes associated with
each event include a case ID (which identifies the pro-
cess instance), an activity name (which specifies the
action performed), and a timestamp (indicating when
the event occurred). Additional details may also be
included, such as the resource that was responsible
for the activity.
In the context of an emergency department, a
case corresponds to a single patient stay, which is
identified by a unique stay ID. Each event records
a specific activity during that stay, such as when
a patient arrives. These events are characterized
by attributes including the case ID, activity name,
timestamp, and both static and dynamic attributes
(for example, patient identifier, body temperature,
and heart rate). Analyzing these event logs provides a
comprehensive view of the patient’s journey through
the emergency department, offering valuable insights
to optimize care processes. An event is formally
defined as follows:
Definition 1. (Event) An event is a tuple
(a, c, t, ⟨(d
1
, v
1
), . . . , (d
m
, v
m
)⟩), where a is an ac-
tivity name, c is a case ID, t is a timestamp, and
(d
1
, v
1
), . . . , (d
m
, v
m
), with m ∈ N, are event attribute
name-value pairs. Given an event e, c
e
denotes the
identifier of the case.
Definition 2. (Trace) A trace σ is a finite sequence
of events ⟨e
1
, . . . , e
n
⟩, such that ∀i, j ∈ [1..n], c
e
i
= c
e
j
,
i.e., all events in the trace refer to the same case.
Definition 3. (Event Log) Let E be the universe
of events. An event log is a set L ⊆ E
∗
.
3.2 Dataset
The dataset used to conduct the experiments (MIM-
ICEL) is an event log extracted from the MIMIC-
IV-ED dataset and describes the complete end-to-end
process of a patient’s journey in the emergency de-
partment (ED). This allows for the analysis of exist-
ing patient flows, thereby improving the efficiency of
processes within the emergency department.
The initial file, mimicel.csv, contains 7,568,824
events and 425,028 cases, describing the emergency
department (ED) stays of 205,466 patients, recorded
in the MIMIC-IV-ED dataset (A. et al., 2000). Each
row in the CSV file represents the execution of an
event during an ED stay, while each column corre-
sponds to the specific attributes of that event. Initially,
the dataset contains activities.
Several operations were conducted to transform
the event log into a dataset suitable for machine learn-
ing techniques. As a result, the dataset now includes
389681 row and 18 features. The target variable used
for classification is ”Disposition,” which indicates the
patient’s discharge status from the emergency depart-
ment (ED). This variable encompasses eight possi-
ble values, such as example ”Home” and ”Eloped,”
reflecting different discharge outcomes. The ”dis-
position” variable is essential for classifying patients
based on their final status upon leaving the ED. These
discharge categories are important for understanding
patient flow and the efficiency of ED operations, as
they indicate the level of care or follow-up needed af-
ter the patient’s exit to the ED.
Process Mining and Machine Learning for Predicting Clinical Outcomes in Emergency Care: A Study on the MIMICEL Dataset
793

3.3 Features Model
In this section, the transformation of the event-log to
a tabular dataset related to each patient is described.
The aim was to transform the data in order to have
information to pass to a machine-learning algorithm
to classify the ED path outcome. Each patient ar-
rive to ED after some injuries or accidents or with
some problems and after clinician’s check the patient
can leave or remain in the hospital being admitted to
other departments. The features used in the dataset
describe various types of information recorded at the
time of the patient’s admission to the emergency de-
partment (ED), as well as details regarding the treat-
ments administered during their stay, up until dis-
charge. These features provide a comprehensive view
of the patient’s journey within the emergency depart-
ment, from admission to final disposition. In detail,
the features considered in this study are as follows:
• General Patient Information: This data includes
the patient’s ID, gender, and race.
• Information About Arrival at the Emergency
Department: This indicates whether the patient
was transported by ambulance or arrived indepen-
dently at the emergency department.
• Vital Signs Measurements: Information about
body temperature, heart rate, respiration rate, and
oxygen saturation is recorded to monitor the pa-
tient’s physical condition at the time of arrival and
during treatment. Additionally, blood pressure in-
formation (systolic and diastolic) is also recorded.
• Information on the Cause of Arrival at the
Emergency Department: This describes the rea-
sons and conditions for which the patient was
brought to the emergency department. Specifi-
cally, the level of pain, acuity, and the chief com-
plaint are assessed. Symptoms present are also
recorded. For a more comprehensive understand-
ing, details about the body part involved and the
underlying cause (e.g., falls or accidents) are also
registered under ”body part” and ”cause.”
• Patient Disposition Status: This describes the
patient’s exit from the emergency department.
The ”disposition” variable served as the target
variable for determining the final outcome of the pa-
tient in the emergency department, reflecting their
state upon completing treatment. The values of this
variable show the patient’s status at the conclusion of
their emergency care journey: whether they were ad-
mitted, left without being examined, left against med-
ical advice, passed away, transferred to another facil-
ity, discharged, absconded, or experienced other un-
specified outcomes.
These features provide a comprehensive overview
of the patient’s physical condition, the reasons for
seeking emergency care, and the management of the
patient during their stay, with the goal of analyzing
and improving the efficiency of the treatment process
in the emergency department.
3.4 Proposed Methodology
The proposed approach begins with process mining
analysis, followed by pre-processing and data clean-
ing to create a dataset suitable for classification. In
the final phase, classification is performed using seven
algorithms, which include both tree-based and four
boosting techniques. The analysis is carried out
across four different configurations: initially using
eight classes, which are then reduced to five main
classes. To address the imbalance in the target vari-
able, oversampling techniques are applied in both
cases.
Process Mining Analysis. The process mining
analysis was performed by performing analysis to ex-
trapolate hidden information in the event log. The
analysis was about discovering the Direct-Follow
Graph (DFG) (Van Der Aalst, 2019)(van der Aalst,
2016), in order to highlight the relationship be-
tween activities, and the analysis the relation between
the case’s duration and case’s number of activities.
Direct-Follow Graph is a process model annotation
system with the aims to represent processes as a graph
using as relationship between activities the ”direct
follow” relation i.e. there is an arc between two ac-
tivities a and b only if exists at least one trace where
b occurs directly after a (example of a possible trace
⟨start, ..., a, b, ..., end⟩).
Discovering DFG helps to understand the de-
scribed behaviour by the event-log. Considering the
variants -i.e. the different order of events that can be
repeatedly recorded by an event-log - it was also dis-
covered the DFG considering the top variants, in order
to discover the most frequent trace recorded by the
event-log. A further step was represented by under-
standing the relationship between the case’s duration
and number of activities. The aim was to understand
if there was a change in the cases and to extract in-
sight.
Classification. To classify the discharge status of
patients from the emergency department (ED), a vari-
ety of classifiers were evaluated to identify the most
effective model. Specifically, both tree-based models
and ensemble methods were considered. Tree-based
models operate by recursively splitting the data into
DMDH 2025 - Special Session on Data-Driven Models for Digital Health Transformation
794

smaller subsets, forming a hierarchical tree structure
where nodes represent decision rules and branches
represent outcomes. In contrast, ensemble methods
combine multiple weak models to create a stronger
classifier.
The following classifiers were assessed:
• Decision Tree (DT): A decision tree is a sim-
ple, interpretable model that constructs a tree-like
structure where each node represents a decision
rule, and each branch corresponds to a possible
outcome. This recursive process continues until
the data is divided into increasingly homogeneous
subsets, ultimately leading to a decision at the leaf
nodes. Although decision trees are highly trans-
parent, they are susceptible to overfitting when the
data is complex (Quinlan, 1986).
• Random Forest (RF): Random Forest improves
upon decision trees by creating an ensemble of
multiple trees. Each tree is trained on a random
subset of the data, which helps reduce the model’s
sensitivity to noise and increases its generalizabil-
ity compared to a single decision tree. Random
Forests are widely used for their robustness and
accuracy in handling diverse datasets(Breiman,
2001).
• Extra Trees (EXT): Extra Trees is similar to Ran-
dom Forest but differs in its construction of trees.
It selects random splits from the features, and
each tree is built using random samples from the
dataset without replacement. This added ran-
domness increases the flexibility and speed of the
model while reducing the likelihood of overfitting
(Geurts et al., 2006).
• Gradient Boosting (GB): Gradient Boosting is an
ensemble technique where each model in the se-
quence attempts to correct the errors made by the
previous one. Initially, weak models (with low
accuracy) are created, but as the sequence pro-
gresses, each new model improves upon the last.
This iterative correction process results in a highly
accurate final model. Gradient Boosting is partic-
ularly effective in tasks that require high predic-
tive precision (Friedman, 2001).
• eXtreme Gradient Boosting (XGB): XGBoost is
a more sophisticated version of Gradient Boost-
ing that incorporates optimization techniques like
regularization and parallel processing to enhance
the model’s speed and accuracy. It has gained
widespread popularity due to its exceptional per-
formance in structured data tasks [(Chen and
Guestrin, 2016).
• CatBoost (CB): CatBoost is another boosting
algorithm that specializes in handling categori-
cal features more effectively than other boost-
ing methods. It builds a sequence of decision
trees, optimizing the loss function by adjusting
the weights of the trees. CatBoost is known for
its ability to handle large datasets and categorical
variables with minimal preprocessing (Dorogush
et al., 2018).
• AdaBoost (AB): AdaBoost (Adaptive Boosting)
creates a sequence of weak models, where each
new model focuses on correcting the mistakes
made by the previous one. Like Gradient Boost-
ing, AdaBoost aims to improve the model’s accu-
racy, but it does so by assigning higher weights
to misclassified data points (Freund and Schapire,
1997).
These classifiers were selected for their diversity of
approaches, all rooted in tree-based methods and en-
semble learning. By comparing their performance,
the objective was to determine the most suitable
model for predicting patient discharge outcomes in
the emergency department.
4 EXPERIMENTAL SETTING
This section outlines the operations performed to pre-
pare the dataset for machine learning techniques and
the parameters and the metrics used for classification.
Initially, the clinical event log was transformed into a
structured dataset, where each row represents a sin-
gle patient and each column corresponds to a rele-
vant feature collected during their length of stay to the
emergency department. Unique case identifiers (case
IDs) were removed because they do not provide infor-
mative value for machine learning and may introduce
bias into the models.
The following preprocessing steps were taken to
clean, normalize, and convert the data into a format
suitable for training:
• Semantic Normalization of Clinical Text Vari-
ables: Based on the chief complaint column (the
reason for the emergency department visit), three
informative dimensions were extracted and stan-
dardized: the reported symptoms, the body part
involved, and the primary clinical cause. These
variables often contained heterogeneous values,
including synonyms or alternative expressions for
the same concept. A semantic mapping process
was used to standardize the entries. For example:
”hypertension” and ”high blood pressure” → Hy-
pertension, - ”hypotension” and ”low blood pres-
sure” → Hypotension , ect. This process was ex-
tended to all textual columns to reduce dimension-
Process Mining and Machine Learning for Predicting Clinical Outcomes in Emergency Care: A Study on the MIMICEL Dataset
795

ality and improve semantic consistency across the
dataset.
• Outlier Detection and Removal: Extreme and
implausible values (e.g., heart rate or blood pres-
sure readings exceeding 900) were identified and
removed from the dataset.
• Temperature Normalization: Body temperature
values were reported in both Fahrenheit and Cel-
sius. All measurements were converted to Cel-
sius, and unrealistic values were excluded.
• Pain Level Standardization: Subjective pain
descriptions (e.g., ”mild,” ”moderate,” ”severe,”
”unbearable”) were converted to numeric values
on a scale from 0 to 10 through semantic mapping,
allowing the pain level to be treated as a continu-
ous numerical variable
• Handling Missing Values: A comprehensive
analysis of missing or null values was conducted.
Observations with missing values in critical vari-
ables were removed to ensure dataset quality and
model robustness.
After thorough cleaning, transformation, and nor-
malization, the final dataset was saved in a structured
format (CSV), ready for training and evaluation of
predictive models.
For the classification phase, a total of four exper-
iments were conducted: two experiments using the
original target variable with eight classes and two
experiments using a reduced version of the target
variable with five classes. Since the target variable
had a high degree of class imbalance, the Synthetic
Minority Oversampling Technique (SMOTE) method
(Chawla et al., 2002)(Chawla et al., 2002) was ap-
plied in all experiments. SMOTE addresses class im-
balance by generating synthetic samples for the mi-
nority classes. It does this by interpolating between
existing instances and their k-nearest neighbours, cre-
ating new plausible data points and improving the
model’s ability to generalize without simply dupli-
cating existing entries. Before applying any balanc-
ing technique, the distribution of the target variable
was as follows: HOME with 229,465 instances, AD-
MITTED with 137,782 instances, TRANSFER with
6,463 instances, LEFT WITHOUT BEING SEEN
with 5,847 instances, LOOPED with 541 instances,
OTHER with 2,905 instances, LEFT AGAINS MED-
ICAL ADVICE with 1,745 instances and EXPIRED
with 62 instances. This highly skewed distribution re-
quired robust balancing to ensure fair representation
and learning across all categories. In the last two ex-
periments, the original eight categories were consol-
idated into five larger classes to reduce sparsity and
improve model interpretability. Despite the improved
distribution, a significant imbalance remained. There-
fore, SMOTE was reapplied to ensure a more even
distribution of classes and to improve model perfor-
mance on minority labels.
For model evaluation, the Hold-Out validation
method was used to split the dataset in 80% for train-
ing and 20% for testing. This partitioning allows
the model to be evaluated on unseen data, providing
a more reliable estimate of its generalization perfor-
mance.
The model’s performance was assessed using the
following metrics: Accuracy represents the percent-
age of correct predictions out of the total number of
observations. It is useful in balanced datasets but may
be misleading in cases of class imbalance; Precision
indicates the proportion of true positive predictions
among all instances predicted as positive. This metric
is particularly relevant when the cost of false posi-
tives is high; Recall measures the proportion of actual
positive cases correctly identified by the model. This
is especially important when missing positive cases
can have serious consequences (e.g., in medical diag-
noses); F1-Score is the harmonic mean of precision
and recall, providing a balanced metric even in im-
balanced contexts. It is useful when a compromise
between precision and recall is required.
5 RESULTS
In this section, the results of the proposed analysis are
presented and discussed.
The event log is about events that occur in an
ED department. The recorded behaviour is related
to the patient’s arrival, the check of their vital con-
ditions, the assignment of medicine and the outcome
of the journey in the ED: returning home or be-
ing admitted to the hospital. The DFG represent-
ing the total event-log is represented in Figure 1.
Such representation highlights some characteristics
of the recorded behaviour: ”medicine reconciliation”
and ”medicine dispensation” are two activities often
recorded multiple times within a single case. Fur-
thermore, such behaviour is similar for ”vital sign
check” and ”discharge from ED”. Indeed, during a
journey in a hospital, it is possible to receive multiple
”vital signs checks” and multiple medicines. From
Figure 1 it is possible to notice self-loops at the ac-
tivities that are recorded several times ‘Vital Sign
Check’, ‘Medicine Dispensation’, ‘Medicie Recon-
ciliation’ and ‘discharge from ED’. This feature was
investigated by extrapolating a descriptive table of
statistics regarding the presence or absence of activ-
DMDH 2025 - Special Session on Data-Driven Models for Digital Health Transformation
796
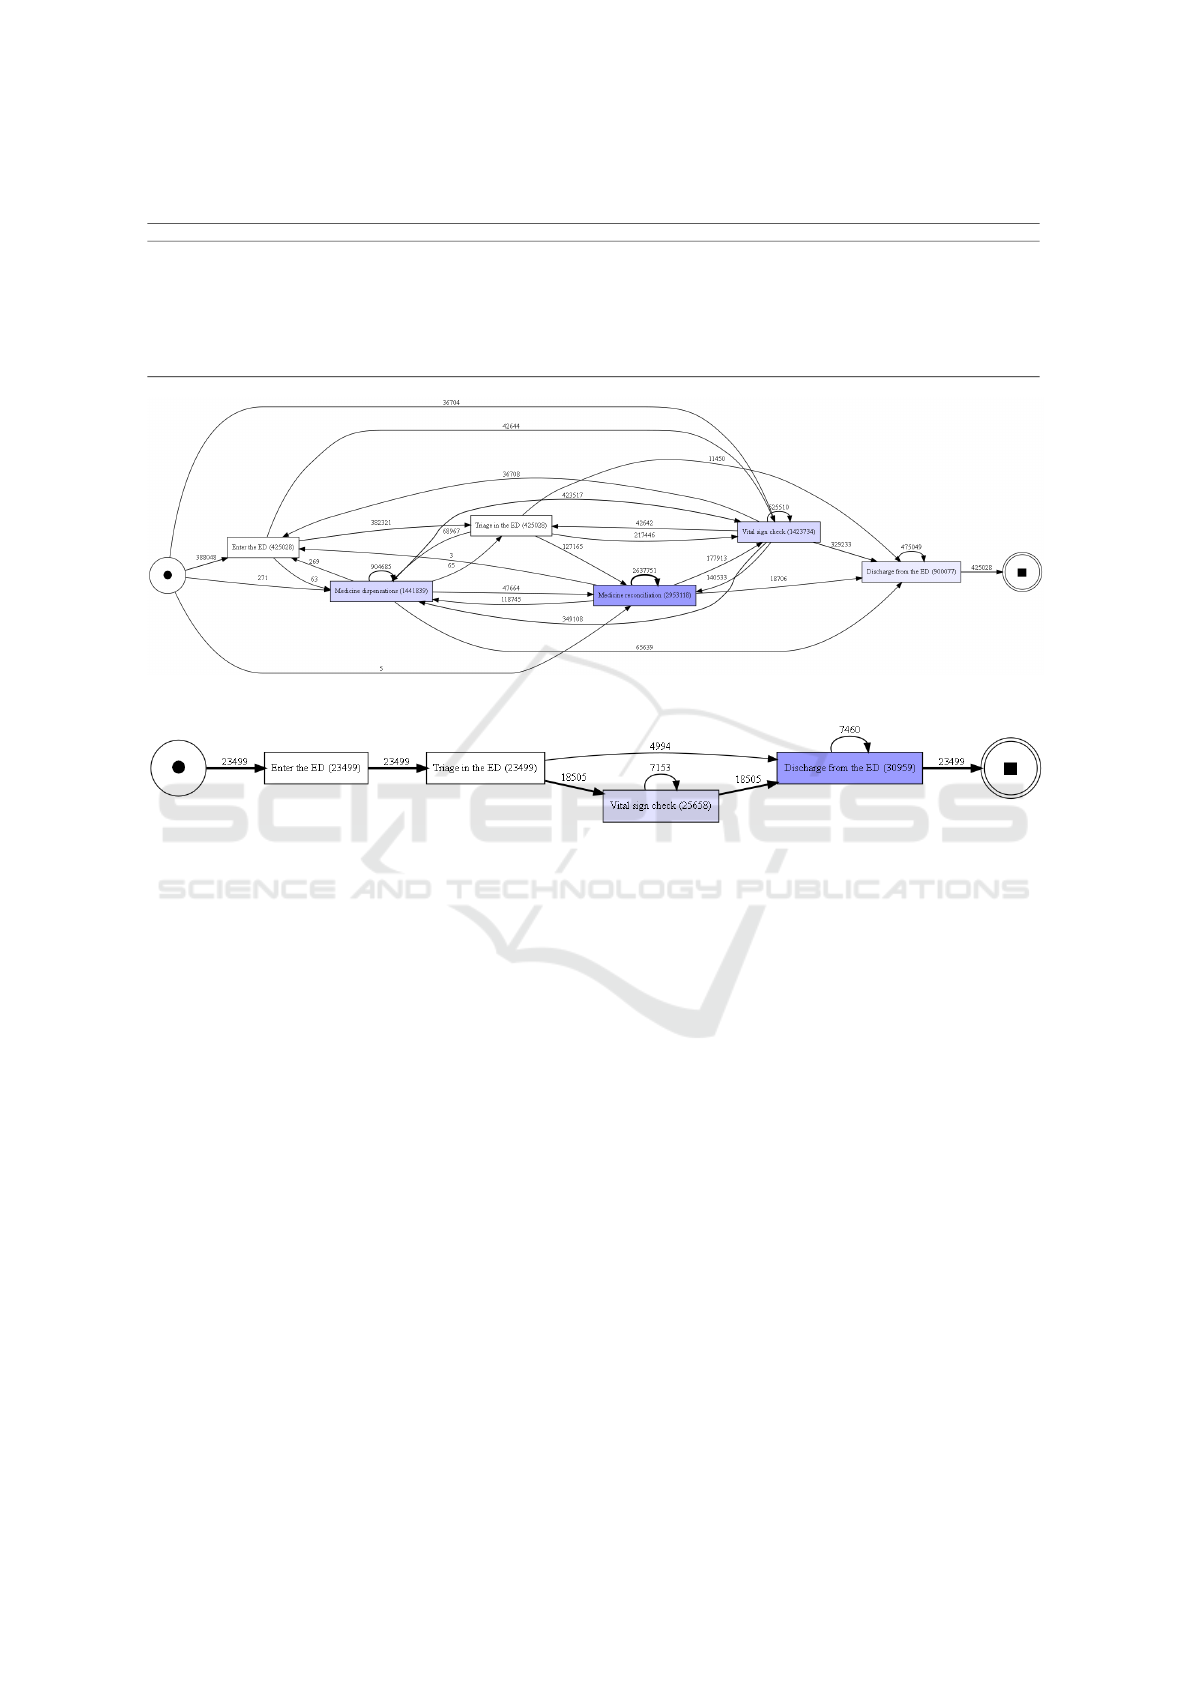
Table 1: Statistics about the presence of an event in the trace.
activity Discharge from the ED Enter the ED Medicine dispensations Medicine reconciliation Triage in the ED Vital sign check
count 425028.0 425028.0 425028.0 425028.0 425028.0 425028.0
mean 2.12 1.0 3.39 6.95 1.0 3.35
std 1.25 0.0 4.6 7.94 0.0 3.04
min 1.0 1.0 0.0 0.0 1.0 0.0
25% 1.0 1.0 0.0 0.0 1.0 1.0
50% 2.0 1.0 2.0 4.0 1.0 3.0
75% 3.0 1.0 5.0 11.0 1.0 4.0
max 9.0 1.0 163.0 106.0 1.0 109.0
Figure 1: Direct Follow Graph of the full MIMICEL.
Figure 2: Direct Follow Graph reppresenting the top 5 variants of traces in MIMICEL.
ities within the traces, specifically how much they are
present within the traces and are represented in the
Table 1. It is interesting to note that the activities that
are present in at least every trace are those related to
‘Enter the ED’ , ‘Triage in the ED’ and ‘Discharge
from the ED’. This behaviour is also confirmed by the
representation of the five most frequent variants in the
Figure 2. Indeed, in the Figure 2 it can be seen that
the trace with the shortest length consists, in essence,
of three different activities.
Considering the number of activity labels and the
context of an emergency department, it was interest-
ing to understand the characteristics of the processes.
Hence, it was analyzed the correlation between case’s
duration and traces’ length, resulting in a correla-
tion about 0.4186 indicating a moderate positive cor-
relation. It was excepted due to the type of cases
recorded. Indeed, if a patients remains more time
in ED more medicinal are assigned to the patients.
Subsequently, when examining the duration of cases,
most cases last less than 2 working days (48 hours),
with 97% of cases lasting less than 1 day and 2% last-
ing between 1 and 2 days. The remaining cases last
more than 2 days. Moreover, considering cases last-
ing less than 1 day, they contain an average of 17.24
events with a median of 15 activities. The relative dis-
tribution is shown in Figure 3, showing the length’s
distribution of cases that last less of 1 day.
Exploring cases lasting between 1 and 2 days, it
was found that they contain on average 34.57 events
with a median of 33. Figure 4 helps showing the dis-
trubution of such cases.
Cases lasting more than 2 days contain on aver-
age 53.53 events with a median of 50, represented
in Figure 5 These data show that most EDs resolve
within a relatively short time interval, with a small
but still significant number of events. Interestingly, as
the duration of the case increases, so does the number
of events and, consequently, the probable complexity
and difficulty in understanding the drugs required for
the specific patient.
These data show that most ED cases resolve in a
relatively short period of time, with a small but still
significant number of events. They also highlight the
presence of cases in which the number of activities is
particularly high, up to hundreds of ‘medication dis-
pensing’ and ‘medication reconciliation’ activities.
Now present and analyzes the results obtained
during the classification phase. Specifically, the re-
sults without oversampling achieve a maximum ac-
Process Mining and Machine Learning for Predicting Clinical Outcomes in Emergency Care: A Study on the MIMICEL Dataset
797

Figure 3: Distribution of cases’s length that last less than 1
day.
Figure 4: Distribution of cases’s length that last less than 2
day and more than 1 day.
Figure 5: Distribution of cases’s length that last more than
2 day.
curacy of 73% using the Gradient Booster Classifier
in the first experiment with eight classes, and 75% in
the second case with five categories. The results ob-
tained by balancing the dataset with the oversampling
technique are reported in Tables 2 and 3. Each table
contains seven rows, each corresponding to a classi-
fier used to predict the type of patient discharge from
the emergency department. The columns display the
evaluation metrics of the model.
The results obtained from the classification show
excellent overall performance, but also highlight sig-
nificant differences between the various classifiers,
both in the case of eight classes and five classes.
For the classification with eight classes (Table 2), the
best classifier in terms of accuracy is the Random-
ForestClassifier, with a value of 92.54%, which stands
Table 2: Results of Classification for eight classes.
Classifier Accuracy Precision Recall F1-Score
Decision Tree Classifier 0.8653 0.8605 0.8649 0.8624
RandomForestClassifier 0.9254 0.9239 0.9251 0.9243
ExtraTreesClassifier 0.9241 0.9221 0.9238 0.9225
Gradient Boosting 0.6153 0.6042 0.6152 0.6058
XGBClassifier 0.7368 0.7329 0.7365 0.7319
CatBoostClassifier 0.7432 0.7401 0.7429 0.7391
AdaBoostClassifier 0.466 0.4541 0.4662 0.4574
Table 3: Results of Classification for five classes.
Classifier Accuracy Precision Recall F1-Score
Decision Tree 0.8181 0.8147 0.8185 0.8163
RandomForest 0.8858 0.8847 0.8861 0.8851
ExtraTrees 0.8863 0.8846 0.8866 0.8851
Gradient Boosting 0.7085 0.7057 0.7087 0.7055
XGBC 0.7744 0.7723 0.7746 0.772
CatBoost 0.7769 0.7748 0.7771 0.7748
AdaBoost 0.6435 0.6445 0.6436 0.6423
out clearly compared to the other models. This re-
sult is also reflected in the other evaluation metrics,
such as precision (92.39%), recall (92.51%), and F1-
Score (92.43%), indicating solid predictive capabil-
ity with a good balance across the metrics. The Ex-
traTreesClassifier, which achieved 92.41% accuracy,
follows closely but does not reach the performance of
the RandomForestClassifier.
In the case of the classification with five classes
(Table 3), the results are slightly lower compared
to the eight-class case. In this scenario, the Ex-
traTreesClassifier achieved the best accuracy value
of 88.63%, followed by the RandomForestClassifier
with 88.58%. Although the results are still very good,
it is evident that classification with five categories
does not yield the same high performance as in the
case with eight classes.
In conclusion, it can be observed that the Random-
ForestClassifier and ExtraTreesClassifier are the mod-
els that achieved the best performance in both config-
urations.
6 CONCLUSIONS
This study explored the combined application of Pro-
cess Mining and Machine Learning techniques to an-
alyze patient pathways within an emergency depart-
ment, using the MIMIC-IV-ED dataset. The Pro-
cess Mining analysis, through the visualization of
the Direct-Follow Graph, highlighted typical activ-
ity sequences and their interrelationships, providing
a clear overview of operational processes. The corre-
lation analysis between case duration and trace length
suggested a moderate positive relationship, consistent
with expectations in an emergency context where case
complexity can influence both the length of stay and
the number of interventions.
DMDH 2025 - Special Session on Data-Driven Models for Digital Health Transformation
798

Subsequently, the classification phase, aimed at
predicting the outcome of emergency department vis-
its, demonstrated the effectiveness of various Ma-
chine Learning algorithms. Specifically, the Random-
Forest and ExtraTrees classifiers consistently showed
the best performance, both in the configuration with
eight outcome classes and the reduced five-class ver-
sion. These results emphasize the potential of us-
ing pre-processed clinical data and machine learning
techniques to develop accurate predictive models in
healthcare settings.
Despite the promising performance achieved, fu-
ture research could further explore the integration be-
tween insights derived from Process Mining (e.g.,
bottlenecks or process variability) and the features
used in Machine Learning models. This could help
improve predictive capacity and provide more contex-
tualized information to support clinical and manage-
rial decision-making in the emergency context.
REFERENCES
A., G., L., A., L., G., J., H., C., I. P., and E., M. R. S. H.
(2000). Physiobank, physiotoolkit, and physionet:
Components of a new research resource for complex
physiologic signals. PhysioNet.
Aversano, L., Iammarino, M., Madau, A., Montano, D., and
Verdone, C. (2025a). Repairing missing activity la-
bels in healthcare process logs: A machine learning
approach. In Innovation in Medicine and Healthcare
(KES InMed 2024), pages 91–101. Springer.
Aversano, L., Iammarino, M., Madau, A., Pirlo, G., and
Semeraro, G. (2025b). Process mining applications
in healthcare: a systematic literature review. PeerJ
Computer Science, 11:e2613.
Aversano, L., Iammarino, M., Madau, A., Pirlo, G., and
Semeraro, G. (2025c). What time is it? finding which
temporal features are more useful for next activity pre-
diction. IEEE Open Journal of the Computer Society,
6:261–271.
Breiman, L. (2001). Random forests. Machine Learning,
45(1):5–32.
Chawla, N. V., Bowyer, K. W., Hall, L. O., and Kegelmeyer,
W. P. (2002). Smote: Synthetic minority over-
sampling technique. Journal of Artificial Intelligence
Research, 16:321–357.
Chen, T. and Guestrin, C. (2016). Xgboost: A scalable
tree boosting system. In Proceedings of the 22nd
ACM SIGKDD International Conference on Knowl-
edge Discovery and Data Mining, pages 785–794.
ACM.
Choi, E., Bahadori, M. T., Kulas, J. A., Schuetz, A., Stew-
art, W. F., and Sun, J. (2017). Retain: An interpretable
predictive model for healthcare using reverse time at-
tention mechanism.
Coscia, A., Dentamaro, V., Galantucci, S., Maci, A., and
Pirlo, G. (2024). Progesi: a proxy grammar to enhance
web application firewall for sql injection prevention.
IEEE Access.
De Roock, E. and Martin, N. (2022). Process mining in
healthcare – an updated perspective on the state of the
art. Journal of Biomedical Informatics, 127:103995.
Dentamaro, V., Convertini, V. N., Galantucci, S., Giglio,
P., Palmisano, T., Pirlo, G., et al. (2021). Ensemble
consensus: An unsupervised algorithm for anomaly
detection in network security data. In ITASEC, pages
309–318.
Dorogush, A. V., Ershov, V., and Gulin, A. (2018). Cat-
boost: Gradient boosting with categorical features
support. In 2018 IEEE International Conference on
Data Mining (ICDM), pages 660–669. IEEE.
Freund, Y. and Schapire, R. E. (1997). A decision-theoretic
generalization of on-line learning and an application
to boosting. Journal of Computer and System Sci-
ences, 55(1):119–139.
Friedman, J. H. (2001). Greedy function approximation: A
gradient boosting machine. The Annals of Statistics,
29(5):1189–1232.
Gattulli, V., Impedovo, D., Pirlo, G., and Semeraro, G.
(2023). Handwriting task-selection based on the anal-
ysis of patterns in classification results on alzheimer
dataset. In DSTNDS, pages 18–29.
Geurts, P., Ernst, D., and Wehenkel, L. (2006). Extremely
randomized trees. Machine Learning, 63(1):3–42.
Ghasemi, M. and Amyot, D. (2016). Process mining in
healthcare: A systematised literature review. Inter-
national Journal of Electronic Healthcare, 9:60.
Quinlan, J. R. (1986). Induction of decision trees. Machine
Learning, 1(1):81–106.
Rebuge
´
A. and Ferreira, D. R. (2012). Business process
analysis in healthcare environments: A methodol-
ogy based on process mining. Information Systems,
37(2):99–116.
Topol, E. J. (2019). Deep Medicine: How Artificial Intel-
ligence Can Make Healthcare Human Again. Basic
Books.
Van Der Aalst, W. M. (2019). A practitioner’s guide to
process mining: Limitations of the directly-follows
graph.
van der Aalst, W. M. P. (2016). Process Mining: Data Sci-
ence in Action (2nd ed.). Springer.
van der Heijden, M., Luitse, J. S. K., de Keizer, N. F.,
and Cornet, R. (2020). Process mining in emergency
medicine: A systematic review. Journal of the Amer-
ican Medical Informatics Association, 27(9):1471–
1483.
Wei, J., He, Z., Ouyang, C., and Moreira, C. (2023). Mim-
icel: Mimic-iv event log for emergency department
(version 2.1.0). Accessed: 2025-04-02.
Xie, F., Zhou, J., Lee, J. W., Tan, M., Li, S., Rajnth-
ern, L. S., Chee, M. L., Chakraborty, B., Wong, A.-
K. I., Dagan, A., Ong, M. E. H., Gao, F., and Liu,
N. (2022). Benchmarking emergency department pre-
diction models with machine learning and public elec-
tronic health records. Scientific Data, 9(1).
Process Mining and Machine Learning for Predicting Clinical Outcomes in Emergency Care: A Study on the MIMICEL Dataset
799
