
An Explainable Model for Waste Cost Prediction: A Study on Linked
Open Data in Italy
Lerina Aversano
1 a
, Martina Iammarino
2 b
, Antonella Madau
3 c
, Debora Montano
1,4 d
and Chiara Verdone
1
1
Department of Agricultural Sciences, Food, Natural Resources and Engineering, University of Foggia, Foggia, Italy
2
Department of Information Science and Technology, Pegaso University, Naples, Italy
3
Department of Engineering, University of Sannio, Benevento, Italy
4
Department of Surgery, Medicine, Dentistry and Morphological Sciences with Interest in Transplantology, Oncology and
Regenerative Medicine, University of Modena and Reggio Emilia, Italy
Keywords:
Open-Data, Machine Learning, Explainability, XAI, SHAP.
Abstract:
Artificial intelligence and machine learning models are emerging as essential tools for optimizing municipal
solid waste management and supporting policy decisions. However, transparency and interpretability of these
models’ predictions continue to be major obstacles. Recent advances in Explainable Artificial Intelligence
(XAI) techniques have made it possible to explain specific model decisions and guarantee that the outcomes
are intelligible and useful. Using high-quality Italian open data in the form of Linked Open Data (LOD), this
study investigates the benefits and viability of creating explainable models in italian municipalities. To achieve
this, a method for using connected and open statistical data to create explainable models is provided. Addi-
tionally, a case study is presented, covering four years, in which waste management expenses are predicted
and interpreted using connected data about Italian municipalities, categorizing them into three cost bands.
CatBoost was selected as the predictive model’s algorithm, and the SHAP framework was used to guarantee
the predictions’ transparency. Through transparent and accountable data management, this effort seeks to il-
lustrate how cutting-edge technologies can enhance the sustainability of public programs.
1 INTRODUCTION
Artificial intelligence (AI) is revolutionizing many
industries, demonstrating significant potential in op-
timizing processes, reducing costs, and increasing
decision-making effectiveness (Rashid and Kausik,
2024). The main application areas are healthcare
(Ardimento et al., 2023), transportation (Jevinger
et al., 2024), industry (Aversano et al., 2023), edu-
cation, and public administration (Kalampokis et al.,
2021), each of which benefits from AI’s ability to ana-
lyze large amounts of data, identify complex patterns,
and provide accurate predictions. In public adminis-
tration, AI drives innovation to improve public ser-
vices, optimize resource management, and increase
a
https://orcid.org/0000-0003-2436-6835
b
https://orcid.org/0000-0001-8025-733X
c
https://orcid.org/0009-0003-2227-9778
d
https://orcid.org/0000-0002-5598-0822
transparency. Predictive models are used to prevent
fraud, improve public safety, and optimize adminis-
trative processes.
On the other hand, open data is a key resource
for innovation and digital transformation, thanks to
its ability to make large amounts of information pro-
duced by public institutions, research institutions, and
private organizations accessible and reusable (Park
and Gil-Garcia, 2022). These data, made available
in open and standardized formats, cover a wide range
of areas, including demography, economics, environ-
ment, healthcare, and transportation. Their diffusion
promotes transparency, citizen participation, and the
development of innovative solutions to address social,
economic, and environmental challenges.
The integration of open data and AI offers ex-
traordinary opportunities to extract value from this in-
formation, transforming it into useful knowledge to
support informed decisions and policies (Wani et al.,
2024). Open data provides an essential basis for
446
Aversano, L., Iammarino, M., Madau, A., Montano, D., Verdone and C.
An Explainable Model for Waste Cost Prediction: A Study on Linked Open Data in Italy.
DOI: 10.5220/0013650800003964
In Proceedings of the 20th Inter national Conference on Software Technologies (ICSOFT 2025), pages 446-453
ISBN: 978-989-758-757-3; ISSN: 2184-2833
Copyright © 2025 by Paper published under CC license (CC BY-NC-ND 4.0)

training machine learning models, which require large
amounts of data to identify patterns and generate ac-
curate predictions. Through the use of advanced tech-
nologies, such as Linked Open Data, it is possible to
combine datasets from different sources, creating in-
tegrated information ecosystems that enable new AI
applications.
Explainable artificial intelligence (XAI) adds a
further level of value to the integration of open data
and artificial intelligence, making machine learning
models transparent and interpretable. Through the
use of techniques such as SHAP (Shapley Additive
exPlanations) or LIME (Local Interpretable Model-
agnostic Explanations), it is possible to understand
the contribution of individual factors to model predic-
tions (Dwivedi et al., 2023). This is particularly rele-
vant in contexts such as public administration, where
transparency and trust in decision-making processes
are essential to promote the adoption of innovative
AI-based solutions.
In this study, we explore the creation of XAI mod-
els based on open and linked statistical data, apply-
ing them to the prediction of waste management costs
in Italian municipalities over a period of four years.
The analyzed data include socio-demographic, geo-
graphic, and economic information. Costs were clas-
sified into three bands, and the best model was se-
lected based on the area under the ROC (Receiver Op-
erating Characteristic) curve. Finally, to interpret the
results, the SHAP framework was used to identify the
determining factors for each prediction.
The main objective of this work is to assess the
value and feasibility of using high-quality open gov-
ernment data for the creation of explainable models.
Through the case study on waste costs, we propose
a structured process to exploit open-linked statistical
data, highlighting the potential of these technologies
in supporting informed decisions and more effective
policies.
The rest of the document is divided as follows:
Section 2 reports related works; Section 3 details the
approach used for the case study; Section 4 describes
the characteristics of the experiments conducted, Sec-
tion 5 discusses the results obtained, and Section 6
reports the conclusions.
2 RELATED WORKS
Due to its potential to improve decision-making pro-
cesses and optimize operations across various indus-
tries, integrating AI with open data has garnered in-
creasing attention in recent years. The collected and
standardized data, in particular, provide a crucial re-
source for the demonstration of machine learning
(ML) models and enable the demonstration of useful
insights from complex datasets.
In particular, the use of Linked Open Data (LOD)
has revolutionized the ability to combine information
from heterogeneous sources to create integrated in-
formation ecosystems. Several studies have explored
how LOD can be used to support predictive models
in complex contexts, such as public resource manage-
ment and urban planning (Lnenicka and Nikiforova,
2021). The availability of high-quality open data is
essential to improve the effectiveness of predictive
models and promote data-driven solutions. The au-
thors in (Corea et al., 2023) discuss principle-based
approaches to AI adoption and their impact on the
use of open data in Italy and the EU; while, in (Orusa
et al., 2024) the use of satellite data and geospatial
deep learning techniques to support the distribution
of financial contributions to European municipalities
is explored, proposing an innovative system for public
administrations, which exploits geomatics and remote
sensing to improve resource allocation based on spa-
tial data and advanced technologies.
Therefore, although numerous studies have ex-
plored the potential of artificial intelligence applied to
LODs to improve processes and policies in public ad-
ministration, a growing consensus emerges on the im-
portance of ensuring transparency and interpretability
in the models used. In this regard, numerous studies
focus on the use of Explainable AI (XAI) for LODs in
public administration. Among these, for example, the
study (Kalampokis et al., 2021) examines the appli-
cation of XAI techniques on linked open data, high-
lighting their potential to improve public services and
policies.
Papadakis et al. (Papadakis et al., 2024) explore
how XAI can support transparency and trust in public
sector decision-making, presenting a reference archi-
tecture for AI-based policy development, virtualized
tools for data-driven policy specification and imple-
mentation, and a machine learning framework that en-
ables the creation of transparent and explainable mod-
els. (Karamanou et al., 2022) focuses on the creation
of a predictive model that uses machine learning to
identify variables that influence house prices. The
data used comes from government sources, in par-
ticular the Scottish Statistics Portal. XAI techniques
were applied to make the model transparent and in-
terpretable, allowing users, including policymakers
and citizens, to understand the drivers of the fore-
casts. Our study applies XAI not only to motivate
forecasts, but also to directly drive operational deci-
sions on waste management costs.
Similar to this study, our goal is to develop an
An Explainable Model for Waste Cost Prediction: A Study on Linked Open Data in Italy
447

equally reliable and transparent model but applied to
the context of waste management. In particular, we
intend to use high-quality linked open data, relating
to socio-demographic, administrative, and geograph-
ical information, to build a predictive system capable
of estimating waste management costs in Italian mu-
nicipalities.
In literature, waste cost forecasting is a topic that
has already been addressed. In (Fasano et al., 2021)
a deep learning approach is presented that allows to
precisely identify the critical factors that influence
waste management, providing useful information to
plan more aware interventions and to promote the
transition to a circular economy, including the number
of rooms in residential homes and the year of con-
struction of buildings on waste production. Finally,
Roseck
´
y et al. in (Roseck
´
y et al., 2021) presented
models capable of predicting with good accuracy the
amount of waste generated in specific areas and esti-
mating the percentage of separate and non-separated
collection, identifying demographic variables, eco-
nomic factors, and territorial characteristics as key
factors. These two studies focus mainly on quantita-
tive predictor variables, while our approach also inte-
grates socio-demographic and administrative factors,
offering a qualitative explanation of costs.
Our contribution to the field is the use of XAI ap-
proaches into municipal solid waste management pre-
diction models. While prior research has mostly con-
centrated on creating models to predict waste genera-
tion and optimize management strategies, our method
seeks to address one of the primary drawbacks of
these studies: the results’ lack of transparency and
interpretability. Our work attempts to give thorough
explanations of the elements influencing model pre-
dictions using XAI tools like SHAP. In addition to
increasing public administrators’ and stakeholders’
confidence in the outcomes, this makes it possible to
pinpoint the crucial factors that should be addressed
in order to maximize management tactics.
3 APPROACH
This section describes the approach followed to carry
out the experiments, covering the data used, the clas-
sifiers, and the explainability method applied.
3.1 Data
To provide a comprehensive overview of Italian mu-
nicipalities, we utilized real data on waste costs (mea-
sured in kilograms per inhabitant) and waste man-
agement practices. Our analysis focused on four key
Table 1: Distribution of features.
Group Number of features
Waste Cost 11
Waste management 20
Socio-demographic 8
Income 38
Geographic Information 8
areas: Waste cost and cost distribution, Waste man-
agement and collection, including separate waste col-
lection, Socio-demographic data such as population
size and gender distribution, Income data reflecting
the economic status of citizens and Geographic infor-
mation regarding the municipalities locations.
The data were integrated to offer a detailed and
comprehensive representation of each municipality’s
waste management landscape. Data span the years
2019, 2020, 2021, and 2022, including a total of 6,437
municipalities, representing a significant percentage
of the total of 7,904 Italian municipalities
1
. All data
is publicly accessible.
The dataset comprised 19394 instances, with 85
features categorized into 5 groups, as illustrated in Ta-
ble 1.
The information relating to waste costs comes
from the Waste Registry, organized in a National Sec-
tion at the Higher Institute for Environmental Protec-
tion and Research (ISPRA
2
) and Regional Sections
or the Autonomous Provinces of Trento and Bolzano,
coordinated by the Regional Agencies for Environ-
mental Protection and the Autonomous Provinces. IS-
PRA has implemented the National Section through
an advanced IT system, known as the Telematic
Catasto, which provides a complete, constantly up-
dated, and easily consultable knowledge framework
regarding waste management.
The analyzed data outlines the management of ur-
ban waste and the total cost per capita, calculated
based on the following components: CRT(Costs of
collection and transportation of unsorted urban waste,
CTS (Costs of treatment and disposal of unsorted
urban waste), CRD (Costs of collection and trans-
portation of sorted urban waste),CTR(Costs of treat-
ment and recycling of sorted urban waste), CSL(Costs
of street sweeping and washing) and CC (Common
costs), which include: CARC - Operating costs for the
management of tariffs and relations with users, CGG
- Management costs relating to both personnel not
directly employed and the share of structural costs,
CCD - Costs relating to the share of bad debts and
COAL - Includes the share of operating costs of the
territorially competent bodies, of ARERA and local
1
//www.istat.it/storage/ASI/2022/Sintesi.pdf
2
//www.catasto-rifiuti.isprambiente.it/index.php?pg=
ICSOFT 2025 - 20th International Conference on Software Technologies
448

charges. For the waste management group, the con-
sumption values in tons are based on the cadastral ori-
gin and consider differentiated collection types, such
as Glass, Aluminum, Plastic, etc.
The assessment of income characteristics included
both the source of income—such as pensions, self-
employment, or rental income from properties—and
the level of income, which was categorized into var-
ious bands ranging from less than 10,000 euros to
over 120,000 euros. This approach provides a com-
prehensive overview of the economic situation of cit-
izens. The data was taken from the website of the
Italian government, in particular from the Ministry of
Finance
3
.
The analysis included not only cost data but also
detailed socio-demographic information. Specifi-
cally, it examined the demographic composition, fo-
cusing on the distribution of the population by gen-
der, with particular attention to the number of men
and women living in each municipality. Additionally,
the population was analyzed by age groups, catego-
rized into four main intervals: young people (up to 25
years), adults (26 to 50 years), middle-aged individu-
als (51 to 75 years), and the elderly (over 75 years).
In parallel, geographical information
4
was col-
lected regarding the surface area and population den-
sity of each municipality. Furthermore, the geograph-
ical position was assessed in terms of the munici-
pality’s belonging to the Italian macro-areas: North,
Center, or South, and whether or not the municipality
belongs to the group of small municipalities
5
, con-
tributing to a complete and detailed representation of
the territorial and demographic characteristics.
The variable used for classification is the total
cost of waste per inhabitant, which has been cate-
gorized into three distinct levels: low, medium, and
high costs. Based on all the information previously
described, the final dataset comprises a total of 85 fea-
tures and 19394 instances.
3.2 Predictive Model
The study evaluated several machine learning algo-
rithms to identify the best-performing model based
on the area under the ROC curve. The classifiers
tested included Random Forest, Extra Trees, XG-
Boost, Decision Tree, CatBoost, AdaBoost, and Gra-
dient Boosting. Each uses different ensemble or
boosting techniques to improve predictive accuracy,
with some (like CatBoost and XGBoost) offering ad-
3
https://www1.finanze.gov.it/finanze/analisi stat/
public/index.php?opendata=yes
4
https://esploradati.istat.it/databrowser/
5
//www.anci.it/atlante-dei-piccoli-comuni/
vanced features such as handling categorical data and
regularization.
These different algorithms provide a comprehen-
sive set to tackle complex classification tasks by lever-
aging unique strengths and addressing different chal-
lenges in data modeling and forecasting.
3.3 Explainability
Explainable artificial intelligence (XAI) is an emerg-
ing field in machine learning that aims to make AI
models more interpretable and understandable for hu-
mans. The primary objective is to open the ”black
box” nature of AI by providing transparent expla-
nations of how these models operate. This trans-
parency not only facilitates a better understanding of
the decision-making process but also aids in feature
selection by identifying which attributes significantly
influence predictions. This approach clarifies how
each feature, in addition to those related to costs, con-
tributes to the target variable, providing a clear picture
of their respective impacts.
In this study, we utilized the Shapley Additive Ex-
planations (SHAP) method which offers a theoreti-
cal framework for interpreting the logic behind model
predictions. SHAP calculates the average marginal
contribution of each feature across all possible fea-
ture combinations, providing a detailed overview of
the role each attribute plays for every instance in the
dataset. By approximating the impact of a feature on
a model’s output, SHAP enables explanations of pre-
dictions without the need to rerun the model on all
combinations of features.
The method involves calculating Shapley values
for each input feature, which are then applied to every
instance in the dataset. This allows for both a granular
analysis of individual instances and a broader under-
standing of feature behavior. Shapley values ensure
an equitable distribution of prediction contributions
across all features.
Their specific mathematical formulation is:
g(z
′
) = φ
0
+
∑
φ
j
z
′
j
(1)
in which g represents the explanatory model,
z
′
∈
{
0, 1
}
M
make up the coalition vector, where M is the maxi-
mum coalition size. Additionally,
φ
j
∈ R
represents the feature attribution for a given feature j,
denoting the Shapley values.
These values indicate the individual contribution
of each input variable to the model’s predictions for
An Explainable Model for Waste Cost Prediction: A Study on Linked Open Data in Italy
449

specific examples in the test set. This analysis is cru-
cial for understanding not only which variables influ-
ence the forecasts but also the extent of their influ-
ence. In other words, SHAP decomposes the complex
predictions of the model, allowing us to assign spe-
cific importance to each variable in generating every
model prediction.
4 EXPERIMENTAL SETTINGS
This section describes the experimental phases con-
ducted for the analysis and prediction of waste costs
in Italian municipalities. The main objective is to
build a predictive model capable of estimating the
cost of waste management per inhabitant, using socio-
demographic, economic, and geographical data, in
addition to information on collection and disposal
practices. Furthermore, the aspect of the explainabil-
ity of the model is explored in order to interpret the
results obtained and identify the factors that mostly
influence the cost of waste management.
4.1 Prediction of Waste Cost
For the prediction of waste costs, the Hold-out vali-
dation method was used, where the data was split in a
70/30 ratio for training and testing the model, respec-
tively. In this approach, 70% of the data is used to
train the model, while the remaining 30% is reserved
for testing, allowing the model’s performance to be
evaluated on unseen data during the training process.
The metrics used for analyzing the model’s per-
formance include accuracy, precision, recall, F-score,
and ROC (Receiver Operating Characteristic curve).
Accuracy measures the percentage of correct predic-
tions compared to the total predictions made. It is use-
ful as a general indicator of performance, but might
not be sufficient when the classes are imbalanced.
Precision is the ratio of true positives (correctly pre-
dicted as positive) to all positive predictions, indicat-
ing how precise the model is in predicting the posi-
tive class. Recall (or sensitivity) measures the model’s
ability to correctly identify all positive instances, in-
dicating whether the model is capturing all possible
positives. F-score is the harmonic mean of precision
and recall, combining both indicators into a single
measure that balances the two aspects, useful when
classes are imbalanced. ROC curve represents the re-
lationship between the true positive rate (TPR) and
the false positive rate (FPR), providing a useful vi-
sualization for comparing the performance of differ-
ent models, especially in imbalanced class scenarios.
The area under the curve (AUC-ROC) is an important
metric for evaluating the overall ability of the model
to distinguish between the classes.
Finally, the model with the best performance was
chosen based on these metrics, with particular atten-
tion to the ROC, as it provides a more comprehensive
view of the model’s behavior in the presence of imbal-
anced classes. The ROC curve allows us to see how
the trade-off between true positives and false positives
changes as the classification threshold varies, making
it a crucial tool for optimizing model selection. Sub-
sequently, this model was made explainable to bet-
ter understand how the variables influence predictions
and ensure transparency in the model’s decisions.
4.2 Explainability of the Model
A model interpretability study was conducted to ana-
lyze how various characteristics influence the predic-
tions related to waste costs. To achieve this, the SHAP
library was utilized, which assigns a ”contribution”
value to each feature for every prediction made by the
model. The SHAP algorithm operates by analyzing
the model’s predictions based on the input data. It
calculates the contribution of each variable, tracking
how each feature impacts the final result and provid-
ing a clear, interpretable view of the decision-making
process. Initially, the importance of all features in the
dataset was evaluated using a SHAP bar plot. This vi-
sual representation provides a straightforward way to
assess the relative importance of each variable, sorted
by its overall impact on the model.
Next, variables of the costs were removed to
examine how additional information, such as so-
ciodemographic, geographic, income, and waste
collection-related data, influenced the results.
SHAP plots were used to visually analyze the im-
pact of variables on the model. The SHAP Sum-
mary Plot highlighted the most influential features
by showing the distribution and importance of SHAP
values, while the SHAP Dependence Plot illustrated
how changes in individual feature values affect pre-
dictions, offering insights into variable relationships
and interactions influencing waste management costs.
These tools provided a comprehensive under-
standing of how various socio-demographic, geo-
graphic, income, and waste collection-related vari-
ables influence waste costs. This knowledge enables
the identification of key factors and the optimization
of the model to enhance both its predictive accuracy
and interpretability.
ICSOFT 2025 - 20th International Conference on Software Technologies
450
5 RESULTS AND DISCUSSION
This section presents and analyzes the results of
applying the predictive model to waste manage-
ment costs in Italian municipalities. It evaluates the
model’s accuracy, the influence of various features,
and the potential policy implications. The explain-
ability aspect is also explored to understand the con-
tribution of each factor to the cost and to identify crit-
ical issues and areas for improvement. Specifically,
Table 2 shows the baseline results using all initial fea-
tures, with seven classifiers evaluated based on Accu-
racy, Precision, Recall, F-Score, and ROC-AUC met-
rics.
The results indicate a solid overall performance,
with CatBoostClassifier emerging as the best classi-
fier. The following metrics were achieved: Accuracy
= 95%, Precision = 95%, Recall = 85%, F-score =
90%, and ROC = 0.99. These results demonstrate the
model’s high predictive power and optimal separation
between classes. XGBClassifier comes close with an
accuracy of 92% and a ROC-AUC score of 0.98. In
contrast, AdaBoostClassifier exhibits the lowest per-
formance, with an accuracy of 72% and the same F1-
score. Therefore, the CatBoostClassifier was selected
as the primary model for explainability analysis. It
not only showed excellent performance in terms of ac-
curacy but also provided a solid basis to interpret and
analyze its predictions via techniques such as SHAP.
The outcomes of the second phase of the study,
which examines the model’s explainability, are pre-
sented in Figures1, 2.
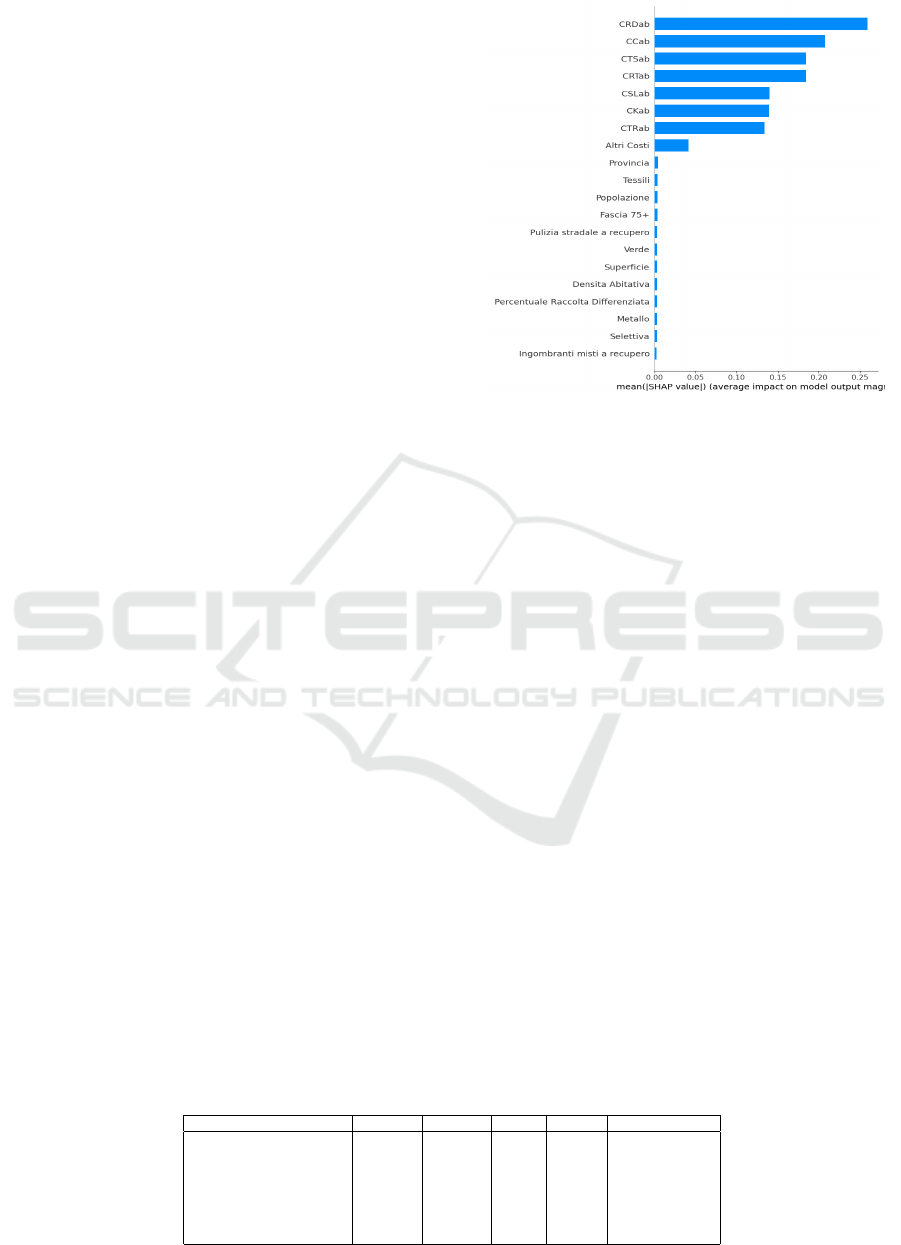
Figure 1 illustrates a horizontal bar chart show-
ing the relative importance of the variables within the
model. Each bar represents a specific variable, with
the length of the bar reflecting the average impact
of the variable on the model’s predictions. Variables
with longer bars indicate a greater influence on the
outcome.
Upon analyzing the chart, it is observed that the
variables CRDab, CCab, CTSab, CRTab, and CSLab
(i.e., those related to costs) have significantly longer
bars compared to the others. This suggests that
these variables play a crucial role in determining the
model’s predictions, emerging as the main drivers of
those predictions.
Figure 1: Bar Plot All.
Thus, the model is heavily influenced by a small
subset of variables, while the other variables, al-
though present in the dataset, have a marginal or neg-
ligible impact on the predictions.
Graph 2 illustrates the impact of the less influ-
ential variables on the prediction after excluding the
most significant ones. In this way, factors that, al-
though not the primary drivers, still play a role in in-
fluencing the model’s predictions are identified. The
features ”Reddito da fabbricati - Euro,” ”Reddito da
lavoro dipendente e assimilati - Euro,” and ”Fascia 0-
25” (referring to the number of citizens aged 0 to 25)
have the highest impact among the remaining vari-
ables and show a significant influence. This suggests
that integrated information related to income and pop-
ulation demographics contributes meaningfully to the
model’s predictions.
Last figures 3, 4,5, present SHAP summary plots
that illustrate the relative impact of various features
across the entire dataset. Each graph refers to a differ-
ent cost class: the first represents the low-cost class,
the second the medium-cost class, and the third the
high-cost class. The variables are ordered according
to their importance, with the most influential ones po-
sitioned at the top. The color of the points indicates
the value of the variable, with shades ranging from
blue for the lowest values to red for the highest values,
Table 2: Results Baseline.
Classifier Accuracy Precision Recall F-Score ROC-AUC Score
RandomForrest 0.8552 0.8557 0.8552 0.8555 0.9615221249
ExtraTrees 0.8177 0.8191 0.7673 0.818 0.9359426579
XGBClassifier 0.9236 0.9245 0.9236 0.9239 0.9888886590
DecisionTree 0.7784 0.7785 0.7784 0.7783 0.8338225201
CatBoostClassifier 0.9495 0.9499 0.9495 0.9496 0.9943761924
AdaBoostClassifier 0.7192 0.7685 0.7192 0.7167 0.8470074004
GradientBoostingClassifier 0.8868 0.8876 0.8868 0.887 0.9759861166
An Explainable Model for Waste Cost Prediction: A Study on Linked Open Data in Italy
451
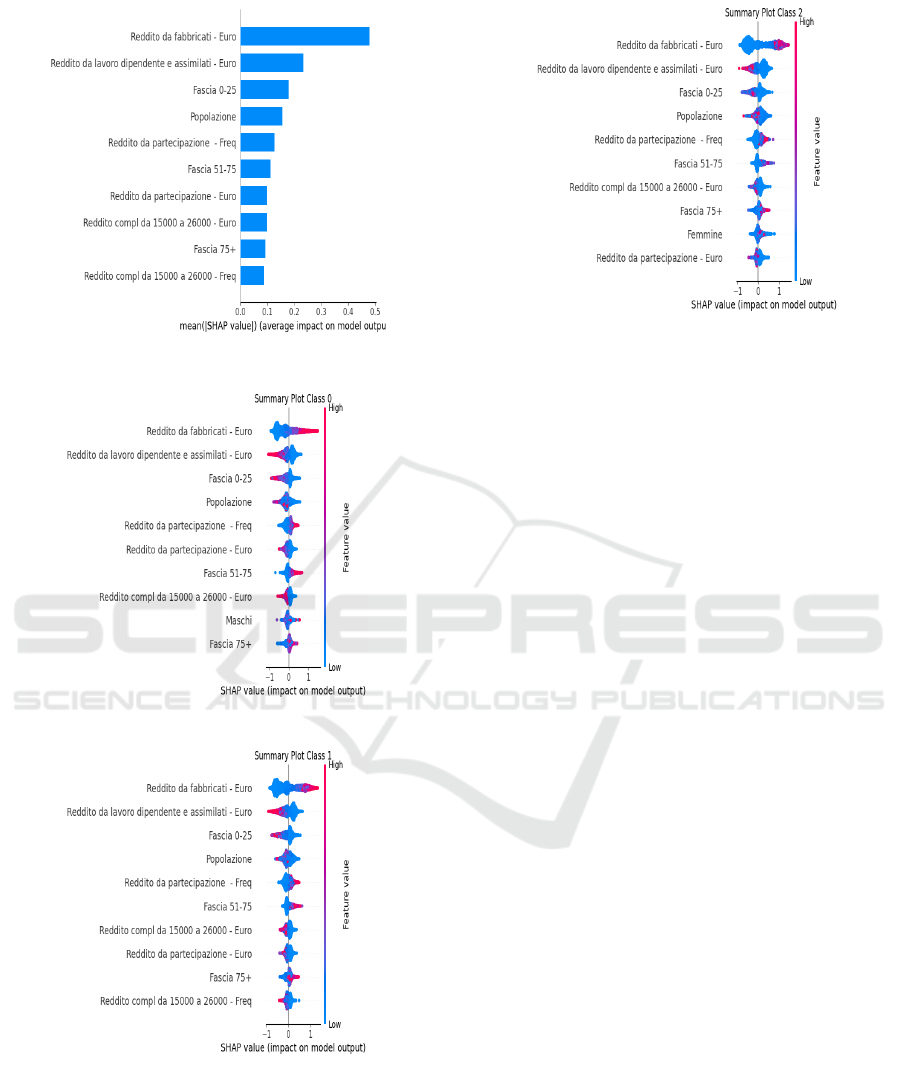
Figure 2: Bar Plot without cost.
Figure 3: Summary Plot low cost
Figure 4: Summary Plot medium cost.
while the horizontal position of each point reflects the
associated SHAP value, determining the variable’s ef-
fect on the model’s prediction.
The analysis of the graphs shows that the income
from buildings and the income from employment in
euros are among the most determining factors for the
Figure 5: Summary Plot High cost.
prediction of the cost of waste, regardless of the class
considered. The population and the distribution of in-
come brackets significantly influence the predictions,
suggesting that municipalities with a greater concen-
tration of citizens with medium or high incomes tend
to fall into the higher-cost classes. It is also noted that
some variables, such as income from participation and
the income of the entrepreneur in simplified account-
ing, have a significant but variable impact depending
on the cost class considered, highlighting a possible
correlation between the type of prevalent income and
waste management expenses.
In the case of the low-cost class, the most im-
pactful variables are closely linked to the population
and the lower income bracket, suggesting that mu-
nicipalities with a prevalence of citizens with lower
incomes tend to have lower management costs. For
the medium-cost class, a greater incidence of over-
all income and distribution among age groups is ob-
served, indicating that socio-demographic factors and
economic distribution play a more marked role. Fi-
nally, for the high-cost class, the model gives greater
importance to higher incomes and the frequency of
specific sources of income, highlighting that munic-
ipalities with a greater presence of wealthy citizens
tend to have higher waste management costs.
Nonetheless, the proposed approach also presents
some limitations. While SHAP improves the inter-
pretability of the predictions, the observed correla-
tions between variables and waste management costs
should be interpreted with caution and not as direct
causal relationships.
6 CONCLUSION
The cost of waste management is a key concern for
local governments, influenced not only by collection
ICSOFT 2025 - 20th International Conference on Software Technologies
452

and disposal processes but also by socio-economic,
demographic, and geographic factors. This study in-
troduces an innovative approach that integrates open
data from official sources (ISTAT, Waste Registry,
Ministry of Finance) to analyze five main aspects:
waste cost per capita, percentage of separate collec-
tion, average income, socio-demographic data, and
geographical characteristics.
The study employed a two-phase methodology:
first, it forecasted waste management costs (catego-
rized as high, medium, or low); second, it analyzed
which variables most influenced these forecasts us-
ing various machine learning models and SHAP for
explainability. Data were sourced from official insti-
tutions to ensure quality. The results offer practical
value for municipalities, enabling more efficient re-
source allocation and tailored interventions. The ex-
plainable model also promotes transparency and data-
driven policymaking. Future efforts will aim to de-
velop a user-friendly decision support tool for public
administrators.
The model achieved excellent classification re-
sults (AUC-ROC of 99%), confirming the value of
integrating socio-economic, environmental, and ter-
ritorial data in analyzing waste management costs.
SHAP analysis identified key influencing factors such
as separate collection rates, average income, popu-
lation density, and geographic location. Notably, a
higher rate of separate collection does not always lead
to lower costs, highlighting that economic, social, and
territorial characteristics play a critical role in deter-
mining waste management expenses.
Overall, these results highlight the advantages
of integrating and analyzing open data to support
waste management policies. An approach based on
multidimensional data can allow administrations to
adopt more targeted and efficient strategies, optimiz-
ing available resources and reducing costs without
compromising the quality of the service. This study
provides useful insights for future research and for the
development of decision-support tools that can help
public bodies and policymakers to improve the sus-
tainability and effectiveness of municipal waste man-
agement.
REFERENCES
Ardimento, P., Aversano, L., Bernardi, M. L., Cimitile,
M., Iammarino, M., and Verdone, C. (2023). Evo-
gunet3++: Using evolutionary algorithms to train
unet-based architectures for efficient 3d lung cancer
detection. Applied Soft Computing, 144.
Aversano, L., Bernardi, M. L., Cimitile, M., Iammarino,
M., and Verdone, C. (2023). A data-aware explain-
able deep learning approach for next activity predic-
tion. Engineering Applications of Artificial Intelli-
gence, 126:106758.
Corea, F., Fossa, F., Loreggia, A., Quintarelli, S., and
Sapienza, S. (2023). A principle-based approach to
ai: the case for european union and italy. Ai & Soci-
ety, 38(2):521–535.
Dwivedi, R., Dave, D., Naik, H., Singhal, S., Omer, R.,
Patel, P., Qian, B., Wen, Z., Shah, T., Morgan, G., and
Ranjan, R. (2023). Explainable ai (xai): Core ideas,
techniques, and solutions. ACM Comput. Surv., 55(9).
Fasano, F., Addante, A. S., Valenzano, B., and Scannicchio,
G. (2021). Variables influencing per capita produc-
tion, separate collection, and costs of municipal solid
waste in the apulia region (italy): An experience of
deep learning. International Journal of Environmen-
tal Research and Public Health, 18(2):752.
Jevinger,
˚
A., Zhao, C., Persson, J. A., and Davidsson,
P. (2024). Artificial intelligence for improving pub-
lic transport: a mapping study. Public Transport,
16(1):99–158.
Kalampokis, E., Karamanou, A., and Tarabanis, K. (2021).
Applying explainable artificial intelligence techniques
on linked open government data. In Scholl, H. J., Gil-
Garcia, J. R., Janssen, M., Kalampokis, E., Lindgren,
I., and Rodr
´
ıguez Bol
´
ıvar, M. P., editors, Electronic
Government, pages 247–258, Cham. Springer Inter-
national Publishing.
Karamanou, A., Kalampokis, E., and Tarabanis, K. (2022).
Linked open government data to predict and explain
house prices: the case of scottish statistics portal. Big
Data Research, 30:100355.
Lnenicka, M. and Nikiforova, A. (2021). Transparency-by-
design: What is the role of open data portals? Telem-
atics and Informatics, 61:101605.
Orusa, T., Viani, A., and Borgogno-Mondino, E. (2024).
Earth observation data and geospatial deep learning
ai to assign contributions to european municipalities
sen4mun: an empirical application in aosta valley (nw
italy). Land, 13(1):80.
Papadakis, T., Christou, I. T., Ipektsidis, C., Soldatos, J.,
and Amicone, A. (2024). Explainable and transparent
artificial intelligence for public policymaking. Data
& Policy, 6:e10.
Park, S. and Gil-Garcia, J. R. (2022). Open data innovation:
Visualizations and process redesign as a way to bridge
the transparency-accountability gap. Government In-
formation Quarterly, 39(1):101456.
Rashid, A. B. and Kausik, A. K. (2024). Ai revolutioniz-
ing industries worldwide: A comprehensive overview
of its diverse applications. Hybrid Advances, page
100277.
Roseck
´
y, M.,
ˇ
Sompl
´
ak, R., Slav
´
ık, J., Kalina, J., Bulkov
´
a,
G., and Bedn
´
a
ˇ
r, J. (2021). Predictive modelling as a
tool for effective municipal waste management policy
at different territorial levels. Journal of Environmental
Management, 291:112584.
Wani, N. A., Kumar, R., Mamta, Bedi, J., and Rida, I.
(2024). Explainable ai-driven iomt fusion: Unrav-
elling techniques, opportunities, and challenges with
explainable ai in healthcare. Information Fusion,
110:102472.
An Explainable Model for Waste Cost Prediction: A Study on Linked Open Data in Italy
453
