
Method for Identification of Individual Flamingos
Based on Movement Logs
Riku Okazaki
1
and Yu Suzuki
2
1
Solution Promotion Department, Otas Co., Ltd., KDX Sendai Honcho Building, 2-3-10 Honcho, Aoba-ku, Sendai, Japan
2
Department of Information and Data Science, Notre Dame Seishin University, 2-16-9 Ifuku-cho, Kita-ku, Okayama, Japan
Keywords: Animal Computer Interaction, Individual Identification.
Abstract: This research aims to enable non-wearing and non-contact identification of individual animals. As an
approach to this goal, we examined the feasibility of an identification method using movement logs, which is
one of the animal behaviors. In this study, flamingos kept in a zoo were targeted. In order to collect the
movement logs of flamingos, we developed a system in YOLO to identify individual flamingos and record
their locations based on videos taken in the zoo's keeping area. In addition, we analyzed the collected
movement logs of multiple individuals using a neural network and found that the movement logs could be
used to detect individuals with higher identification accuracy than random inference for individual
identification. Furthermore, we showed that the location where individuals tend to stay and the posture they
tend to adopt change depending on conditions such as weather (rainy or cloudy) and the time of day (noon
time period). This research indicates the feasibility of identifying individuals by their movements.
1 INTRODUCTION
Researchers examine the age and lifespan of
individual animals in the field of wildlife herpetology
and animal behavior. Animal keepers manage the
health and care of their animals or identify them when
they go missing. Animal identification is important in
the biological study and management of these
animals. Identification methods that involve contact
with the animal or attachment of an instrument are in
widespread use around the world (Silvy, 2012)
(Ahmad, 2022).
The World Organisation for Animal Health
(WOAH) has established five basic principles in
animal welfare, defined as "the physical and mental
state of an animal in relation to the conditions in
which it lives and dies" (WOAH, 2023).
i. freedom from hunger, thirst, and malnutrition
ii. freedom from fear and distress
iii. freedom from physical and thermal discomfort
iv. freedom from pain, injury, and disease
v. freedom to express normal patterns of behavior
Contacting the animal or wearing an instrument for
identification may cause ii through v of these to not
be satisfied. Some previous studies (Silvy, 2012)
(Ahmad, 2022), indicate that contact with animals or
wearing equipment causes “fear”, “distress”,
“physical discomfort”, “pain” or “injury”. In addition,
these factors can cause “disease” and failure to
express “normal patterns of behabiour”. Therefore, it
is necessary to adopt a method that does not interfere
with the animal's body in order to identify individuals
while satisfying the five basic principles.
The goal of this research is to enable non-contact
and non-wearing identification in accordance with the
basic principles of animal welfare. As an approach,
we focus on behavioral features whose effectiveness
has not yet been verified. Among various types of
behavior, behavior that all animals engage in is
migration. Therefore, this study examines the
feasibility of individual identification using animal
movement logs. This paper describes the
development of a system for acquiring movement
logs, and then reports the results of the verification on
the feasibility of individual identification using
movement logs.
438
Okazaki, R., Suzuki and Y.
Method for Identification of Individual Flamingos Based on Movement Logs.
DOI: 10.5220/0013650400003964
In Proceedings of the 20th International Conference on Software Technologies (ICSOFT 2025), pages 438-445
ISBN: 978-989-758-757-3; ISSN: 2184-2833
Copyright © 2025 by Paper published under CC license (CC BY-NC-ND 4.0)

2 EXISTING RESEARCH ON
ANIMAL IDENTIFICATION
WITH PHYSICAL
INTERFERENCE
Individual identification methods involving physical
interference can be broadly classified into three types:
marking, tagging, and embedding. Marking is a
method of placing visual landmarks on the animal's
body. Examples include freeze branding, tattoos and
notching on ears (Silvy, 2012) (Ahmad, 2022).
Tagging is a method of attaching an artifact to the
animal's body that serves as a symbol. Examples
include ear-tags and bands (Silvy, 2012). Embedding
is a method of implanting a microchip or other device
into the body in which bioinformation to be managed
is written.
Walker et al (Walker, 2011) evaluated heart rate,
respiratory rate, and behavior of Steller's sea lions
under general anesthesia when branded with a hot
iron for identification. The results showed that heart
rate and respiratory rate increased and body
movements and tremors increased during branding.
The authors concluded that anesthetized Steller's sea
lions may feel pain during branding.
Lay et al (Lay, 1992) evaluated blood
composition, heart rate, vocal rate, and the difference
between the body temperature at the branding site and
that at the same site opposite the branding site when
calves were subjected to hot-iron branding, freeze
branding, or sham branding at the same temperature
as room temperature for individual identification.
Results showed that plasma epinephrine, a blood
component that increases with psychological stress,
was increased in hot-iron branded calves. Heart rate
was greater in calves that were hot-iron branded or
freeze branded, and calves that were hot-iron branded
or freeze branded vocalized. Differences in regional
body temperatures were reported to be greater
between freeze-branded and hot-iron calves.
Burley et al (Burley, 1982) studied the effects of
the color of plastic tags attached to zebra finches on
reproductive behavior. The authors summarized that
female zebra finches prefer males with red plastic
color bands and tend to avoid light blue and light
green male ones, while male zebra finches prefer
black and pink females and avoid blue and light green
female ones.
Carminato et al. (Carminato, 2011) reported the
presence of a microchip in a tumor surgically
removed from the body of a cat and concluded that
the microchip caused a foreign body reaction,
although very rare, resulting in fibrosarcoma. Thus, it
can be confirmed that implantation can cause disease.
Therefore, it is necessary to use identification
methods that avoid physical interference, since
individual animal identification involving it may not
achieve the basic principles of animal welfare.
3 IDENTIFICATION METHOD
USING BEHAVIORAL
FEATURES
3.1 Comparison of Physical and
Behavioral Features in
Identification
In recent years, AI has begun to be actively used in
non-contact and non-attached identification methods.
There are two main types of AI-based identification
methods: physical feature-based methods and
behavioral feature-based ones.
Methods based on physical features utilize data on
visual features of the animal's body. These include the
identification of sea turtles by the scale patterns on
the sides of their heads by Karun et all (Karun, 2021)
and the identification of chimpanzees using their
faces by Schofield et all. (Schofield, 2019). Basically,
still images or videos are used as training data. In the
case of still images, the input data is used as-is or with
necessary portions cropped. The AI is trained based
on these data to create a classifier for individual
identification. In the case of video, after clipping a
still image for each frame from the video, the same
procedure is used to create a discriminative AI.
Methods based on physical features are limited
because they allow AI to use as training data only a
portion of the moment when individual identification
becomes possible.
In methods based on physical features, individual
identification is based on appearance information,
which is subject to change depending on physical
growth and environmental conditions. When the
appearance of an individual changes, there is a high
possibility that the data that was previously acquired
and used for training will no longer be usable. On the
other hand, in the method based on behavioral
features, individual identification is performed based
on information that reveals the habits, personality,
and customs of the individual. Since these are less
likely to change compared to appearance, the
acquired information can be used for a long period of
time. In addition, there are few studies on individual
identification methods using behavioral features
other than those in the literature (Suzuki, 2021), and
Method for Identification of Individual Flamingos Based on Movement Logs
439
there are no studies that summarize their
effectiveness. Therefore, in this study, we use
behavioral features to identify individuals.
3.2 Behavior Used for Individual
Identification
To explore behaviors that could be used for individual
identification, we first observed behaviors of familiar
animals. As a result, we noticed that some breeding
cats prefer to stay in certain places, and that turtles in
ponds come up to the land to sunbathe at certain times
of the day. Since these phenomena are caused by
movement among behaviors, there is a possibility that
individual animals can be identified based on
movement data. Therefore, in this study, we focus on
“movement logs” among behaviors to identify
individual animals.
3.3 Selection of Animals to Be
Identified
With the cooperation of Yagiyama Zoological Park,
we selected animals for identification in this study.
The criteria for selection were that there must be
multiple individuals of the same species, including
related species; that two or more individuals must be
kept or exhibited in the same space; that all target
animals must move frequently within the space; and
that the animals must not be interested in touching or
destroying the set-up equipment. After selecting
animals that met these conditions, we decided to
conduct this study on flamingos.
The flamingos kept at the zoo are European
greater flamingo (Phoenicopterus ruber roseus),
Chilean flamingo (Phoenicopterus chilensis),
Caribbean flamingo (Phoenicopterus ruber), totaling
17. All but the Caribbean flamingo have a color tag
on their right or left leg to uniquely identify them
within the species. Some European flamingos and
Chilean flamingos have overlapping colors on the left
and right sides of their legs and color tags.
We selected four flamingos for this study. Their
species and tag correspondence are shown in Table 1.
Based on the color of the tag and the left and right
Table 1: Correspondence between flamingo species kept at
the zoological garden and color tags.
S
p
ecies Left Le
g
Ri
g
ht Le
g
European greater flamingo blue none
European greater flamingo none blue
Caribbean flamingo none none
European greater flamingo none black
sides of the legs, we named them “Rblue”, “Lblue”,
“None” and “Rblack”.
4 DEVELOPMENT OF THE
SYSTEM TO OBTAIN
FLAMINGO LOCATION
INFORMATION
4.1 Overview of the System
To achieve the objective of this study, we developed
a system to verify the feasibility of flamingo
identification using movement logs. First, we
captured video of flamingos to obtain movement data.
Next, we created a flamingo detection model using
YOLO. Finally, we recorded location information
from the movement data of each individual flamingo
detected by the model.
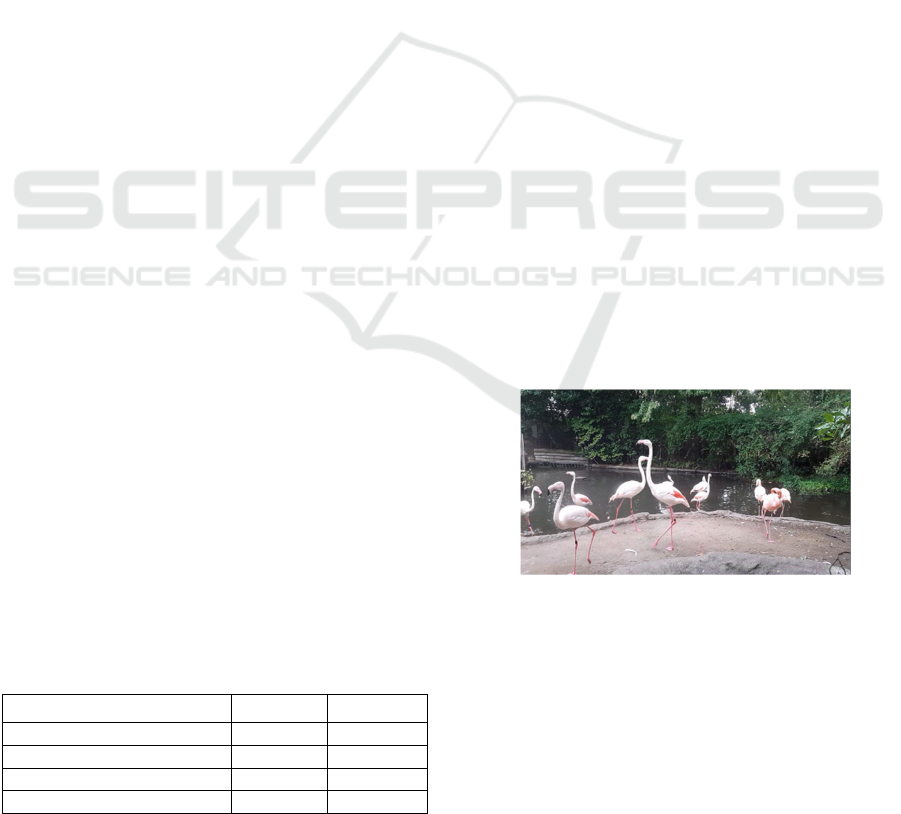
4.2 Collection of Video Data
To obtain flamingo movement logs, We captured
video images from inside the breeding space (Figure
1). We selected the shooting location because it was
easy for flamingos to gather and because it was
possible to shoot from a horizontal angle. We used
Samsung Galaxy A7 as our photographic equipment.
The shooting period was from July 4 to October 22,
2023, from 9:00 a.m. to 5:00 p.m. To prevent thermal
runaway of the equipment, we took video in a cycle
of 30 minutes of shooting followed by 10 minutes of
standby.
Figure 1: Angle of view 4 from inside the breeding space.
4.3 Creation of a Custom Learning
Model for Individual Flamingo
Detection Using YOLO
As a preliminary step to identify individuals using
movement logs, it is necessary to record which
individuals are in which locations in the video.
Therefore, we created a flamingo individual detection
ICSOFT 2025 - 20th International Conference on Software Technologies
440

model using YOLO v8 to automatically record the X
and Y coordinates representing the position. To
generate training data to identify each individual, we
manually linked the position of the flamingo in the
video to the individual. We identified and linked
individuals using color tags attached to the left and
right legs. However, some individuals had
overlapping left and right color tags, making manual
identification difficult, so we annotated only those
individuals for which the left and right leg color and
color tag color were completely unique for all species.
Four of the individuals were frequently seen in the
angle of view of the camera, so we created a training
model for them.
To prepare the annotation, we cut one frame per
second from a 30-minute movie (pixel count:
1920px✕1080px, frame rate: 30fps) and saved each
frame as a jpg file. To avoid running out of memory
during training, we downscaled the number of pixels
to 960px✕540px. For annotation, we used labelImg
and labeled each flamingo as a class. The train data
was annotated based on a total of 4282 images from
the videos of October 11-22, 2023, and the validation
data was annotated based on a total of 3167 images
from the data of September 4-13, 2023. Training was
performed for 100 epochs based on the yolo8n.pt
model, and a custom training model was created.
Figure 2 shows the training results. The six items
from the middle to the left are losses, which indicate
the error between the percentage of correct answers
and the predicted value. If they move to the lower
right, we have achieved good learning. The four items
to the right of the middle are “precision”, “recall”,
“mAP50” and “mAP50-95”. If they move to the
upper right, the learning is good. Learning was
generally good except for “precision,” which
indicates the percentage of true positives out of all
positives. What we did to compensate for the low
“precision” is described below in section 4.5.
Figure 2: Result of the custom learning model. ‘loss’ and
‘precision’ moved to the lower right. ‘recall’, ‘mAP50’ and
‘mAP50-95’ moved to the upper right.
4.4 Extraction of Location Information
We used videos taken between September 20 - 27,
2023 as the original data from which we extracted
location information. To avoid memory shortages
during inference, we downscaled the pixel size from
1920px✕1080px to 960px✕540px. We performed
inference on the data using the custom training model
we created, and saved the results in a CSV file and in
a video file with the Bounding Box added. In the
contents of the CSV file shown in Table 2, “x1”, “y1”,
“x2” and “y2” are the coordinates of the Bounding
Box detected by inference (x1 is the X coordinate of
the left side, y1 is the Y coordinate of the upper side,
x2 is the X coordinate of the right side, and y2 is the
Y coordinate of the lower side). “class” is the class
name of the detected object (0 for Rblue, 1 for Lblue,
2 for None, 3 for Rblack). “confidence” is the
probability that the detected object's ”class” is correct.
In this study, this coordinate data is treated as a
location data set.
4.5 Modification of the Location Data
Set
Figure 2 shows that the “precision” value remained at
a low value around 0.1 even after further training. The
current position data set contains a large amount of
erroneous data. Therefore, it may be difficult to
distinguish true positives from false positives. To
verify the feasibility of individual identification more
Table 2: Example of the contents of a saved CSV file.
x1 y1 x2 y2 class confidence
387.57 176.61 426.84 362.69 none 0.51
82.58 130.03 182.07 419.71 Lblue 0.51
218.10 275.05 271.28 388.94 Rblue 0.58
204.60 290.04 270.67 391.59 Rblac
k
0.65
Method for Identification of Individual Flamingos Based on Movement Logs
441

accurately in the subsequent validation, we
modify the data. It reduces the number of erroneous
data in the location data set.
Comparing the location data set and the saved
video obtained in the previous section, we modify the
data by manually deleting the false positives. The data
to be deleted are those with incorrect class and those
whose errors can be easily identified by the color of
the color tag or by the lack of positional coverage. We
did not perform the procedure to re-label the data
correctly. The number of records after data
examination was 427,252.
5 FEASIBILITY OF LOCATION-
BASED FLAMINGO
IDENTIFICATION
5.1 Hypothesis on the Location of
Individual Flamingos
In this study, we hypothesized that each individual
flamingo tends to stay in a certain location. By testing
this hypothesis, we examine the feasibility of
flamingo identification based on location information.
5.2 Method for Testing Hypotheses
Based on the location data set extracted in Chapter 4,
we will verify whether or not a particular individual
tends to stay within the location shown in the video.
We use neural network (NN) as a verification method.
We added “weather” and “time” to the location data
set to account for possible changes in individual
behavior due to weather and time period effects
(Table 3). “weather” is weather information observed
and published by Japan Meteorological Agency.
During the period under verification, “clear”, “sunny”,
“slightly cloudy”, “cloudy” and “rainy” were
observed. Since the weather information was
announced every three hours from 0:00, we entered
the same weather conditions for the three hours after
the observation time. “time” is the time when the
image was taken. We verify by changing these under
which the number of records vary.
From the items in Table 2, we select the objective
variable as “class” and the explanatory variables from
the other items. Among the explanatory variables, “x1”
and “x2” represent the horizontal position. We
removed “x2” because the correlation coefficient was
0.99, which is an extremely strong positive
correlation and multicollinearity was observed. y1”
and ‘y2’ represent the depth position or orientation.
Since their correlation coefficient was 0.26, we
judged that there was no multicollinearity and
decided to use both as explanatory variables. Since
“confidence” is an item unrelated to location
information, we removed it from the explanatory
variables.
The number of codes in the location data set used
for verification is 631,486. The objective variable
“class” is an integer from 0 to 3. The explanatory
variable “x1” is a number between 0 and 960. “y1” is
a number between 0 and 960. “y2” is a number greater
than 0 and less than or equal to 960.
We judge the results by the value of accuracy,
which represents the correctness rate of the
discriminator when using all the data in the location
data set, both training and validation data, and the
value of val_accuracy when using only the validation
data in the location data set. The number of training
epochs is 100.
5.3 Results of Hypothesis Testing
5.3.1 Results for All Data
The accuracy at the 100th epoch was approximately
0.53, and the val_accuracy was approximately 0.56.
To confirm that there is a significant difference
between the small value of 0.53 and the random
inference value of 0.25, we tested the null hypothesis
that “there is no significant difference between the
percentage of correct answers (0.53) and the random
inference value (0.25)” and tested the difference in
mother proportions. As a result, we were able to show
the correctness of the hypothesis because the p-value
was 0.000049220, a significant difference at a
significance level of less than 1%.
Table 3: Example of location data set plus information on shooting time and weather.
x1 y1 x2 y2 class confidence weathe
r
time
387.57 176.61 426.84 362.69 2 0.51 clea
r
1350
82.58 130.03 182.07 419.71 1 0.51 sunny 950
218.10 275.05 271.28 388.94 0 0.58 cloud
y
1630
204.60 290.04 270.67 391.59 3 0.65 rain
y
1150
ICSOFT 2025 - 20th International Conference on Software Technologies
442

5.3.2 Results with Data by Weather
We verified six patterns of weather. The results are
shown in Table 4. The results show that the highest
accuracy is approximately 0.60 for validation number
6, which indicates rainy weather, and the highest
val_accuracy is approximately 0.64 for validation
number 3, which indicates cloudy weather. In the
same way as for the NN test using all the data, we
confirmed that there was a significant difference
between the accuracy (0.54) for validation number 2,
which had the lowest value, and the random inference
value (0.25), by testing the difference in the mother
proportions. As a result of testing the null hypothesis
that “there is no significant difference between the
percentage of correct answers (0.54) and the random
inference value (0.25),” the p-value was 0.00002731,
showing that there was a significant difference at a
significance level of less than 1%.
5.3.3 Results with Data by Time Period
We verified three patterns of time period. The results
are shown in Table 5. The results show that the
highest accuracy is approximately 0.59 for validation
number 1, which indicates the time period from
morning to noon, and the highest val_accuracy is
approximately 0.63 for validation number 2, which
indicates the time period during the daytime. In the
same way as for the validation using all the data, a test
of difference in proportions was conducted to confirm
that there was a significant difference between the
accuracy (0.58) for validation numbers 2 and 3, which
were the lowest values among the results obtained,
and the random inference value (0.25). As a result of
testing the null hypothesis that “there is no significant
difference between the percentage of correct answers
(0.58) and the random inference value (0.25),” the p-
value was 0.000002182, showing that there was a
significant difference at a significance level of less
than 1%.
5.4 Analysis of Verification Results
Based on the results obtained in the previous section,
we inferred that under certain conditions, the location
at which individuals tend to remain and the position
at which they tend to take up positions may change.
Therefore, in this section, we analyze the tendency of
the position where individuals tend to stay, the
posture they tend to take, and the individuals that can
be identified under each condition. In the weather
verification, the percentage of correct answers was
higher in rainy or cloudy weather. In the time of day
verification, the percentage of correct answers was
higher during noon time period. Therefore, we
analyze the results for these conditions.
We describe the analysis method. First, we
divide the X-coordinate into 10 segments of 96px
each. Next, we measure the number of x1 in the
location data set that fall within the segmented area.
We analyze by finding the first most frequent region
(mode) and the second most frequent region (second
mode) for each individual under each condition, and
comparing them with the mode and second mode of
all the data. After dividing the Y-coordinate by 54px,
we find the mode and the second mode by the same
procedure as for the x-coordinate. Table 6 lists the
number of x1 for each condition of Rblue as an
example of data to support the analysis.
Table 4: Verification results considering weather conditions.
Verification numbe
r
Record count Weathe
r
accurac
y
val_accurac
y
1 43,638 clear, sunn
y
A
pp
rox. 0.58 A
pp
rox. 0.62
2 103,128 clear, sunn
y
, sli
g
htl
y
cloud
y
A
pp
rox. 0.54 A
pp
rox. 0.62
3 213,952 sli
g
htl
y
cloud
y
, cloud
y
A
pp
rox. 0.59 A
pp
rox. 0.64
4 383,615 slightly cloudy, cloudy, rain
y
Approx. 0.55 Approx. 0.57
5 324,125 cloudy, rain
y
Approx. 0.58 Approx. 0.60
6 169,663 rain
y
Approx. 0.60 Approx. 0.62
Table 5: Verification results considering time period.
Verification numbe
r
Record count Time perio
d
accurac
y
val_accurac
y
1 211,339 9:10 - 12:20 Approx. 0.59 Approx. 0.61
2 141,068 11:10 - 13:00 Approx. 0.58 Approx. 0.63
3 215,912 12:20 - 17:00 Approx. 0.58 Approx. 0.61
Method for Identification of Individual Flamingos Based on Movement Logs
443
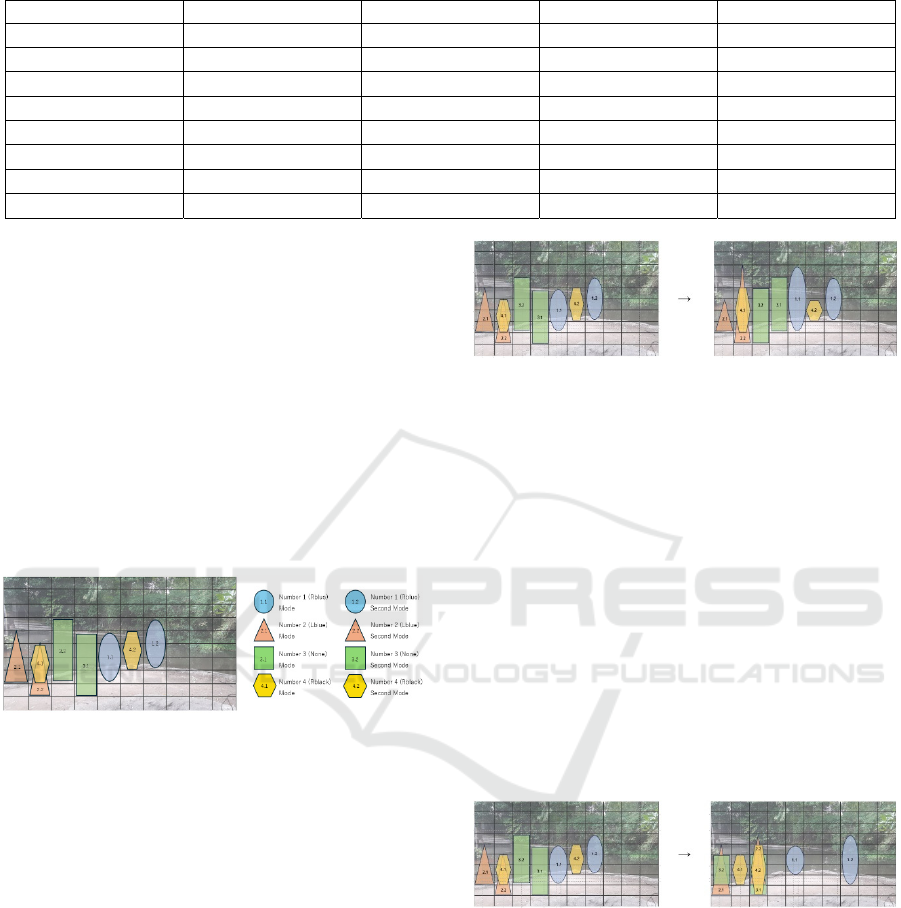
Table 6: Number of x1 in each condition for Rblue.
X-coordinate all cloudy rainy noon time period
0≦x1≦96
1,415 812 551 0
96<x1≦192
4,540 703 2,895 1,233
192<x1≦288
11,957 6,330 5,187 3,851
288<x1≦384
11,701 4,955 6,717 5,262
384<x1≦480
23,513 12,069 8,682 8,982
480<x1≦576
6,648 939 3,084 3,447
576<x1≦672
12,741 6,760 5,841 2,068
672<x1≦768
12,010 2,958 7,465 3,859
5.4.1 Analisis of All Data
Figure 3 shows the distribution of the positions and
postures at which each flamingo tends to stay in all
the data.
Comparing the images of the distribution for all
the data with each condition, we describe the changes
in the position and posture that tend to stay under each
condition. If x1 which is the left edge of the body
changes, it indicates a change in the horizontal
position. If y1 which is the upper edge of the head or
body changes, it indicates a change in the posture that
is easy to take. If y2 which is the toe of the foot
changes, it indicates a change in the vertical position.
Figure 3: The location and posture of each flamingo in all
the data.
5.4.2 Analysis of Cloudy Weather
The left panel of Figure 4 is the distribution of the
most likely positions and postures of individuals for
all data. The right panel of Figure 4 shows them in
cloudy weather. 4 individuals are almost completely
uncovered, so all individuals can be identified when
it is cloudy.
“Rblue” changes easier posture to take. “Lblue”
changes easier posture to take. “none” changes
horizontal and vertical position. “Rblack” changes
easier posture to take.
Figure 4: Comparison of distribution between all data and
cloudy weather. Blue circles are Rblue, red triangles are
Lblue, green squares are None, yellow hexagons are Rblack,
1 decimal place is the mode and 2 is the second mode.
5.4.3 Analysis of Rainy Weather
The left panel of Figure 5 is the distribution of the
most likely positions and postures of individuals for
all data. The right panel of Figure 5 shows them in
rainy weather. Because the distribution of individuals
covers some areas, only some individuals (Rblue and
Rblack) can be identified when it is rainy.
“Rblue” changes horizontal and vertical positions
and easier posture to take. “Lblue” changes horizontal
and vertical positions and easier posture to take.
“none” changes the horizontal and vertical positions.
“Rblack” changes horizontal position and easier
posture to take.
Figure 5: Comparison of distribution between all data and
rainy weather. Blue circles are Rblue, red triangles are
Lblue, green squares are None, yellow hexagons are Rblack,
1 decimal place is the mode and 2 is the second mode.
5.4.4 Analysis in the Noon Time Period
The left panel of Figure 6 is the distribution of the
most likely positions and postures of individuals for
all data. The right panel of Figure 6 shows them
during noon time period. Because the distribution of
individuals covers some areas, only some individuals
(Rblue, Lblue and none) can be identified when using
the data from rainy conditions.
ICSOFT 2025 - 20th International Conference on Software Technologies
444
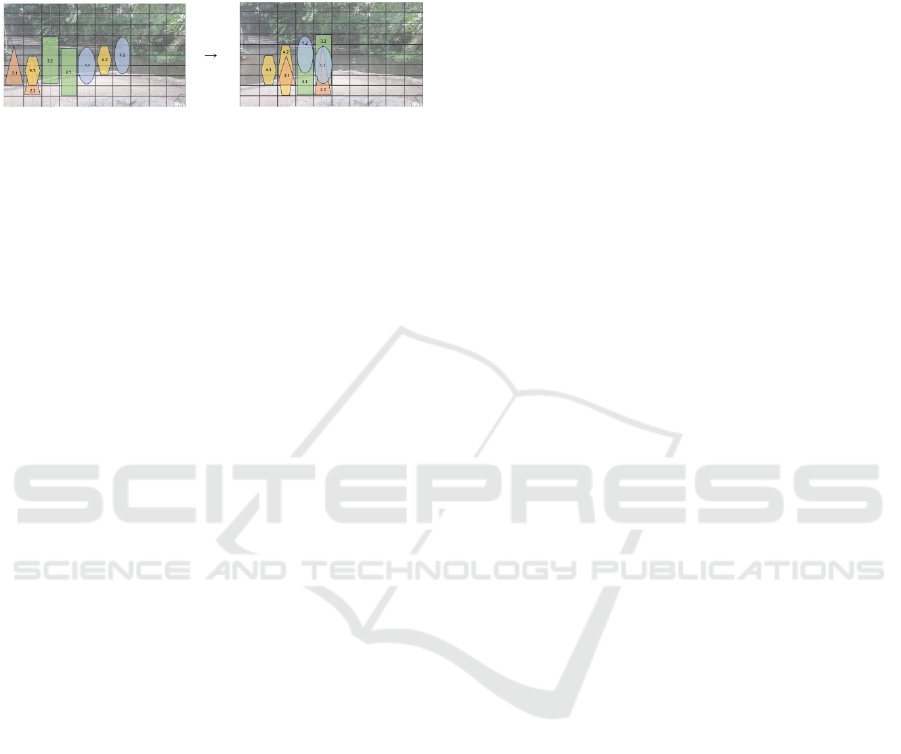
“Rblue” changes horizontal position. “Lblue”
changes horizontal position and easier posture to take.
“none” changes horizontal position. “Rblack”
changes horizontal and vertical positions and easier
posture to take.
Figure 6: Comparison of distribution between all data and
noon time period. Blue circles are Rblue, red triangles are
Lblue, green squares are None, yellow hexagons are Rblack,
1 decimal place is the mode and 2 is the second mode.
6 SUMMARY AND FUTURE
ISSUES
To show the feasibility of individual identification
based on behavioral features of animals, we verified
that individual identification is possible with
movement logs of flamingos. By creating a system to
collect location data set and testing hypotheses using
a neural network, we demonstrated the feasibility of
individual identification based on flamingo location
data. In addition, we were able to show that the
location where each individual tends to stay and the
posture it tends to take change according to each
condition. On the other hand, there is room for
improvement in this study because some data were
detected incorrectly when the location data set was
created by individual detection in YOLO, which may
have affected the accuracy of the data and affected
subsequent validation.
In this study, we identified individual flamingos
using two-dimensional images extracted from videos.
Although it is difficult to obtain three-dimensional
data in a complex natural environment, the method in
this study may be able to obtain data and identify
individuals in such a situation.
There is room for improvement in this study
because the existence of false positive data when
creating the position data set by individual detection
in YOLO may have affected the accuracy of the data,
which may have affected subsequent validation. In
addition, the number of individuals and flamingo
species studied were 4 and 2, respectively, limiting
the generalizability of the findings.
As future tasks, it is necessary to verify the
accuracy of the location data set, to show that other
individuals can be identified using the method in this
study, to show what postures they take under different
conditions, to show that it is possible to identify
individuals by movement for other animals, and to
show that it is possible to identify individual animals
by other behaviors. We will also increase the number
of individuals and flamingo species studied for a
more extensive and longitudinal validation.
ACKNOWLEDGEMENTS
This work was supported by JSPS KAKENHI Grant
Number 22K12112. We would like to express our
deepest gratitude to Yagiyama Zoological Park and
all those involved for their cooperation in obtaining
the necessary data and for their appropriate advice in
conducting this study.
REFERENCES
Ahmad, M., Ghazal, M. T., & Aziz, N. (2022). A survey on
Animal Identification Techniques Past and Present.
International Journal of Computational and Innovative
Sciences, 1(2), 27-32.
Burley, N., Krantzberg, G., & Radman, P. (1982). Influence
of colour banding on the conspecific preferences of
zebra finches. Animal Behaviour, 30, 444‒455.
Carminato A., Vascellari M., Marchioro W., Melchiotti E., &
Mutinelli F. (2011). Microchip-associated fibro-sarcoma
in a cat. Veterinary Dermatology, 22(6), 565-569
Karun K. R., Lars C. G., & Juan, P. M. P. (2021). Daniela
Alarcón-Ruales, Ricardo B. R. Azevedo. Sea Turtle
Facial Recognition Using Map Graphs of Scales. Cold
Spring Harbor Laboratory.
Lay, D. C. Jr., Randel, T. H., Bowers, C. L., Grissom, K.
K., & C., Jenkins, O. K. (1992). Behavioral and
physiological effects of freeze or hot-iron branding on
crossbred cattle. Journal of Animal Science, 70, 330-6.
Schofield, D., Nagrani, A., Zisserman, A., Hayashi, M.,
Matsuzawa, T., Biro D., & Carvalho, S. (2019).
Chimpanzee face recognition from videos in the wild
using deep learning. Science Advances, 5(9), eaaw0736.
Silvy, N. J., Lopez, R. R., & Peterson, J. M. (2012).
Techniques for marking wildlife. The wildlife techniques
manual, 230–257
Suzuki, Y., Osawa, A. (2021). Identifying Individual Cats by
Their Chewing Sounds Using Deep Learning. In
Proceedings of HCI International 2021, 556-560.
Walker, K.A., Mellish, J.E. & Weary, D.M. (2011). Effects
of hot-iron branding on heart rate, breathing rate and
behaviour of anaesthetised Steller sea lions. The
Veterinary Record, Vol.169(14), 363.
WOAH - World Organization for Animal Health Founded as
OIE. (2023, July 18). Terrestrial Code Online Access.
https://www.woah.org/en/what-we-do/ standards/codes-
and-manuals/
Method for Identification of Individual Flamingos Based on Movement Logs
445
