
Prediction of Daily Sales of Individual Products in a Medium-Sized
Brazilian Supermarket Using Recurrent Neural Networks Models
Jociano Perin
a
, Lucas Dias Hiera Sampaio
b
, Marlon Marcon
c
and Andr
´
e Roberto Ortoncelli
d
Postgraduate Program in Informatics, Federal University of Technology, Paran
´
a (UTFPR), Paran
´
a, Brazil
Keywords:
Sales Prediction, Supermarket Sales, Time Series Forecasting, Long Short-Term Memory, Gated Recurrent
Unit.
Abstract:
Accurately predicting daily sales of products in supermarkets is crucial for inventory management, demand
forecasting, and optimizing supply chain operations. Many studies focus on predicting the total sales of large
stores and supermarkets. This study focuses on forecasting daily sales of individual products across various
categories. In the experiments, we used Linear Regression and two types of Recurrent Neural Networks:
Long Short-Term Memory and Gated Recurrent Unit. One of the contributions of the work is the database
used, which is made available for public access and contains daily sales records (between January 2019 and
December 2024) of 250 products in a medium-sized supermarket in Brazil. The results show that the pre-
dictors’ performance varies significantly from product to product. For one semester, the average of the best
25% resulted in a Root Mean Squared Error (RMSE) of 1.55 and a Mean Absolute Percentage Error (MAPE)
of 17.20, and for the average of all products, the best RMSE was 2.12, and the best MAPE was 43.94. We
observed similar performance variations for all analyzed semesters. With the results presented, it is possible
to understand the performance of the predictors in ten semesters.
1 INTRODUCTION
Organizations achieve success by adapting quickly to
changes in their business environment. Accurate and
timely sales forecasting is especially crucial for com-
panies operating in production, logistics, marketing,
trade, and retail (Meulstee and Pechenizkiy, 2008).
For retailers, sales forecast errors can lead to in-
correct stocking of products, reducing profits. A man-
ager’s ability to predict sales patterns that determine
when to order and replenish stocks and plan for future
labor and sales is a significant challenge to increasing
sales and profits in a supermarket (Jeyarangani et al.,
2023)
Data generated from previous sales records are
valuable for predicting upcoming sales. These data
contain significant patterns and information that can
be modeled using a Machine Learning (ML) algo-
rithm, which can accurately predict sales with high
precision. ML has become a significant subfield of
a
https://orcid.org/0009-0006-4936-0615
b
https://orcid.org/0000-0003-1644-3634
c
https://orcid.org/0000-0002-3698-8570
d
https://orcid.org/0000-0001-9622-8525
Data Science that has gained popularity because of
its superior predictive and forecasting abilities. An
ML model must be trained on data to identify pat-
terns from which it can accurately predict future sales
(Chen and Lu, 2017).
Recent work in the literature has explored tradi-
tional machine learning techniques (Almufadi et al.,
2023; Raizada and Saini, 2021) and also time series-
based methods (Jeyarangani et al., 2023; Huo, 2021)
for retail sales forecasting. These works have focused
on predicting total sales volume and presenting results
that could be suitable to aid retailers’ planning.
In contrast, in this study, we focused on forecast-
ing daily sales of individual products. We conducted
a case study using data from a medium-sized super-
market in Paran
´
a, Brazil
1
. Our results show that the
results vary significantly between different products,
highlighting that for some products, we obtained re-
sults that seem adequate, while for most products, the
results are in worse ranges. For the 25% of prod-
ucts with the best prediction results, we obtained, on
average, in a semester, a Root Mean Squared Error
1
According to the Brazilian Supermarket Association,
supermarkets are medium-sized if they have between 5 and
19 checkouts.
Perin, J., Sampaio, L. D. H., Marcon, M. and Ortoncelli, A. R.
Prediction of Daily Sales of Individual Products in a Medium-Sized Brazilian Supermarket Using Recurrent Neural Networks Models.
DOI: 10.5220/0013649800003967
Paper published under CC license (CC BY-NC-ND 4.0)
In Proceedings of the 14th International Conference on Data Science, Technology and Applications (DATA 2025), pages 739-747
ISBN: 978-989-758-758-0; ISSN: 2184-285X
Proceedings Copyright © 2025 by SCITEPRESS – Science and Technology Publications, Lda.
739

(RMSE) of up to 1.55 and a Mean Absolute Percent-
age Error (MAPE) of up to 17.20. Considering the
average for all products we obtained, the best RMSE
was 2.12, and the best MAPE was 43.94 (also for one
semester), with the results worsening considerably in
some experimental instances. We obtained forecast
results close to sales records for some of the products.
Still, the predicted values varied substantially for the
majority, indicating that new studies should be carried
out.
In the experiments, we used three different algo-
rithms to predict the supermarket’s sales volume for
the next day: Linear Regression and two types of Re-
current Neural Networks (RNNs): Long Short-Term
Memory (LSTM) and Gated Recurrent Unit (GRU).
For all training, we trained the predictor with 1 year
of daily sales records for each product and predicted
the sales of that product in the next 30 days. To
carry out the case study, we used daily sales records
(between January 2019 and December 2024) of 250
products from 8 categories (Non-Alcoholic Bever-
ages; Alcoholic Beverages; Cookies, Sweets, and
Snacks; Hygiene and Beauty; Dairy and Cold Cuts;
Cleaning and Household Goods; Basic Grocery; Oth-
ers). Researchers interested in accessing the experi-
mental dataset may contact the last author via email.
We hope the available database and insights based on
the results will motivate new research in the area.
The rest of this paper is structured as follows: Sec-
tion 2 presents the theoretical foundations essential
for understanding this work. Section 3 provides a
comprehensive literature review. Section 4 describes
the experimental database. Details of the conducted
experiment and an analysis of its results are in Section
5. Finally, Section 6 presents the concluding remarks
and suggestions for future research.
2 THEORETICAL ASPECTS
This Section presents fundamental theoretical aspects
for understanding this project. The concept of time
series is introduced in Section 2.1. Section 2.2 de-
scribes Recurrent Neural Networks, a type of Artifi-
cial Neural Network (ANN) designed to make predic-
tions on time series, describing the two main types of
RNN: LSTM and GRU.
2.1 Time Series
A time series is a set of observations made sequen-
tially over time. This means that the data are col-
lected and organized based on specific time intervals,
providing a chronological view of the variations of
the variable being analyzed. Therefore, a time series
comprises variables indexed and ordered by specific
moments in time, denoted by t. Mathematically, a
time series can be represented as a structure X, where
each element X(t) corresponds to the data observed in
the time interval t. This concept allows the analysis of
patterns, trends, and cycles within the data over time,
facilitating an understanding of dynamic behaviors in
various fields, such as economics, meteorology, and
social sciences (Chatfield, 2004).
A time series consists of four fundamental compo-
nents: (i) trend, which captures the long-term move-
ment or overall direction of the data; (ii) seasonality,
representing periodic fluctuations that occur at reg-
ular intervals; (iii) cyclicity, which refers to recur-
rent patterns that do not follow a fixed period; and
(iv) noise, which accounts for random variations and
unexplained deviations in the data (Brockwell and
Davis, 2016).
Time series analysis involves techniques to under-
stand the stationary or non-stationary nature of data
and autocorrelation, which is the correlation of a time
series with its past values. These analyses are funda-
mental to choosing the appropriate forecasting model
or understanding the data’s structure better (Hamilton,
1994).
Traditional time series models, such as ARIMA,
moving averages, and autoregressive models, effec-
tively capture trends and seasonal patterns. Re-
searchers and analysts widely use these models to an-
alyze economic and financial variations due to their
reliability (Wei, 2006).
The advancement of artificial intelligence has led
to the increasing application of ML techniques, such
as RNNs, in time series analysis. These approaches
effectively model non-linear complexities and inter-
actions that traditional methods may fail to capture.
In this project, we predict values in a time se-
ries with three methods: linear regression (Su et al.,
2012), which is a statistical technique used to model
the relationship between a dependent variable and
one or more independent variables, and two types
of RNNs (LSTM and GRU), described in Subsection
2.2.
2.2 Recurrent Neural Network
Traditional ANNs use a few hidden layers (one or
two), but in Deep Learning (DL), the ANN uses
more neurons and hidden layers. DL allows compu-
tational models composed of multiple processing lay-
ers to learn data representations with various levels
of abstraction. DL-based methods have contributed
to drastically improving experimental results, being
DATA 2025 - 14th International Conference on Data Science, Technology and Applications
740

state of the art for different problems (Aldhaheri et al.,
2024; Archana and Jeevaraj, 2024).
RNNs have a structure similar to that of a standard
ANN, with the distinction that connections between
hidden units are allowed, which allows the model to
retain information about the past, allowing it to dis-
cover temporal correlations between events that are
distant from each other in the data (Sherstinsky, 2020;
Pascanu et al., 2013).
An ANN structure comprises an input layer, one
or more hidden layers, and an output layer. RNNs
have an organization similar to a chain of repeated
modules, designed to function as memory units, stor-
ing crucial information from previous processing
phases. These networks include a feedback loop that
allows the output of step t − 1 to be fed back into the
network, influencing the result of step t and, subse-
quently, of each subsequent step (Le et al., 2019).
RNNs perform a backward approach, layer by
layer, from the final output of the network, adjust-
ing the weights of each unit. The information loops
are repeated, which can result in significant updates
to the weights of the neural network model, leading
to an unstable network due to the accumulation of er-
ror gradients during the update process. Therefore,
back-propagation over time is not efficient enough to
learn a long-term dependence pattern due to gradient
vanishing and gradient explosion problems, which is
one of the crucial reasons that lead to difficulties in
training RNNs (Rumelhart et al., 1986; Hochreiter,
1998).
There are variations of RNNs that overcome this
difficulty. LSTM is an evolution introduced to solve
the training problems/challenges of RNNs by adding
additional interactions per module (or cell) (Hochre-
iter and Schmidhuber, 1997). LSTMs are a special
type of RNN, capable of learning long-term depen-
dencies and remembering information for extended
periods.
In addition to LSTMs, researchers use another
type of RNN to overcome the long-term learning
problem: the GRU, which is an optimized RNN based
on LSTM. The cellular structure of a GRU resem-
bles that of an LSTM, but the combines the input and
forget gates of the LSTM into a single update gate
(Santra and Lin, 2019; Chung et al., 2014). The up-
date gate controls how much information from the
previous state is retained in the current state. In con-
trast, the reset gate determines whether to combine
the current state with earlier information (Cho et al.,
2014).
3 LITERATURE REVIEW
Regarding quantitative methods, recent studies have
presented tools based on three main groups of tech-
niques: statistics, traditional machine learning, and
deep learning (Dai and Huang, 2021). ML-based ap-
proaches are usually more powerful and flexible. DL
techniques such as LSTM and GRU have recently
shown competitive results in this application domain.
In (Almufadi et al., 2023), Linear Regression was
used to predict future sales of supermarket branches,
achieving an average absolute percentage error of
27.8%. The authors used a database of 896 records
with the following data: store ID, store area (size),
variety of items available, number of customers who
visited the store, and sales per day.
In the work of (Huo, 2021), the sales volume of
10 Walmart stores distributed in 3 states (California,
Texas, and Wisconsin) is predicted using a database
with 3049 products divided into three categories and
seven departments. The authors used different algo-
rithms (Triple Exponential Smoothing, ARIMA, Lin-
ear Regression, Randon Forest, XGBost, and LSTM)
to predict sales for a 28-day window, training the al-
gorithms with sales made from 2011-01-29 to 2016-
04-04 and using as the test set the sales records for
the period 2016-04-05 to 2016-05-22. Linear Regres-
sion yielded the best predictive performance across
different experimental scenarios among the evaluated
methods.
Another study on sales forecasting in Walmart
stores was conducted by (Raizada and Saini, 2021),
utilizing a dataset containing sales records from 45 re-
tail locations. The dataset included various features,
such as historical sales, promotional events, holiday
weeks, temperature, fuel prices, the consumer price
index, and the state’s unemployment rate. The authors
applied traditional machine learning algorithms to
predict sales trends, including Linear Regression, K-
nearest neighbors (K-NN), Support Vector Machine
(SVM), and Extra Trees Regression. Extra Trees Re-
gression achieved the highest predictive performance
among these models, with accuracy exceeding 98.2%
in the experiments.
Also noteworthy is the work of (De Almeida et al.,
2022), which carries out an empirical analysis of the
sales forecast of units of a supermarket chain in the
Brazilian Northeast, applying ML techniques (Linear
Regression, Random Forests, and XGBoost) on daily
transactional data from five years (2015 to 2019) col-
lected from eight different stores. On average, the
best results were obtained with XGBoost, but other
algorithms presented superior results for some stores.
It is worth noting that this study reported the impacts
Prediction of Daily Sales of Individual Products in a Medium-Sized Brazilian Supermarket Using Recurrent Neural Networks Models
741

of the COVID-19 pandemic and seasonal events that
directly impacted the results of the prediction algo-
rithms.
In the work of (Gupta et al., 2022), Machine
Learning algorithms (Linear Regression, Decision
Tree, Random Forest, Ridge Regression and XG-
Boost) were also used to predict product sales in
stores distributed in different cities. The authors used
a database with sales data from the year 2013 for
1,559 products in different towns/stores, with the fol-
lowing data: product ID, product weight, fat level
(low-fat or regular), percentage of the total display
area of all products, item category, item MRP, store
ID, date the store was established, storage area, city
type, an identifier that shows whether the product is
sold in a grocery store or supermarket, and product
sales in the store. The test and training sets consisted
of 5,681 and 8,523 records. In the case study, the best
results were obtained with the XGBoost model, which
reached an accuracy of 87%.
It can also highlight the work of (Dai and Huang,
2021) and (Kohli et al., 2020), who explored a sales
database from a German drugstore chain, with infor-
mation that identifies the store, the number of sales
and buyers in a day, variables that indicate whether
the store was closed or open on a given day and
whether the store’s sales were affected by the school
holiday period, the type of store and the level of as-
sortment, the distance to a competitor in meters, the
year in which the current store started, whether the
store was on promotion on a given day, whether the
promotion was taking place in several stores at the
same time, the period of participation in the promo-
tion and the interval between promotions. In (Kohli
et al., 2020), experiments were conducted with the
Linear Regression and KNN algorithms, obtaining a
mean absolute percentage error of up to 22.065. (Dai
and Huang, 2021), applied LSTM, obtaining better re-
sults in forecasting sales volume than those obtained
with different machine learning algorithms (used with
an Auto Machine Learning tool).
4 EXPERIMENTAL DATABASE
To construct the experimental database, we estab-
lished a cooperative agreement between a university, a
software company specializing in retail systems, and
a medium-sized supermarket in Paran
´
a, Brazil. The
supermarket, which uses the retail management soft-
ware provided by the software company, consented to
share its complete sales history for selected products
over five years (from January 1, 2019, to December
31, 2024). The software company was responsible
for extracting the relevant records from the database
and supplying the university with the necessary data
in .csv format.
The database includes products from 8 categories.
The following list describes these categories and
presents the number of products in each of them:
1. C
1
- Non-Alcoholic Beverages: (46 products) in-
cludes juices, soft drinks, teas, energy drinks, and
other non-alcoholic beverages;
2. C
2
- Alcoholic Beverages: (17 products) includes
beers, wines, spirits, and other alcoholic drinks;
3. C
3
- Cookies, Sweets, and Snacks: (38 prod-
ucts) includes cookies, chocolates, candies, sa-
vory snacks, and other snack options;
4. C
4
- Hygiene and Beauty: (38 products) includes
personal care items such as shampoos, soaps,
creams, and makeup;
5. C
5
- Dairy and Cold Cuts: (24 products) in-
cludes milk derivatives such as cheese and yogurt,
as well as cold meats like ham and salami;
6. C
6
- Cleaning and Household Goods: (21
products) includes cleaning supplies, detergents,
sponges, and home organization items;
7. C
7
- Basic Grocery: (50 products) includes es-
sential pantry items such as rice, beans, pasta,
flour, oils, and canned goods;
8. C
8
- Others: (16 products) includes items that do
not fit into the other categories;
Each product in our database has a .csv file named
with the product code followed by the product cate-
gory code (C
1
to C
2
). Each row in the database has
two columns, one showing a date and the other the
quantity of the product sold on that date. This infor-
mation represents a time series.
Figure 1 shows the quantity sold of two prod-
ucts in our database over 90 days. Supermarket cus-
tomers may exhibit similar consumption patterns ev-
ery 7 days due to characteristics of weekly shopping
cycles due to weekdays and weekends. This behavior
can be observed for the second product shown in the
Figure 1, especially in the first few days.
Most of the .csv files in our database contain sales
records for every day in the period analyzed. When
the supermarket did not sell a product on a given date,
there is no line for that date in the .csv file for the
respective product.
5 CASE STUDY
This Section presents details about the case study
and its results. The Subsection 5.1 presents details
DATA 2025 - 14th International Conference on Data Science, Technology and Applications
742

Figure 1: Daily sales of two products for 90 consecutive
days.
of the algorithms used and the case study methodol-
ogy. Subsection 5.2 describes the experimental met-
rics used. The results obtained and the analysis of
them are in Subsection 5.3.
5.1 Methodology
We ran the experiments with three ML algo-
rithms/models that were implemented as follows:
• Linear Regression: implemented with sliding
windows of size 7. Each window included the val-
ues of the product sales quantity in 7 consecutive
days, with the target being the prediction of the
value on the eighth day.
• GRU: The input layer of the GRU used is a 7-
day sliding window, followed by a GRU layer of
50 units, followed by a second GRU layer of 25
units, both employing the relu activation function.
The network concludes with an output layer com-
prising a single neuron.
• LSTM: With a similar architecture to the GRU
used, the LSTM has a 7-day sliding window as
the input layer, followed by an LSTM layer of
50 units, followed by a second LSTM layer of 25
units, both employing the relu activation function.
The network concludes with an output layer com-
prising a single neuron.
We trained and applied each model iteratively. For
training, we used the first 365 days (Day 1 to Day
365) from each .csv file, using a 7-day time window
to predict sales on the eighth day. After training, the
model predicted sales for the next 30 days (Day 366
to Day 396). We then shifted the training window for-
ward by 30 days and retrained the model to forecast
the following 30 days. We repeated this process until
we covered all recorded days in each file. We trained
separate models for each product.
5.2 Evaluation Metrics
To evaluate the experimental results we use the fol-
lowing metrics: Root Mean Squared Error (RMSE)
and Mean Absolute Percentage Error (MAPE).
The RMSE measures the root mean square error.
The RMSE is defined in Equation 1, which has the
following terms:
• y
i
is the actual observed value,
• ˆy
i
is the value predicted by the model,
• n is the total number of observations.
RMSE =
s
1
n
n
∑
i=1
(y
i
− ˆy
i
)
2
(1)
RMSE penalizes more significant errors due to
squaring, making it useful when large errors must be
minimized.
MAPE, in turn, calculates the mean absolute per-
centage error between the actual values and the pre-
dicted values. MAPE is defined in Equation 2, with
the same terms defined for Equation 1.
MAPE =
100
n
n
∑
i=1
y
i
− ˆy
i
y
i
(2)
MAPE provides the average percentage of error
relative to the true values and helps interpret the rela-
tive error of the model. However, it can be sensitive to
values close to zero, making it less reliable in specific
contexts. In our experiments, we removed all days the
product had zero sales before calculating the MAPE.
5.3 Results and Discussion
Tables 1 and 2 present the average RMSE and MAPE
values applied to all products in the database. Each
row represents one of the algorithms used, and the
columns refer to each semester of the experiment’s
execution period. We present the average RMSE for
each semester. The database covers the period from
2019 to 2024. Of note, 2019 is not included in the
table since it is the first year of the period and was
used exclusively for training the models in the first
interactive training cycle.
The results presented in Tables 1 and 2 indicate
that the performance of Linear Regression (LR) was
consistently lower than that of the other two models
evaluated (which is repeated in the following tables).
Additionally, in Table 1, the two worst RMSE val-
ues were recorded in the second half of 2020, which
we believe is directly associated with the impact of
the COVID-19 pandemic. In contrast, the best results
for both evaluation metrics were obtained in 2023 and
Prediction of Daily Sales of Individual Products in a Medium-Sized Brazilian Supermarket Using Recurrent Neural Networks Models
743

Table 1: RMSE for each semester, considering the average results for all products.
2020 2021 2022 2023 2024
1º 2º 1º 2º 1º 2º 1º 2º 1º 2º
LR 4,851 9,021 5,756 6,096 7,722 7,523 6,434 5,057 4,520 3,160
LSTM 3,955 7,445 3,615 3,729 4,551 4,782 3,994 2,680 3,163 2,120
GRU 3,889 7,437 3,299 3,604 4,304 4,680 4,125 2,710 2,405 2,203
Table 2: MAPE for each semester, considering the average results for all products.
2020 2021 2022 2023 2024
1º 2º 1º 2º 1º 2º 1º 2º 1º 2º
LR 68,28 75,22 76,91 75,34 87,43 84,22 78,34 78,32 75,28 75,87
LSTM 63,16 57,59 55,54 51,68 47,85 48,28 43,94 47,26 49,08 48,46
GRU 62,62 54,44 59,06 48,75 45,81 47,98 44,77 44,10 45,92 50,98
Table 3: RMSE for each semester, considering the average results for the products by each category.
2020 2021 2022 2023 2024
1º 2º 1º 2º 1º 2º 1º 2º 1º 2º
C
1
LR 5,642 7,642 5,526 6,488 11,391 9,353 9,259 5,800 5,609 5,024
LSTM 4,848 5,091 3,175 3,484 7,133 5,367 5,844 3,594 3,378 3,193
GRU 4,891 4,41 3,027 3,169 6,150 4,628 4,952 3,352 3,400 2,854
C
2
LR 13,27 62,31 22,69 21,12 22,44 30,01 18,21 10,25 8,35 6,89
LSTM 11,25 58,08 17,96 17,68 19,70 28,73 16,73 9,090 9,630 7,180
GRU 11,19 59,11 17,63 19,16 20,28 30,21 23,23 9,411 9,737 9,756
C
3
LR 3,461 4,016 3,839 4,334 5,443 5,064 4,468 4,050 4,306 3,146
LSTM 2,822 3,088 2,187 2,257 2,829 2,206 2,211 1,893 2,259 1,610
GRU 2,725 2,482 1,738 1,802 2,768 1,929 1,658 1,774 2,148 1,726
C
4
LR 2,368 2,507 2,855 2,402 6,093 4,630 3,336 2,650 2,392 2,110
LSTM 2,146 1,938 1,978 1,497 3,055 3,189 2,214 1,633 1,508 1.214
GRU 2,058 1,572 1,518 1,253 2,911 2,954 2,015 1,324 1,339 1,099
C
5
LR 4,214 4,666 6,222 8,477 7,363 5,984 6,552 7,988 6,432 4,606
LSTM 3,295 2,743 3,012 4,824 2,274 2,719 3,388 3,943 3,040 1,956
GRU 3,103 2,413 2,609 4,896 3,068 3,413 3,288 4,029 2,775 2,060
C
6
LR 4,140 4,276 4,435 4,435 4,775 5,065 6,120 4,292 3,793 3,429
LSTM 3,168 2,539 2,063 2,053 1,751 2,099 3,114 1,851 1,565 1,378
GRU 3,102 2,242 1,799 1,808 1,718 1,62 2,851 1,385 1,343 1,412
C
7
LR 3,808 3,404 3,9,7 3,804 4,325 4,649 4,204 4,338 3,637 2,862
LSTM 2,962 2,127 1,849 1,784 1,632 1,844 1,758 1,779 1,334 1,075
GRU 2,892 1,887 1,597 1,57 1,443 1,802 1,617 1,719 1,303 1,087
C
8
LR 6,464 6,679 6,112 5,417 4,234 5,156 4,484 3,584 3,142 2,189
LSTM 4,110 3,178 2,910 2,827 2,351 3,123 2,307 1,792 1,744 1,368
GRU 4,113 3,012 2,805 2,645 2,190 2,843 2,872 1,717 1,549 1,772
2024, particularly with the LSTM and GRU mod-
els. This improvement may also be linked to the pan-
demic, as the models were trained using data from
previous years. Consequently, the predictive perfor-
mance has improved from 2023 onwards when the
training dataset comprises only post-pandemic peak
data (i.e., from 2022 onwards). Furthermore, as seen
in Tables 1 and 2, in 2024, RMSE values decreased
to approximately 2. However, the MAPE values re-
mained relatively high.
We also evaluated the experimental metrics con-
sidering each of the product groups described in Sub-
section 4. Tables 3 and 4 present the RMSE and
MAPE results for each of these subsets, with a struc-
ture similar to that of Tables 1 and 2, but every three
rows, the results refer to one of the product groups.
In Tables 3 and 4, a pattern of results similar to
that described in Tables 1 and 3 can be observed,
except for the products in groups C
1
and C
2
(alco-
holic and non-alcoholic beverages), which presented
DATA 2025 - 14th International Conference on Data Science, Technology and Applications
744
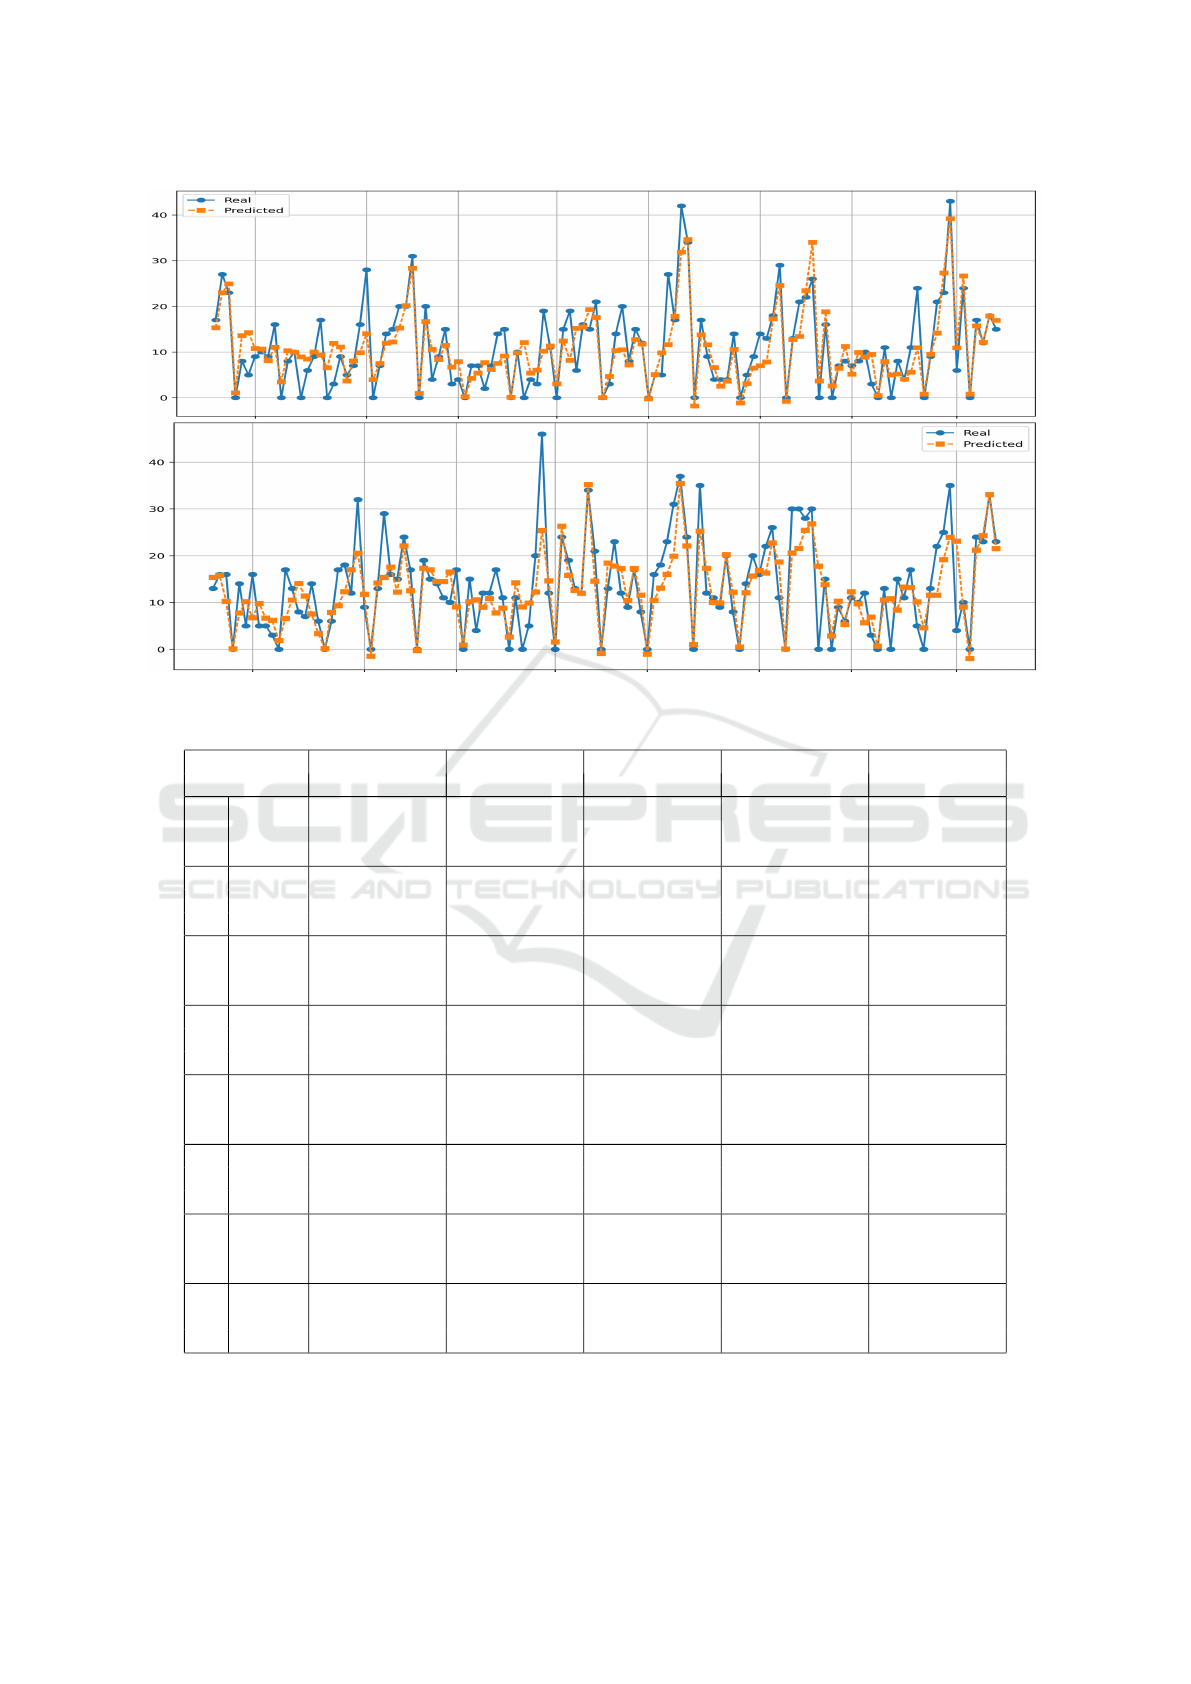
Figure 2: Real and predicted sales values for two products over 120 day.
Table 4: MAPE for each semester, considering the average results for the products by each category.
2020 2021 2022 2023 2024
1º 2º 1º 2º 1º 2º 1º 2º 1º 2º
C
1
LR 80,11 72,59 84,13 87,27 95,00 97,81 96,07 102,77 95,30 106,3
LSTM 76,26 62,24 60,46 58,61 58,48 58,57 59,71 62,83 60,38 64,18
GRU 77,05 57,70 53,85 50,87 54,95 49,13 47,10 57,39 62,08 60,37
C
2
LR 82,61 195,8 168,9 122,7 125,7 192,5 110,7 88,24 74,98 72,78
LSTM 75,78 116,3 144,2 97,75 92,90 99,36 94,70 94,92 118,0 84,84
GRU 75,50 143,7 144,9 112,7 125,9 170,3 116,4 94,91 104,3 154,5
C
3
LR 66,69 67,48 66,66 65,34 76,94 74,63 72,41 73,41 72,87 77,51
LSTM 62,59 53,12 49,37 47,93 44,51 40,61 42,83 40,56 41,09 46,71
GRU 61,74 45,02 39,99 39,10 38,12 35,63 39,61 38,05 41,28 39,44
C
4
LR 61,16 60,37 63,50 62,26 127,6 71,75 71,10 66,34 66,58 65,31
LSTM 60,32 55,24 49,65 48,51 46,74 47,22 48,31 45,26 50,27 47,29
GRU 59,32 46,73 39,81 40,34 39,90 42,98 41,58 41,06 45,05 45,23
C
5
LR 58,89 64,63 70,93 84,37 73,15 67,75 77,09 80,55 81,56 80,83
LSTM 54,96 53,49 47,74 48,35 38,50 40,98 37,92 36,95 37,00 40,51
GRU 55,12 46,94 41,41 50,75 33,26 35,95 35,09 34,40 32,39 41,48
C
6
LR 58,89 64,63 70,93 84,37 73,15 67,75 77,09 80,55 81,56 80,83
LSTM 55,22 44,82 38,37 42,45 38,12 39,45 40,40 41,11 40,24 39,98
GRU 61,07 41,57 46,95 49,27 44,86 45,62 50,50 45,45 49,30 49,09
C
7
LR 62,37 57,60 61,89 61,31 61,89 65,50 65,74 64,12 64,76 61,86
LSTM 56,66 46,12 40,05 39,34 33,12 33,63 36,21 33,10 31,22 32,13
GRU 55,12 40,54 34,24 34,40 28,37 29,52 32,29 32,22 28,93 29,8
C
8
LR 86,62 86,46 81,05 71,85 72,92 81,00 78,20 72,53 78,05 73,67
LSTM 60,51 45,60 48,45 52,63 50,64 49,34 50,25 44,18 53,86 54,26
GRU 54,94 43,37 32,69 34,75 36,82 32,26 30,11 33,31 33,05 39,49
the worst results. The results for the other categories
were slightly better than the general average for all
products, but the problem remains that the average
MAPE values are high, consistently above 28.93.
We also evaluated the experimental results, con-
sidering only the 25 products with the best MAPE
Prediction of Daily Sales of Individual Products in a Medium-Sized Brazilian Supermarket Using Recurrent Neural Networks Models
745

Table 5: RMSE for each semester, considering the average results for the products with better results.
2020 2021 2022 2023 2024
1º 2º 1º 2º 1º 2º 1º 2º 1º 2º
LR 5,682 5,437 5,711 6,241 6,072 7,916 7,301 6,522 6,086 5,160
LSTM 3,998 2,767 2,123 2,486 1,783 2,726 2,356 1,740 1,911 1,550
GRU 3,749 2,149 1,819 2,187 1,699 2,724 2,287 2,052 2,019 1,536
Table 6: MAPE for each semester, considering the average results for the products with better results.
2020 2021 2022 2023 2024
1º 2º 1º 2º 1º 2º 1º 2º 1º 2º
LR 65,91 59,38 60,81 71,70 65,74 60,75 69,99 72,74 66,19 75,73
LSTM 55,27 36,84 28,30 32,50 22,14 19,32 22,06 19,38 18,97 18,66
GRU 52,69 27,55 20,69 23,91 18,87 17,20 19,76 18,71 19,80 19,22
results with LSTM or GRU. The RMSE and MAPE
results for the 10% of products in the database that
had the best MAPE results are in Tables 5 and 6.
Regarding the products with the best MAPE, the
RMSE is close to that obtained in several product cat-
egories, and the average MAPE, as of 2022, is always
lower than 22.14, reaching 17.20. Considering the
sales volume of a medium-sized supermarket, an error
close to 17% can be considerable.
Considering 2 of the 25 products with the best pre-
diction results, Figure 2 is a graph of the predicted
value (in orange) compared to the actual value sold
(in blue) over 120 days for two products of this set.
In the graph, it is possible to observe that for some
of the products, the methods based on RNNs could
follow the sales pattern.
6 CONCLUSION
In this study, we aimed to forecast daily sales of indi-
vidual products in a medium-sized supermarket using
different machine learning algorithms. By focusing
on a diverse set of products across multiple categories,
we demonstrated that forecasting accuracy varies sig-
nificantly from product to product, emphasizing the
complexity of predicting retail sales at such a granular
level. The database used in this work, which includes
five years of sales data from a Brazilian supermarket,
is a valuable resource that can contribute to future re-
search in sales forecasting.
The experimental results show that RNNs (LSTM
and GRU) outperformed traditional Linear Regres-
sion models in terms of accuracy. For some of the
products analyzed, the results produced can be con-
sidered adequate; however, the performance varied
widely, with some products yielding higher predic-
tion errors, especially those in the non-alcoholic and
alcoholic beverage categories. The high MAPE val-
ues, particularly for products with lower sales vol-
ume, suggest room for further improvement in the
models.
Future studies could explore integrating additional
features, such as promotional periods or external fac-
tors like holidays and weather, which may help im-
prove the models’ generalization. Future work may
also involve adjusting the hyperparameters of the al-
gorithms and experimenting with other ML models.
In conclusion, this work contributes to understanding
sales forecasting at the product level in medium-sized
supermarkets, highlighting both the potential and the
challenges of using deep learning techniques for this
task. The insights gained can be used to improve in-
ventory management and enhance supply chain oper-
ations in the retail industry.
ACKNOWLEDGEMENTS
We want to thank the supermarkets that kindly pro-
vided the data used in the experiments and who chose
not to have their identities disclosed.
REFERENCES
Aldhaheri, A., Alwahedi, F., Ferrag, M. A., and Battah, A.
(2024). Deep learning for cyber threat detection in iot
networks: A review. Internet of Things and cyber-
physical systems, 4:110–128.
Almufadi, N., Alblihed, N., Alhabeeb, S., Alhumud, S.,
and Selmi, A. (2023). Sales prediction based on
data mining techniques. In International Conference
on Emerging Smart Technologies and Applications,
pages 1–6. IEEE.
Archana, R. and Jeevaraj, P. E. (2024). Deep learning mod-
els for digital image processing: a review. Artificial
Intelligence Review, 57(1):11.
DATA 2025 - 14th International Conference on Data Science, Technology and Applications
746

Brockwell, P. J. and Davis, R. A. (2016). Introduction to
Time Series and Forecasting. Springer.
Chatfield, C. (2004). The Analysis of Time Series: An Intro-
duction. Chapman & Hall/CRC, 6 edition.
Chen, I.-F. and Lu, C.-J. (2017). Sales forecasting by com-
bining clustering and machine-learning techniques for
computer retailing. Neural Computing and Applica-
tions, 28:2633–2647.
Cho, K., Van Merri
¨
enboer, B., Bahdanau, D., and Bengio,
Y. (2014). On the properties of neural machine trans-
lation: encoder-decoder approaches. arXiv preprint
arXiv:1409.1259.
Chung, J., Gulcehre, C., Cho, K., and Bengio, Y.
(2014). Empirical evaluation of gated recurrent neu-
ral networks on sequence modeling. arXiv preprint
arXiv:1412.3555.
Dai, Y. and Huang, J. (2021). A sales prediction method
based on lstm with hyper-parameter search. Journal
of Physics: Conference Series, 1756(1):012015.
De Almeida, F. M., Martins, A. M., Nunes, M. A., and Bez-
erra, L. C. (2022). Retail sales forecasting for a brazil-
ian supermarket chain: an empirical assessment. In
IEEE Conference on Business Informatics, volume 1,
pages 60–69. IEEE.
Gupta, G., Gupta, K. L., and Kansal, G. (2022). Megamart
sales prediction using machine learning techniques. In
International Conference on Computing, Communica-
tions, and Cyber-Security, pages 437–446. Springer.
Hamilton, J. D. (1994). Time Series Analysis. Princeton
University Press.
Hochreiter, S. (1998). The vanishing gradient problem dur-
ing learning recurrent neural nets and problem solu-
tions. International Journal of Uncertainty, Fuzziness
and Knowledge-Based Systems, 6(02):107–116.
Hochreiter, S. and Schmidhuber, J. (1997). Long short-term
memory. Neural Computation, 9(8):1735–1780.
Huo, Z. (2021). Sales prediction based on machine learn-
ing. In International Conference on E-Commerce and
Internet Technology, pages 410–415. IEEE.
Jeyarangani, J., Sumanth, G. B., Raviram, C., and
Sreekanth, M. V. (2023). Regressor based supermar-
ket sales prediction using time series data. In Interna-
tional Conference on Futuristic Technologies, pages
1–4. IEEE.
Kohli, S., Godwin, G. T., and Urolagin, S. (2020). Sales
prediction using linear and knn regression. In Ad-
vances in Machine Learning and Computational In-
telligence, pages 321–329. Springer.
Le, X.-H., Ho, H. V., Lee, G., and Jung, S. (2019). Applica-
tion of long short-term memory (lstm) neural network
for flood forecasting. Water, 11(7):1387.
Meulstee, P. and Pechenizkiy, M. (2008). Food sales pre-
diction:” if only it knew what we know”. In IEEE
International Conference on Data Mining Workshops,
pages 134–143. IEEE.
Pascanu, R., Mikolov, T., and Bengio, Y. (2013). On the
difficulty of training recurrent neural networks. In In-
ternational Conference on Machine Learning, pages
1310–1318, Atlanta, USA. Pmlr.
Raizada, S. and Saini, J. R. (2021). Comparative analysis of
supervised machine learning techniques for sales fore-
casting. International Journal of Advanced Computer
Science and Applications, 12(11).
Rumelhart, D. E., Hinton, G. E., and Williams, R. J. (1986).
Learning representations by back-propagating errors.
Nature, 323(6088):533–536.
Santra, A. S. and Lin, J.-L. (2019). Integrating long short-
term memory and genetic algorithm for short-term
load forecasting. Energies, 12(11):2040.
Sherstinsky, A. (2020). Fundamentals of recurrent neu-
ral network (RNN) and long short-term memory
(LSTM) network. Physica D: Nonlinear Phenomena,
404:132306.
Su, X., Yan, X., and Tsai, C.-L. (2012). Linear regres-
sion. Wiley Interdisciplinary Reviews: Computational
Statistics, 4(3):275–294.
Wei, W. W. S. (2006). Time Series Analysis: Univariate and
Multivariate Methods. Pearson/Addison Wesley, .
Prediction of Daily Sales of Individual Products in a Medium-Sized Brazilian Supermarket Using Recurrent Neural Networks Models
747
