
Democratizing the Access to Geospatial Data: The Performance
Bottleneck of Unified Data Interfaces
Matthias Pohl
1 a
, Arne Osterthun
1 b
, Joshua Reibert
1 c
, Dennis Gehrmann
2
, Christian Haertel
2 d
,
Daniel Staegemann
2 e
and Klaus Turowski
2 f
1
German Aerospace Center (DLR) - Institute of Data Science, Jena, Germany
2
Faculty of Computer Science, Otto von Guericke University, Magdeburg, Germany
fi fi
Keywords:
Benchmark, Array File Formats, Geospatial Data, Raster Data Management, OGC.
Abstract:
The exponential growth of geodata collected through satellites, weather stations, and other measuring systems
presents significant challenges for efficient data management and analysis. High-resolution datasets from
Earth observation missions like ESA Sentinel are vital for climate research, weather forecasting, and environ-
mental monitoring, yet their multidimensional nature and temporal depth increasingly strain traditional spatial
data models. This research evaluates the performance characteristics of various geospatial data access and
processing technologies through systematic benchmarking. The study compares file formats (NetCDF, Zarr)
and interface standards (OpenEO, OGC WCS) on a Rasdaman database instance to determine optimal con-
figurations for interactive data exploration and analysis workflows. Performance tests reveal a clear hierarchy
in processing efficiency. Direct RasQL queries consistently outperform both OGC WCS and OpenEO API
interfaces across all test scenarios. Array file formats demonstrate superior query processing speeds, likely
attributable to reduced database technology overhead. The findings provide a robust foundation for select-
ing appropriate geodata processing technologies based on specific use case requirements, data volumes, and
performance needs. This research contributes to enhancing the efficiency of multidimensional geospatial data
handling, particularly for time-critical applications that require interactive visualization and analysis capabili-
ties.
1 INTRODUCTION
The continuous collection of geodata by satellites,
weather stations, and other measuring systems gen-
erates ever-growing amounts of data. In particular,
Earth observation satellites such as the ESA Sen-
tinel mission generate high-resolution data sets that
are crucial for climate research, weather forecasting,
and environmental monitoring. The efficient manage-
ment and analysis of this multidimensional geospatial
data presents complex challenges for scientists and
data analysts. Traditional models for analyzing spatial
data are increasingly reaching their limits, especially
due to the ever-growing temporal dimension of data
a
https://orcid.org/0000-0002-6241-7675
b
https://orcid.org/0000-0001-6455-9119
c
https://orcid.org/0000-0002-5626-7869
d
https://orcid.org/0009-0001-4904-5643
e
https://orcid.org/0000-0001-9957-1003
f
https://orcid.org/0000-0002-4388-8914
series. While interactive visualizations are an indis-
pensable tool for intuitive data exploration and rapid
insight generation, they are highly dependent on sys-
tem latency (Merticariu et al., 2016, Polte et al., 2009,
Stonebraker et al., 1993). This performance depen-
dency can significantly impair analytical capabilities.
To overcome these challenges, various specialized
file formats and interface standards have been devel-
oped. In the field of geospatial data analysis, the in-
terface standards OpenEO (Open Earth Observation)
and OGC WCS (Open Geospatial Consortium - Web
Coverage Service) have become particularly estab-
lished. These interfaces integrate various technolo-
gies and web services to provide comprehensive so-
lutions for managing and analyzing large amounts of
geospatial data. The choice of a suitable format and
the appropriate interface is crucial for the efficient sci-
entific use of geodata (Merticariu et al., 2016, Polte
et al., 2009, Stonebraker et al., 1993). The models
must ensure both efficient access to spatio-temporal
sections and a high processing speed for interactive
732
Pohl, M., Osterthun, A., Reibert, J., Gehrmann, D., Haertel, C., Staegemann, D. and Turowski, K.
Democratizing the Access to Geospatial Data: The Performance Bottleneck of Unified Data Interfaces.
DOI: 10.5220/0013649000003967
Paper published under CC license (CC BY-NC-ND 4.0)
In Proceedings of the 14th International Conference on Data Science, Technology and Applications (DATA 2025), pages 732-738
ISBN: 978-989-758-758-0; ISSN: 2184-285X
Proceedings Copyright © 2025 by SCITEPRESS – Science and Technology Publications, Lda.

analyses. An evaluation of the available file formats
and interface standards is therefore essential for the
development of efficient geodata analyses.
This research work aims to identify a suitable in-
terface for accessing, processing, and exploring mul-
tidimensional geospatial data using a performance
benchmarking test (Osterthun and Pohl, 2025a). By
analyzing the file formats NetCDF, Zarr, and the geo-
data interface standards OpenEO and OGC WCS on
a Rasdaman database instance. As the analysis ap-
proach is generalizable, the research is not limited to
that choice. The aim is to determine which constel-
lation enables the most efficient handling and analy-
sis of the data. The knowledge gained will provide
a solid foundation for selecting suitable geodata pro-
cessing technologies.
2 BACKGROUND
2.1 Array-File Formats
This section gives an overview of the NetCDF and
Zarr which are established file formats for the pro-
cessing of multidimensional and scientific data.
2.1.1 NetCDF
NetCDF
1
(Network Common Data Form) is a soft-
ware package that supports the creation, access, and
exchange of array-oriented scientific data. It is also
an established standard for the exchange of data in
the scientific community and is used in a variety of
disciplines such as climate research, oceanography,
and meteorology. The NetCDF technology encom-
passes a file format for defining the structure and
storage of data in NetCDF, a classic and extended
data model that defines the organization and access of
NetCDF files, and a software component for working
efficiently with NetCDF data.
A classic NetCDF file format is stored as a sin-
gle file consisting of a header and the data area. The
header contains all information about dimensions, at-
tributes, and variables, but does not include the actual
variable data. It holds the names, types, and proper-
ties of the dimensions and variables, as well as the
offsets that indicate the position of the variable data
in the file. Since the header is only as large as nec-
essary to store the existing dimensions, variables, and
attributes, a NetCDF file requires little additional stor-
age space. This makes the files compact but has the
disadvantage that any change that requires an exten-
1
https://www.unidata.ucar.edu/software/netcdf/
sion of the header (e.g., adding new variables) re-
quires the data to be moved. The data area con-
sists of fixed-size data and record data. The fixed-
size data contains the data for variables without un-
bounded dimensions. The data is stored contiguously.
The record data contains variable-sized data for vari-
ables with unbounded dimensions. This is organized
into a series of fixed-size data sets.
The classic NetCDF data model consists of vari-
ables, dimensions, and attributes. This type of data or-
ganization was introduced with the very first NetCDF
version and continues to form the core of all NetCDF
files. Variables in NetCDF files can be of one of six
types: char, byte, short, int, float, or double. The axes
of the data arrays in NetCDF files are described by
dimensions. Each dimension has a name and a fixed
length. An unlimited dimension has a length that can
be extended whenever more data is written. NetCDF
files can contain, at most, one unlimited dimension.
Attributes are used to tag variables or files with short
notes or additional metadata. Attributes are always
scalars or 1D arrays and can be associated with either
a variable or the entire file. Although there are no hard
limits, it is recommended that attributes be kept small.
Groups are used to organize data hierarchically, simi-
lar to directories in a Unix file system.
NetCDF files can contain groups, variables, di-
mensions, and attributes. In this way, a group acts as
a container for the classic NetCDF dataset. NetCDF
files can also contain many groups that are organized
hierarchically. Since each group acts as a complete
NetCDF dataset, it is possible to have variables with
the same name in two or more different groups within
the same NetCDF file. Dimensions have a special
scope. They can be seen by all variables in their group
and all descendant groups. This allows the user to de-
fine dimensions in a top-level group and use them in
many sub-groups.
2.1.2 Zarr
Zarr
2
is a modern file format, similar to NetCDF,
designed for the efficient storage and processing of
large, multidimensional arrays. It allows data to be
stored in a distributed and compressed form, mak-
ing it particularly suitable for use in cloud environ-
ments and parallel processing systems. A key differ-
ence to traditional file formats such as NetCDF lies
in the way Zarr organizes data into chunks. Zarr
differs in its flexible structure, which allows chunks
to be stored as separate files. This distributed or-
ganization enables the efficient storage and process-
ing of large amounts of data on cloud storage sys-
2
https://zarr.dev/
Democratizing the Access to Geospatial Data: The Performance Bottleneck of Unified Data Interfaces
733
tems or distributed file systems by providing paral-
lel access to many small files. Zarr’s design also
makes it easier to access data directly in cloud en-
vironments which often requires additional tools or
customization with NetCDF. In particular, for cloud-
based or distributed applications, Zarr offers certain
advantages over conventional file formats due to its
distributed chunking architecture. Zarr can be consid-
ered a cloud-optimized evolution of NetCDF file for-
mats, as it utilizes a similar data model but is specif-
ically designed for distributed and scalable environ-
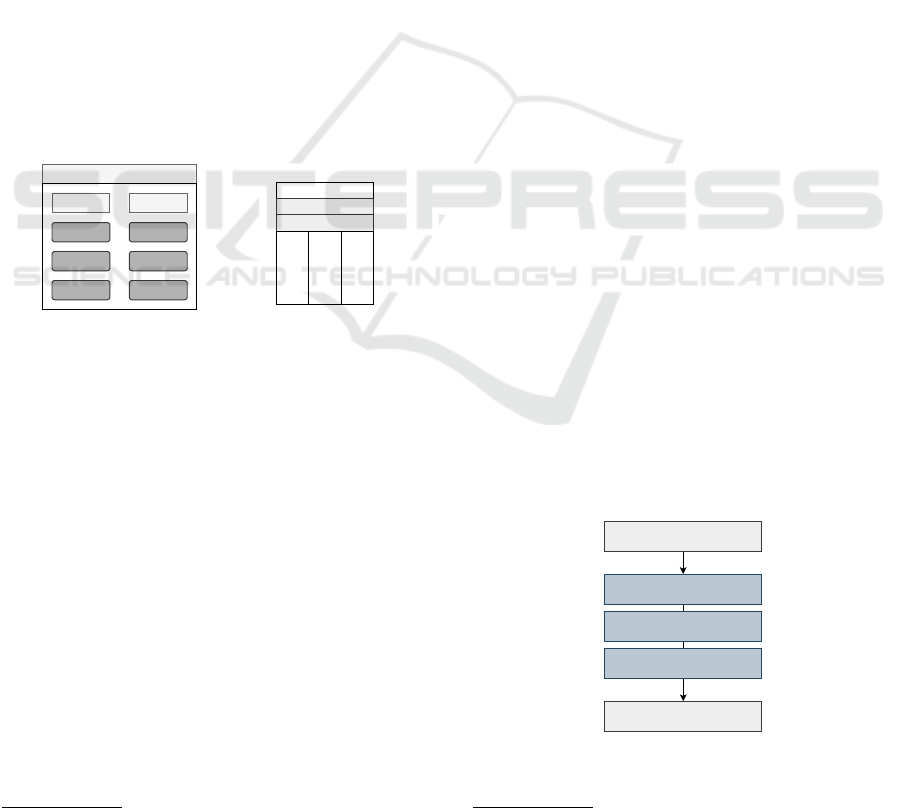
ments. The .zarray file from the .zgroup container
describes how the binary data is encoded by speci-
fying unique key representations. The .zattrs file
contains metadata with additional information about
the array, including its shape, data type, and other rel-
evant properties. Below .zarray and .zattrs, there
are several rectangular fields, each labeled 0.0, 1.0,
2.0, which represent the individual chunks of the ar-
ray.
We focus on version 2 of the specification, which
has been widely adopted and proven practical in nu-
merous projects. However, version 3 of Zarr specifi-
cation is already available.
.zgroup
.zarray .zattrs
0.0 0.1
1.0
2.0
1.1
2.1
(a) Zarr
File
Group
Subgroups
Dimensions
Variables
Attributes
(b) NetCDF
Figure 1: Overview of file format specifications.
2.2 Rasdaman
Rasdaman
3
(Raster Data Manager) is a Linux-based
database management system designed specifically
for storing and analyzing multidimensional, raster-
based geospatial data. Rasdaman stores arrays within
a standard database by partitioning them into smaller
segments known as tiles. Each tile is stored as a
BLOB (binary large object) in a relational table. This
approach enables conventional relational database
systems to manage arrays of unlimited size, utiliz-
ing PostgreSQL as the underlying system for meta-
data management. The overall focus of Rasdaman is
on the efficient management and processing of large
amounts of geospatial raster data. Rasdaman uses a
proprietary query language called RasQL (Rasdaman
Query Language), which is specifically optimized for
3
http://www.rasdaman.org/
querying raster data (Rasdaman, 2024).
Rasdaman implements the geodata interface stan-
dards OpenEO and OGC WCS which are examined
in the following sections.
2.2.1 openEO
OpenEO
4
is an open application programming inter-
face (API) for standardized geodata processing. The
goal of OpenEO is to create a unified and simpli-
fied way to access and process various Earth obser-
vation platforms and services. Developers and sci-
entists can thus write scripts to process Earth Obser-
vation (EO) data independently of the data provision
platforms used (e.g., Google Earth Engine, Sentinel
Hub, or Open Data Cube). The API supports vari-
ous programming languages such as Python, R, and
JavaScript (Gomes et al., 2020). The architecture of
OpenEO follows a modular three-layer design, com-
prising a client layer, a processing layer, and a back-
end layer. The client layer includes the various client
APIs that enable users to access and process EO data.
The processing layer is represented by the core API,
which acts as a central logic layer and standardizes the
requests of the client APIs. Finally, the backend layer
connects the core API to the various backend services
that perform the actual data processing and storage
via the driver APIs. Various scenarios of a possible
OpenEO architecture are shown schematically in the
Figure 2 (Schramm et al., 2021).
The client layer contains the entry points for de-
veloping Earth Observation analyses. Packages and
modules in the R, Python, and JavaScript program-
ming languages are available for this purpose, en-
abling researchers to process EO data and create anal-
yses (Schramm et al., 2021).
The processing layer is represented by the core
API. This is responsible for standardizing the requests
from the client APIs and creating a uniform inter-
face for accessing various data processing services.
Client Layer
Core
Backend Layer
Database
User Application
Figure 2: openEO Architecture.
4
https://openeo.org/
DATA 2025 - 14th International Conference on Data Science, Technology and Applications
734

This facilitates the integration of different technolo-
gies for processing Earth observation data. OpenEO
implements its core API as a collection of microser-
vices that adhere to the RESTful architectural style,
which is based on web services utilizing HTTP meth-
ods. The openEO processing layer is organized in
processes and connects these processes in process
graphs. A process describes a specific operation ap-
plied to EO data, such as computing the Normal-
ized Difference Vegetation Index (NDVI) or filtering
data over a specific time span. A process graph is a
chain of processes that are executed as a workflow.
Each node in the graph represents a process, and the
edges represent the data flows and the order of execu-
tion. The Core API translates the locally implemented
source code into a uniform JavaScript Object Notation
(JSON) format that both humans and machines can
read, which is sent to a compatible backend via HTTP
request. To be compatible with the API, a backend
must provide an OpenEO endpoint that translates the
received standardized process chain into the local re-
quirements. The backend then executes the process
chain, and the resulting data is sent back to the client.
The backend layer includes the driver APIs, which
interface between the core API and the backend ser-
vices. This layer ensures that the data processing
and storage technologies are correctly addressed via
OpenEO endpoints and that the requested data is pro-
cessed. There are concrete implementations of the
OpenEO endpoints for the following backend ser-
vices: GeoPySpark (Geotrellis), Open Data Cube,
Apache Airflow / eoDataReaders, Rasdaman.
2.2.2 OGC WCS
The OGC Web Coverage Service (WCS)
5
provides
a standardized interface that allows users to request
and use geospatial data. The main function of the
WCS is to provide large-scale data such as satellite
images, elevation models, or climate data. Users can
access specific parts of this data that are relevant to
their analysis. This distinguishes the WCS from other
services of the Open Geospatial Consortium (OGC)
(Baumann, 2010). The architecture of OGC WCS is
divided into three main components: core, extensions,
and application profiles, which together form a flexi-
ble and extensible framework for accessing geospatial
data. The WCS Core provides the basic functionality
of the architecture and defines the fundamental op-
erations required for accessing and processing geo-
data. It is based on the specifications of the OGC
Web Services Common (OWS Common), which pro-
vides general mechanisms for querying and commu-
5
https://www.ogc.org/publications/standard/wcs/
nicating between OGC Earth Observation Services,
such as WMS, WFS, and WCS. This includes the def-
inition of requests and responses in a standard for-
mat, supporting various protocols (such as HTTP and
SOAP), and utilizing standards like XML. A central
component of WCS Core is the so-called Core Oper-
ations (comparable to the microservices of OpenEO),
which include the standard services GetCapabilities,
DescribeCoverage, and GetCoverage. At the center
of the WCS core component is the Coverage Imple-
mentation Schema, which defines a standardized ap-
proach for modeling and processing geospatial raster
data using OGC WCS. Coverages that represent the
basic geospatial data are organized here by a refer-
ence grid structure that allows for a precise descrip-
tion of the data structure and its geospatial extent.
This structure provides the foundation for managing
multidimensional geospatial data, encompassing tem-
poral, spatial, and other dimensions. WCS uses Geog-
raphy Markup Language (GML), an XML-based for-
mat developed by OGC, to model and represent ge-
ographic information. GML is used to describe the
metadata and geospatial information, such as bound-
ing boxes or coordinate reference systems, associated
with the coverages. This ensures that the data is inter-
operable and can be easily processed in different GIS
applications. The data model of the core describes
how the coverages are structured and organized. WCS
supports a variety of file formats for displaying and
storing this data. The extensions extend the basic
functionality of the WCS to support specific applica-
tion requirements. These extensions are divided into
two main categories: service extensions and protocol
binding extensions.
3 EXPERIMENTS
The basis for the experiments is explained below. The
decision in favor of Rasdaman as a database system
was primarily due to its native support for both OGC
WCS and OpenEO through ready-made endpoints, as
well as the similar request processing in the back-
ground. Thus, Rasdaman provides a good basis for
comparison when testing the performance of the two
interfaces. The choice of NetCDF as the primary
file format for the implementation was mainly due
to its native support in Rasdaman for importing and
exporting multidimensional geospatial data. Since
Zarr is also designed for storing scientific data in a
multi-dimensional format, the conversion from Zarr
to NetCDF is usually straightforward.
Democratizing the Access to Geospatial Data: The Performance Bottleneck of Unified Data Interfaces
735

3.1 Benchmark Process
The architecture of the benchmarks consists of several
distinct layers, each serving a specific purpose in data
management and access. At the foundational level,
the file system interacts directly with the hardware’s
operational drivers, facilitating file storage and orga-
nization on physical devices. Above this, the storage
engine defines the logical structure of the data, op-
timizing how it is stored, indexed, and retrieved. It
employs various data models tailored to specific ac-
cess patterns and includes features like data compres-
sion, encryption, and replication. The middle layer is
the query engine, which interprets and executes user
queries, optimizing access paths through techniques
like query rewriting and cost-based optimization to
ensure efficient data retrieval. Next is the applica-
tion interface layer, providing a standardized mech-
anism for applications to interact with the query en-
gines through APIs and tools that simplify data ac-
cess. At the top, the application environment provides
user-friendly interfaces and analytical tools that en-
able easy interaction with data, empowering users to
access, manipulate, and visualize information for in-
formed decision-making.
3.1.1 Application Stacks
With this multi-layered architecture, data manage-
ment is streamlined for the purpose of the benchmark
experiment. The structure is used to define the fol-
lowing application stacks. Figure 3 shows the compa-
rability of the technologies.
The application stacks are constructed for the pur-
pose of the benchmarks according to the investigated
unified data interfaces openEO and OGC WCS as
well as the array data file formats Zarr and NetCDF.
The chosen programming environment for these ap-
plication stacks is Python, which is a versatile and
widely used language in data science and analytics.
While other languages like Julia and R are also preva-
lent in the ESS domain, Python has been selected as
the primary requirement due to its rich ecosystem and
community support.
In Rasdaman version 10.4, three interconnected
stacks are shown in Figures 3a to 3c, utilizing the
robust Rasdaman blob storage system. Two of these
stacks integrate with a REST API to connect to ope-
nEO and OGC Web Coverage Service (WCS). As a
control instance, the Rasdaman query language rasQL
is used via the rasdapy Python package, enabling effi-
cient interaction with Rasdaman.
Alternative stacks for integrating NetCDF and
Zarr files have been created. Within the Python en-
vironment, xarray
6
serves as a key tool for modeling
multidimensional data, offering an intuitive interface.
It supports multiple file formats, including Zarr and
NetCDF, which enhances its versatility. To utilize the
capabilities of xarray, various packages are needed for
effective data file access and manipulation (see Figure
3d and 3e).
3.1.2 Procedure
The application stacks are implemented on the desig-
nated infrastructure, as outlined in Section 3.2.3. The
workload is largely determined by the submission of
specific queries and the data sets used. Initially, the
data undergoes preprocessing, which includes inte-
gration into the Rasdaman database for optimal query
execution, as well as preparation in NetCDF and Zarr
formats for efficient data handling. For benchmark-
ing, a series of queries is submitted through the appli-
cation stacks to access the data. Query runtimes are
measured, with each submission repeated 100 times
to calculate the average performance metrics for ac-
curate comparison.
3.2 Setup
3.2.1 Data
In the field of earth system science, multidimensional
spatial data is essential for understanding complex en-
vironmental processes. The ERA-5 reanalysis dataset
(C3S, 2018), available through the Copernicus Cli-
mate Change Service (C3S) in GRIB
7
and NetCDF
formats, offers a wealth of climate and weather in-
formation from 1940 to the present. This extensive
dataset includes atmospheric, ocean-wave, and land-
surface parameters. The benchmark specifically fo-
cuses on two critical variables, 2-meter temperature
and soil temperature, across multiple dimensions of
time, latitude, longitude, and, where relevant, altitude.
Spatial dimensions are crucial in user queries, espe-
cially for scientific users who often seek data related
to these dimensions. Additionally, it is essential to
recognize that the dataset has an hourly time resolu-
tion.
3.2.2 Data Queries
The queries in this workload are designed to mimic
common data access patterns typically seen during
compute tasks. These tasks often involve tempo-
ral and spatial aggregate operations, such as cal-
6
https://xarray.dev/
7
https://community.wmo.int/en/activity-areas/wis/grib-
edition-1
DATA 2025 - 14th International Conference on Data Science, Technology and Applications
736
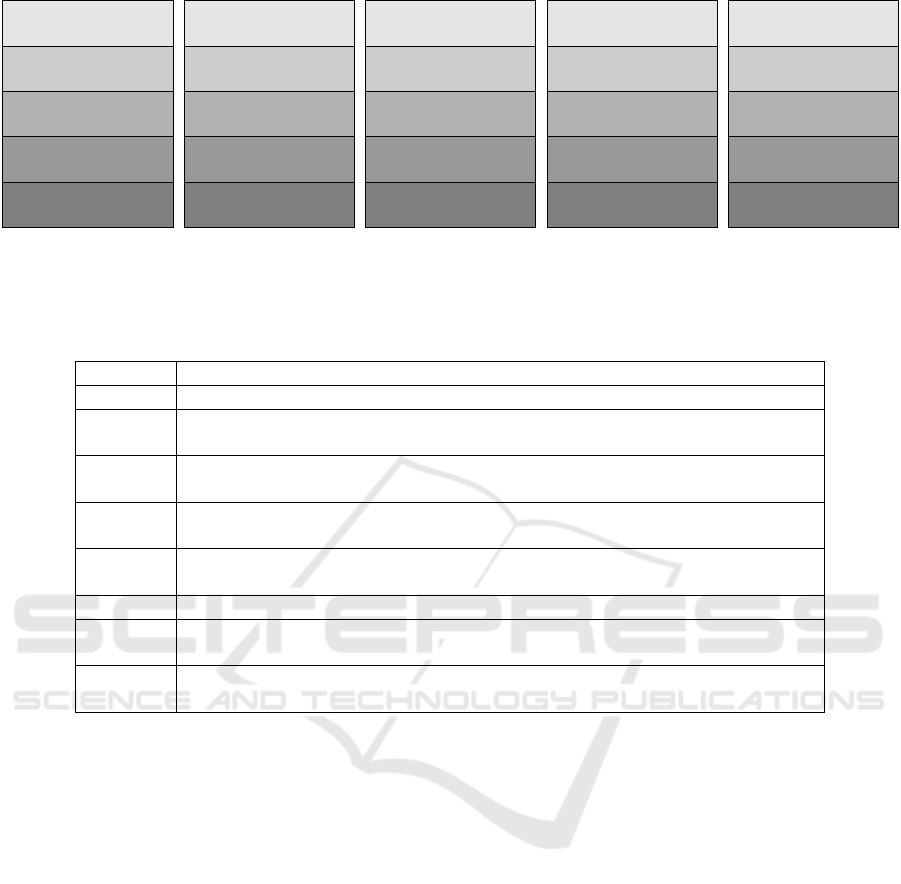
Python (3.10.12)
rasdapy
Rasdaman (10.4)
Rasdaman BLOB
XFS
(a) RasQL
Python (3.10.12)
openEO
Rasdaman (10.4)
Rasdaman BLOB
XFS
(b) openEO
Python (3.10.12)
OGC WCS
Rasdaman (10.4)
Rasdaman BLOB
XFS
(c) OGC WCS
Python (3.10.12)
xarray (2024.11.0)
h5netcdf (1.4.1)
hdf5plugin (5.0.0)
NetCDF4
XFS
(d) NetCDF
Python (3.10.12)
xarray (2024.11.0)
Zarr-Python (2.18.2)
Zarr (v2)
XFS
(e) Zarr
Figure 3: Application Stacks for Comparison.
Table 1: List of queries used for the benchmarks.
Query ID Description
Q1 Get 2m temperature for a specific location and point in time.
Q2–7: Get a [day,week,fortnight,month,quarter,year] worth of 2m temperature data at
a specific location.
Q8–13: Get a [day,week,fortnight,month,quarter,year] worth of 2m temperature data
for an area on the map the size of Germany’s bounding box.
Q14–19: Get a [day,week,fortnight,month,quarter,year] worth of 2m temperature data
for an area on the map the size of the USA’s bounding box.
Q20–25: Get a [day,week,fortnight,month,quarter,year] worth of 2m temperature data
for an area on the map the size of the EU’s bounding box.
Q26–28: Get a [day,week,fortnight] worth of 2m temperature data for the whole map.
Q29–34: Get a [day,week,fortnight,month,quarter,year] worth of of soil temperature data
at a specific location and altitude.
Q35–40: Get a [day,week,fortnight,month,quarter,year] worth of soil temperature data
at a specific location across all altitudes.
culating monthly temperature averages. The work-
load is structured as follows. The most straightfor-
ward query (Q1) involves retrieving data for a spe-
cific location and a specific point in time, such as
a temperature query. The complexity of the work-
load increases as the temporal scope is broadened to
include various timeframes: day (Q2), week (Q3),
fortnight (Q4), month (Q5), quarter (Q6), and year
(Q7). The next phase introduces variations in the
spatial dimension. Subsequent queries (Q8–Q13) fo-
cus on retrieving data for specific locations, begin-
ning with coordinates in Germany, followed by the
USA (Q14–Q19), Europe (Q20–Q25), and, finally,
the entire globe (Q26–Q28) within constrained time
frames. The final set of queries (Q29–Q34) adds al-
titude as an additional spatial variable, focusing on
specific points across various time frames. Addition-
ally, queries (Q35–Q40) cover all altitude informa-
tion. This structured approach highlights the growing
complexity and diversity of data access patterns in the
workload.
3.2.3 Technical Setup
The benchmarking tests were conducted on a high-
performance workstation with the following specifi-
cations: AMD EPYC 7402P, equipped with 24 cores,
128 GiB of high-speed RAM, dual 8 TB HDDs in
a RAID 0 configuration, Ubuntu 20.04.6 LTS. While
the performance comparisons from these benchmarks
are reliable, it is important to note that absolute
scores can be improved through optimized configu-
rations, such as fine-tuning software settings or up-
grading storage solutions, to further enhance system
efficiency.
4 RESULTS
In this section, we discuss the outcomes of the con-
ducted benchmarks that are presented on an external
repository (Osterthun and Pohl, 2025b). The average
query runtime has been measured for each query set
based on the specific data configurations used. The re-
Democratizing the Access to Geospatial Data: The Performance Bottleneck of Unified Data Interfaces
737

sults can be accessed through an external repository,
where the result set and accompanying figures are or-
ganized in a comprehensive manner.
For comparative analysis, we include results from
both fortnightly and quarterly time scales, allowing
for a nuanced perspective on performance across dif-
ferent periods. The accompanying figures utilize a
logarithmic scale, which enhances the clarity of the
differences in query runtimes, enabling a more thor-
ough examination of the data. The center point on
the y-axis is set at 1 second, providing a clear ref-
erence for evaluating performance. Bars extending
downwards indicate runtimes that fall below this cen-
ter point, while those extending upwards signify run-
times that exceed it. This dual-direction represen-
tation in a single figure facilitates a comprehensive
understanding of how various data queries compare
against the threshold.
When examining the performance of unified data
interfaces, it becomes evident that utilizing WCS re-
sults in significantly lower runtimes compared to ope-
nEO. This suggests that WCS is more efficient for cer-
tain applications. However, it is important to note that
when accessing Rasdaman directly through RasQL,
bypassing the intermediate translation via the REST
API, performance improves even further, illustrating
a more streamlined and effective method for handling
data queries.
As anticipated, it is evident that the query runtime
experiences an increase as the volume of data to be
retrieved grows.
5 CONCLUSION
The performance tests conducted demonstrate a
clear gradation in performance. RasQL consistently
achieves the best performance when compared to
OGC WCS and OpenEO via their respective APIs.
For small to medium data queries, the differences are
moderate, and all three interfaces provide acceptable
response times. For larger data volumes, the per-
formance advantage of RasQL becomes more pro-
nounced. Queries are processed significantly faster
in the Array File Formats, which is probably due to
the low overhead of the database technology.
OGC WCS is the recommended interface for user-
friendly access. The full integration in Rasdaman, the
integrated user interface, and the slightly better per-
formance compared to OpenEO make OGC WCS the
recommended choice for most applications. RasQL is
the preferred choice for performance-critical applica-
tions or very large amounts of data. However, using
RasQL in practice is cumbersome because the correct
array indices for temporal and spatial parameters must
first be determined for queries, whereas OGC WCS
and OpenEO allow parameterization using real coor-
dinates and timestamps. Nevertheless, direct access
to file-based formats is recommended for large-scale
data analyses or time-critical applications. The hierar-
chical structure of the file formats allows for fast and
structured access.
REFERENCES
Baumann, P. (2010). Beyond rasters: introducing the
new ogc web coverage service 2.0. In Proceedings of
the 18th SIGSPATIAL International Conference on Ad-
vances in Geographic Information Systems, GIS ’10,
page 320–329, New York, NY, USA. Association for
Computing Machinery.
C3S (2018). ERA5 hourly data on single levels from 1940
to present.
Gomes, V. C., Queiroz, G. R., and Ferreira, K. R. (2020).
An overview of platforms for big earth observation data
management and analysis. Remote Sensing, 12(8):1253.
Merticariu, G., Misev, D., and Baumann, P. (2016). To-
wards a General Array Database Benchmark: Measur-
ing Storage Access. In Rabl, T., Nambiar, R., Baru,
C., Bhandarkar, M., Poess, M., and Pyne, S., editors,
Big Data Benchmarking, volume 10044, pages 40–67.
Springer International Publishing, Cham. Series Title:
Lecture Notes in Computer Science.
Osterthun, A. and Pohl, M. (2025a). Foxbench: Bench-
mark for n-dimensional array file formats in data an-
alytics environments. In Datenbanksysteme f
¨
ur Busi-
ness, Technologie und Web (BTW 2025), pages 545–564.
Gesellschaft f
¨
ur Informatik, Bonn.
Osterthun, A. and Pohl, M. (2025b).
Rasdaman data interface benchmarks.
https://doi.org/10.5281/zenodo.15306493.
Polte, M., Lofstead, J., Bent, J., Gibson, G., Klasky, S. A.,
Liu, Q., Parashar, M., Podhorszki, N., Schwan, K.,
Wingate, M., and Wolf, M. (2009). ...and eat it too:
high read performance in write-optimized HPC I/O mid-
dleware file formats. In Proceedings of the 4th Annual
Workshop on Petascale Data Storage, PDSW ’09, pages
21–25, New York, NY, USA. ACM.
Rasdaman (01.12.2024). Rasdaman v10.4 documentation.
Schramm, M., Pebesma, E., Milenkovi
´
c, M., Foresta, L.,
Dries, J., Jacob, A., Wagner, W., Mohr, M., Neteler, M.,
Kadunc, M., Miksa, T., Kempeneers, P., Verbesselt, J.,
G
¨
oßwein, B., Navacchi, C., Lippens, S., and Reiche, J.
(2021). The openeo api–harmonising the use of earth
observation cloud services using virtual data cube func-
tionalities. Remote Sensing, 13:1125.
Stonebraker, M., Frew, J., Gardels, K., and Meredith, J.
(1993). The SEQUOIA 2000 storage benchmark. In Pro-
ceedings of the 1993 ACM SIGMOD international con-
ference on Management of data, pages 2–11, Washington
D.C. USA. ACM.
DATA 2025 - 14th International Conference on Data Science, Technology and Applications
738
