
Simulation-Based Performance Evaluation of MEC-Assisted Collective
Perception Under Realistic Urban Traffic Load
Gergely Attila Kov
´
acs
1,2 a
and L
´
aszl
´
o Bokor
1,2 b
1
Department of Networked Systems and Services, Faculty of Electrical Engineering and Informatics, Budapest University
of Technology and Economics, M
˝
uegyetem rkp. 3., H-1111 Budapest, Hungary
2
HUN-REN-BME Cloud Applications Research Group, Magyar Tud
´
osok K
¨
or
´
utja 2, H-1117 Budapest, Hungary
Keywords:
Collective Perception, Multi-Access Edge Computing, NR V2X, 5G Uu Interface, CCAM.
Abstract:
Safety-related V2X applications require ultra-low latency and very high reliability. As cellular-based V2X
technologies gain more relevance, the autonomous driving (AD) enabler features of 5G and beyond, such as
network slicing technologies or Multi-access Edge Computing (MEC), become more available, and satisfy-
ing heavy communications requirements might become less of a challenge. Adopting such advancements is
especially important in reaching Connected, Cooperative and Automated Mobility (CCAM), where achieving
seamless service quality for infrastructure-supported AD functions like object fusion in the edge cannot be
guaranteed without auxiliary support. These systems must serve users in many safety-related use cases, thus,
it is essential to know or at least be able to estimate how the growing availability of V2X will affect exist-
ing edge infrastructure. Noticing how the V2X penetration ratio affects communication and object detection
parameters, and indirectly influences MEC performance, might hold practical insights on preparing edge in-
frastructure for future CCAM scenarios. Therefore, this paper studies the performance characteristics of MEC
applications for Collective Perception (CP) using realistic 5G radio, MEC, and urban traffic load models in
a large-scale V2X simulation framework and introduces a multi-library integrated simulation toolset with ap-
propriate methodology, object-fusion-aware edge node performance models, and example parameter studies.
1 INTRODUCTION
Cooperative applications opened a new horizon in ve-
hicular safety. Vehicle-to-Everything (V2X) technol-
ogy enables more advanced driver assistance systems
where the equipped physical sensors are not the only
input for assessing situations. Achieving cooperative
awareness by exchanging messages of status and at-
tribute information between vehicles and infrastruc-
ture elements was only the beginning. The so-called
Day 2 applications also enable sharing perceptions of
the surroundings (C2C-CC, 2021). Having a coop-
eratively built environmental model further broadens
the capabilities of safety applications. Further down
the roadmap of V2X safety applications, we see that
even more complex data, like intended paths, would
be shared, paving the road for partially and fully au-
tonomous vehicles able to cooperate thanks to V2X
connectivity.
This paper aims to provide tools and methods
a
https://orcid.org/0009-0003-7952-3145
b
https://orcid.org/0000-0003-1870-8544
for getting insight into how the large-scale adoption
of Collective Perception (CP) in urban environments
would affect the Quality of Service in V2X applica-
tions utilizing Multi-access Edge Computing (MEC).
The use case demonstrating a latency-sensitive ser-
vice with high data throughput of frequent messag-
ing is a simulated CP-based information dissemina-
tion/aggregation assisted by edge computing. We pro-
vide models for MEC application instantiation and re-
source allocation on the edge node. An appropriate
estimation for simulating fusion algorithm complex-
ity on the MEC host is also introduced. The goal of
the simulations in the current phase of this research
is to find out how our simulation model reacts to a
dynamic, realistic traffic load and the changes in the
different network and edge capacity parameters.
The remainder of the paper is as follows. Section
2 summarizes the relevant technologies addressed and
other related work. Section 3 describes our pro-
posed realistic simulation model, justifies the design
choices, and explains the model and implementation
details. Furthermore, the simulation parameters for
404
Kovács, G. A., Bokor and L.
Simulation-Based Performance Evaluation of MEC-Assisted Collective Perception Under Realistic Urban Traffic Load.
DOI: 10.5220/0013648200003970
In Proceedings of the 15th International Conference on Simulation and Modeling Methodologies, Technologies and Applications (SIMULTECH 2025), pages 404-411
ISBN: 978-989-758-759-7; ISSN: 2184-2841
Copyright © 2025 by Paper published under CC license (CC BY-NC-ND 4.0)

each sub-model are described in detail. Section 4
presents the results gained and the key takeaways. In
Section 5, we conclude the paper and draw future re-
search objectives.
2 RELATED WORK
Ad-hoc vehicular networks quickly evolved with the
developments in 4G and 5G cellular architectures.
With Cellular V2X (C-V2X), or NR V2X using 5G
technology, the usual benefits of mobile networks like
Internet access can be achieved. Still, it also enables
”traditional” V2X capabilities either by involving the
cellular infrastructure (Uu interface) or by allowing
for direct links between devices (PC5 interface). Ad-
ditionally, cellular connectivity is fit to reach cloud-
based auxiliary systems to access additional func-
tionality. In the future, an all-in vehicular network
might exist, essentially creating what may be called
the Internet-of-Vehicles (IoV) (Zhou et al., 2020) (He-
jazi and Bokor, 2021).
Multi-access Edge Computing (MEC) is a poten-
tial candidate that brings cloud-based solutions to a
more distributed approach and offers locally available
computational power. Optimal resource distribution,
lower latency, and support for various applications are
all among the tempting benefits of MEC for many
automotive use cases (Alalewi et al., 2021),(Maller
et al., 2023). Besides the complexity of particular al-
gorithms, the growing number of cars that can poten-
tially be a part of such systems also justifies the need
for creating and maintaining an auxiliary infrastruc-
ture. Therefore, the limitations of current implemen-
tations and possible future scenarios must be known.
A typical resource-heavy task where the assis-
tance of MEC systems seems inevitable is sensor fu-
sion of data from multiple sources. Collective Per-
ception is one of the key assets for extending the
observable environment by going beyond the capa-
bilities of particular sensors and relying on informa-
tion shared via V2X (Schiegg et al., 2021)(Hejazi and
Bokor, 2024). Supporting multi-sensor systems with
CP is an adequate approach to minimizing the blind
zone of a vehicle’s environmental perception, which
is also beneficial for implementing autonomous ve-
hicles (Li et al., 2024). Connected, Cooperative &
Autonomous Mobility (CCAM) is, to some extent,
the combination of the idea of the IoV, where the
seamless connection sets the basis for cooperative be-
havior and aims toward fully automated transporta-
tion. Recent trends show that certain vehicles are or
will gradually reach higher automation levels (5GAA,
2023a). Solutions involving bikes and scooters in
the connected mobility ecosystem using lightweight
V2X solutions have also emerged, which might ap-
peal to e-mobility services in cities. The digitaliza-
tion of road infrastructure is also gaining popularity
among road operators to provide better safety and
higher efficiency for road users. We see that en-
suring Ultra-Reliable Low Latency Communications
(URLLC) between different users of connected mo-
bility platforms (autonomous or regular vehicles, bike
or scooter users, etc.), providing seamless user ex-
perience with latency-sensitive applications requires
the support of a capable edge infrastructure (Soua
et al., 2018). However, in a real-world scenario with
users of different V2X service providers, relying on
different network operators, further challenges must
be solved for efficient MEC-based or MEC-assisted
safety applications (5GAA, 2023b).
3 THE SIMULATION
ENVIRONMENT
To study the V2X penetration ratio’s effect on the per-
formance of a MEC-assisted CP-based scenario, we
simulated realistic urban traffic patterns in the Artery
V2X simulation environment (Riebl et al., 2019) ex-
tended with the Simu5G (Nardini et al., 2020) li-
brary’s MEC implementation. We integrated the two
simulators beforehand and used them with less de-
tailed models in an earlier publication(Kov
´
acs and
Bokor, 2023). This section will describe how the new
models differ from our previous work to provide a
more in-depth view of the topic.
3.1 Realistic Urban Traffic Model
In the applied environment, traffic is still simulated
by the SUMO simulator. However, the overly sim-
plistic grid-like map structure with synthetically gen-
erated traffic is replaced with realistic traffic data of a
roughly 4 km
2
area of Bologna (Bieker et al., 2015).
Although more recent and more extensive models are
available for SUMO simulations, we opted for the
Bologna scenario for simple reasons. The complex-
ity of SUMO simulations is linear, i.e., the number
of vehicles simulated and simulation time have a lin-
ear correspondence. On the contrary, this correspon-
dence in Artery/OMNeT++ is quadratic, which makes
parameter studies with large traffic too long. Hav-
ing examined some of the available realistic SUMO
models, we figured that the Bologna map is the sweet
spot for our purposes. The number of vehicles in
the scenario quickly reaches 600-800, which is main-
tained during the simulation. A large V2X penetra-
Simulation-Based Performance Evaluation of MEC-Assisted Collective Perception Under Realistic Urban Traffic Load
405

tion ratio means plenty of simulated network devices
for Artery. Therefore, this traffic model suited our
simulation needs: a realistic urban environment with
satisfactory computing power requirements. The full
dataset comprises one hour of recorded data, however,
we opted for simulating only the first couple of min-
utes of the scenario.
3.2 5G Network and MEC Model
We also needed an adequate 5G infrastructure model
to serve the high number of nodes. First, we tried
to set gNodeB locations used by real operators based
on a crowd-sourcing-based tool called CellMapper
(CellMapper, 2010). However, instead of the few
locations shown by the tool, we set up 16 separate
gNodeBs, because Simu5G does not support multi-
ple cells served by one gNodeB. Naturally, this ap-
proach lacks the careful planning and configuration
of network cells in the real world. We placed the
16 gNodeB towers in a fully meshed 4x4 grid lay-
out. All cells and nodes use a single 2 GHz carrier,
and the number of resource blocks and the numerol-
ogy index are running parameters with multiple val-
ues tested in the simulation studies. The downlink and
uplink interference calculation supported by Simu5G
was turned on during the simulations. All other pa-
rameters shown in Table 1 are the Simu5G default set-
tings or set based on a study by the authors of the li-
brary and the example scenarios (Nardini et al., 2021).
Table 1: 5G model parameters.
Parameter Value
Carrier frequency 2 GHz
Resource Blocks 50,100 (parameter study)
CQI reporting period 40 TTIs
5G numerology index 0, 1 (parameter study)
Interference (DL/UL) ON
Number of gNodeBs 16
Our study focuses on enabling the simulation of
complex applications like sensor fusion based on the
Collective Perception Service (ETSI, 2023). In the
simulated scenario, the V2X-enabled vehicles send
Collective Perception Messages (CPMs) using 5G
connectivity to an MEC server, where an edge ap-
plication digests the incoming messages. Each regis-
tered vehicle sends CPMs to a specific app instance
and receives responses based on the content of the
CPM and the load on the edge host, as it would with
complex CP-based functionality (Kov
´
acs and Bokor,
2023). However, we revised two aspects of the load
model compared to our previous work to simulate the
processing delay of such MEC host functionality.
The first revised aspect is how a complex fusion
algorithm on the MEC host is simulated. The new
model still considers the amount of perceived ob-
ject information. Still, the basis for estimating the
required CPU instructions for processing a CPM is
based on a recent, low-complexity approach to CPM
data fusion (Mouawad and Mannoni, 2021). Like
most fusion algorithms, the method comprises two
major parts: tracking the list of known objects and
fusing the available data. Without an actual algo-
rithm implementation, we can only estimate each part
of the process based on the list of operations de-
scribed in the algorithm. The baseline was our in-
terpretation of the original approach. The steps re-
lated to tracking involve list searches, namely check-
ing the elements of a list (objects contained in a CPM)
against the elements of another list (the collection of
tracked objects), which has an overall complexity of
O(n
2
). More precisely, it would mean a complexity of
O(n∗k) where n and k represent the number of objects
in the CPM and the number of objects in the tracking
list, respectively. Checking the tracked objects that
were not updated with the CPM and are outdated can
be performed simultaneously by updating the list of
tracked objects with those contained within the CPM.
For the fusion part, merging close objects by a simi-
lar pair-wise approach would also mean O(k
2
) com-
plexity, meaning that the whole process’s complexity
is O(k
2
). However, since the object tracking list is
not modeled and the incoming CPMs per instantiated
MEC app are independent of each other, instead of
estimating the list size k, only the number n contained
in the CPM was considered for the calculations.
In Simu5G, MEC CPU performance and the ap-
plication load are modeled in Million Instructions
Per Second (MIPS). Therefore, a straightforward way
to extend the model is to determine the number of
instructions required to process an incoming CPM,
which will also affect the time required. We con-
sidered the above factors when designing the model
to simulate accurate dynamic behavior. Making the
model more realistic with appropriate parameter set-
tings and further extensions is a future task.
Equation 1 determines the algorithm complexity
described in the number of instructions I, where n is
the number of objects in the CPM.
I =
(
1, (n = 0)
α ∗ n
2
, (n > 0)
(1)
Note that the constants and coefficients are quasi-
arbitrary. The main purpose was to reflect the
quadratic behavior and see the growing trend of the
number of instructions and the time it takes to pro-
cess messages as the number of clients and detected
SIMULTECH 2025 - 15th International Conference on Simulation and Modeling Methodologies, Technologies and Applications
406

objects increases.
A possible way to improve the algorithm is to use
a different data structure instead of a list. Searching
if an object is already included in the tracked object
collection can be done faster if the entries are stored
in a self-balancing binary search tree (BST), which
typically implements map data structures. This way,
processing the objects within the CPM, i.e., inserting
new information and updating existing objects, can be
done in O(n ∗ log(k)) time by checking each object
from the CPM and performing the update/insertion.
However, dropping old entries cannot be performed
simultaneously, adding another O(k) time complexity.
Unfortunately, changing only the data structure does
not change the complexity of the merging procedure.
Therefore, the O(k
2
) complexity remains. Based on
these modifications and using the same estimations as
for the list-based approach, we set Equation 2 for the
required number of instructions I as below:
I =
(
1, (n = 0)
β ∗ (n ∗ log(n)+ n + n
2
), (n > 0)
(2)
Considering that in a live system, k is expected
to be greater (even by one or two orders of magni-
tude) than n, this change alone might significantly im-
pact the performance of a potential fusion mechanism
for the better. An additional overhead might be the
restructuring of the BST when vehicle pseudonyms
change and suddenly lots of new object identifiers ap-
pear. This overhead still has O(log(k)) time complex-
ity. Also, the pseudonym changes would negatively
affect the list-based approach as, for a short period,
the list size would increase greatly.
The admission control mechanism for the edge ap-
plication instantiation also needed refinements to pro-
vide more precise models for our simulations. In the
initial model version, each new user request to in-
stantiate an MEC application was accepted or denied
based on the available resources (CPU, RAM). This
meant that certain users could not utilize the service
at all, which defeats the purpose of V2X safety ser-
vices. Therefore, the model also had to be adjusted
to inflict additional processing delays when a grow-
ing number of requests come from many vehicles. A
possible method is to set the capacity of the host to
serve concurrent tasks and introduce a FIFO to handle
additional tasks (Massari et al., 2021). This way, no
user is denied the service itself, only the service qual-
ity decreases if there are too many simultaneous re-
quests. (Note: This might not be the perfect approach
to implementing many services in real life, but it cer-
tainly is suitable for modeling performance degrada-
tion.) In our case, the problem with this approach was
that the Simu5G MEC model handles resource allo-
cations and incoming requests differently compared
to (Massari et al., 2021). Due to the simplistic hard-
ware load modeling and the fact that the correspond-
ing applications handle each incoming request (CPM)
without a central load balancer, we deemed that im-
plementing a similar FIFO to schedule hardware ac-
cess would change the scope of this experiment too
much. Instead, the new model downscales the re-
sources allocated for each existing application and the
application to be instantiated if the new request can-
not be satisfied immediately. This means that above
a certain threshold, all applications will suffer a per-
formance degradation if no scaling up is possible due
to a lack of resources, essentially reaching the effects
of the FIFO approach in (Massari et al., 2021) but us-
ing a method that is much more compatible with the
original Simu5G MEC model approach.
Algorithm 1: Handling incoming requests.
Data: requested ← requested resources
Data: available ← available resources
Data: capacity ← maximum capacity
if requested ≤ available then
granted ← requested
else
ratio ←
capacity
available+requested
;
▷ Proportional downscale
DOWNSCALE(ratio);
granted ← requested ∗ ratio;
end
instantiate application with granted
resources;
available ← available − granted;
The essence of the above procedure is explained
in Algorithm 1. When a new request is received,
the orchestrator checks if the requested resources are
available. The requested application is instantiated if
possible, otherwise, the downscaling mechanism be-
gins. A variable ratio representing the downscale fac-
tor required for a proportional resource redistribution
is calculated. Each existing application instance is
downscaled using the procedure in Algorithm 2, and
then the new application is also instantiated.
Algorithm 2: Downscaling existing application instances.
Function Downscale(ratio):
for all instantiated apps do
granted ← granted ∗ ratio;
end
The introduced mechanism can also reallocate the
Simulation-Based Performance Evaluation of MEC-Assisted Collective Perception Under Realistic Urban Traffic Load
407

originally requested resources when other application
instances are terminated, and their resource alloca-
tions are freed, proportionally to the original resource
reservations. This mechanism can be examined in Al-
gorithm 3.
Algorithm 3: Freeing allocated resources when an applica-
tion instance is terminated.
Data: available ← available resources
Data: granted ← granted resources for the
app being terminated
Data: capacity ← maximum capacity
ratio ←
capacity
available−granted
;
available ← capacity;
for all other instantiated apps do
requested ← originally requested
resources;
granted ←
MIN(requested, granted ∗ ratio);
available ← available − granted;
end
3.3 Other Relevant Simulation
Parameters
The simulated vehicles in SUMO were mapped to two
car models in Artery: a simple model without V2X
and a model with 5G. The V2X-enabled were gener-
ating CPMs using the Collective Perception Service,
which were sent using the 5G Uu interface to an ap-
plication instance on the MEC host. We set the CPU
capacity of the server to 4000 MIPS in the first study
(Suryavansh et al., 2019)(Long et al., 2022). The sec-
ond study wanted to show the difference in the ob-
served service quality of the edge application with
a weaker server, so the CPU capacity was halved to
2000 MIPS for the second study. The V2X penetra-
tion ratio, indicating the percentage of V2X-equipped
simulated vehicles, was set to 20, 60, and 100 percent
to see how the MEC load or other KPIs like network
latency or user-experienced response time change.
We ran two kinds of parameter studies, i.e., the
simulations were run in two batches with different pa-
rameter combinations. Each study has running and
fixed parameters collected in Table 2. Parameter
Study 1 focused on setting up a baseline and seeing
how the 5G and the MEC load model react to a few
hundred cars using the 5G radio network and the edge
infrastructure. Parameter Study 2 was run with fewer
5G parameter combinations but with higher V2X pen-
etration, and also for longer, to focus on potential net-
work bottlenecks and the edge load with more users.
The coefficients α and β in Equations 1 and 2 were
set to 4 and 2, respectively, because with these values,
the difference in the resulting delays was visible even
with a moderate load on the MEC server. This choice
was adequate since the aim was to test the model’s be-
havior. For modeling realistic algorithm complexities
and how they behave, a further study of these coeffi-
cients and possibly more sophisticated model alterna-
tives would be necessary.
Table 2: Parameter values for different parameter study
groups.
Parameter Study 1 Study 2
Simulation duration 120 s 240 s
V2X penetration 30, 80 % 10, 60, 100 %
MEC capacity 4000 MIPS
2000, 4000
MIPS
MEC algorithm map list, map
Numerology index 0, 1
Resource Blocks 50, 100 100
α (Equation 1) 4
β (Equation 2) 2
Front radar range 80 m
Front radar FOV 60°
3.4 KPIs
In our current model, a CP-based use case is be-
ing implemented using 5G and an MEC server, with
the nodes (vehicles) sending CPMs to the server, the
server processing the CPM, and sending feedback
data to the origin vehicle. So, from the vehicle’s per-
spective, the most important KPI is how fast the re-
sponse for each CPM arrives back, i.e., how much the
round-trip time is. Naturally, this trip consists of an
uplink and downlink segment, which depends on the
network, and the processing task performed by the
MEC server, which is affected by the number of in-
coming CPMs and the time it takes to perform each
CPM (which depends on the algorithms). So, we fo-
cus on the round-trip time experienced by each user
vehicle, depending on the network parameters and the
MEC model (capacity, algorithm).
4 RESULTS
We showcased that our model extensions can sup-
port large-scale simulations implementing complex
use cases based on Collective Perception with MEC
infrastructure support, making it possible to develop
and evaluate novel C-ITS and ADAS applications in
this environment.
SIMULTECH 2025 - 15th International Conference on Simulation and Modeling Methodologies, Technologies and Applications
408
4.1 Study 1
Firstly, Study 1 showed a baseline for the simula-
tion model with about 300 vehicles inserted into the
simulation in 120 seconds. The trends were almost
identical for 30% and 80% V2X penetration ratio,
even though the latter has more users connected to
the network and using the edge node. The experi-
enced round-trip time seems to be mostly affected by
changing the numerology index, but not the number
of users. With the numerology index 1, there is a
slight increase in the slope of the graph. Still, gen-
erally, the latency does not seem to increase signif-
icantly with more users entering the simulation (see
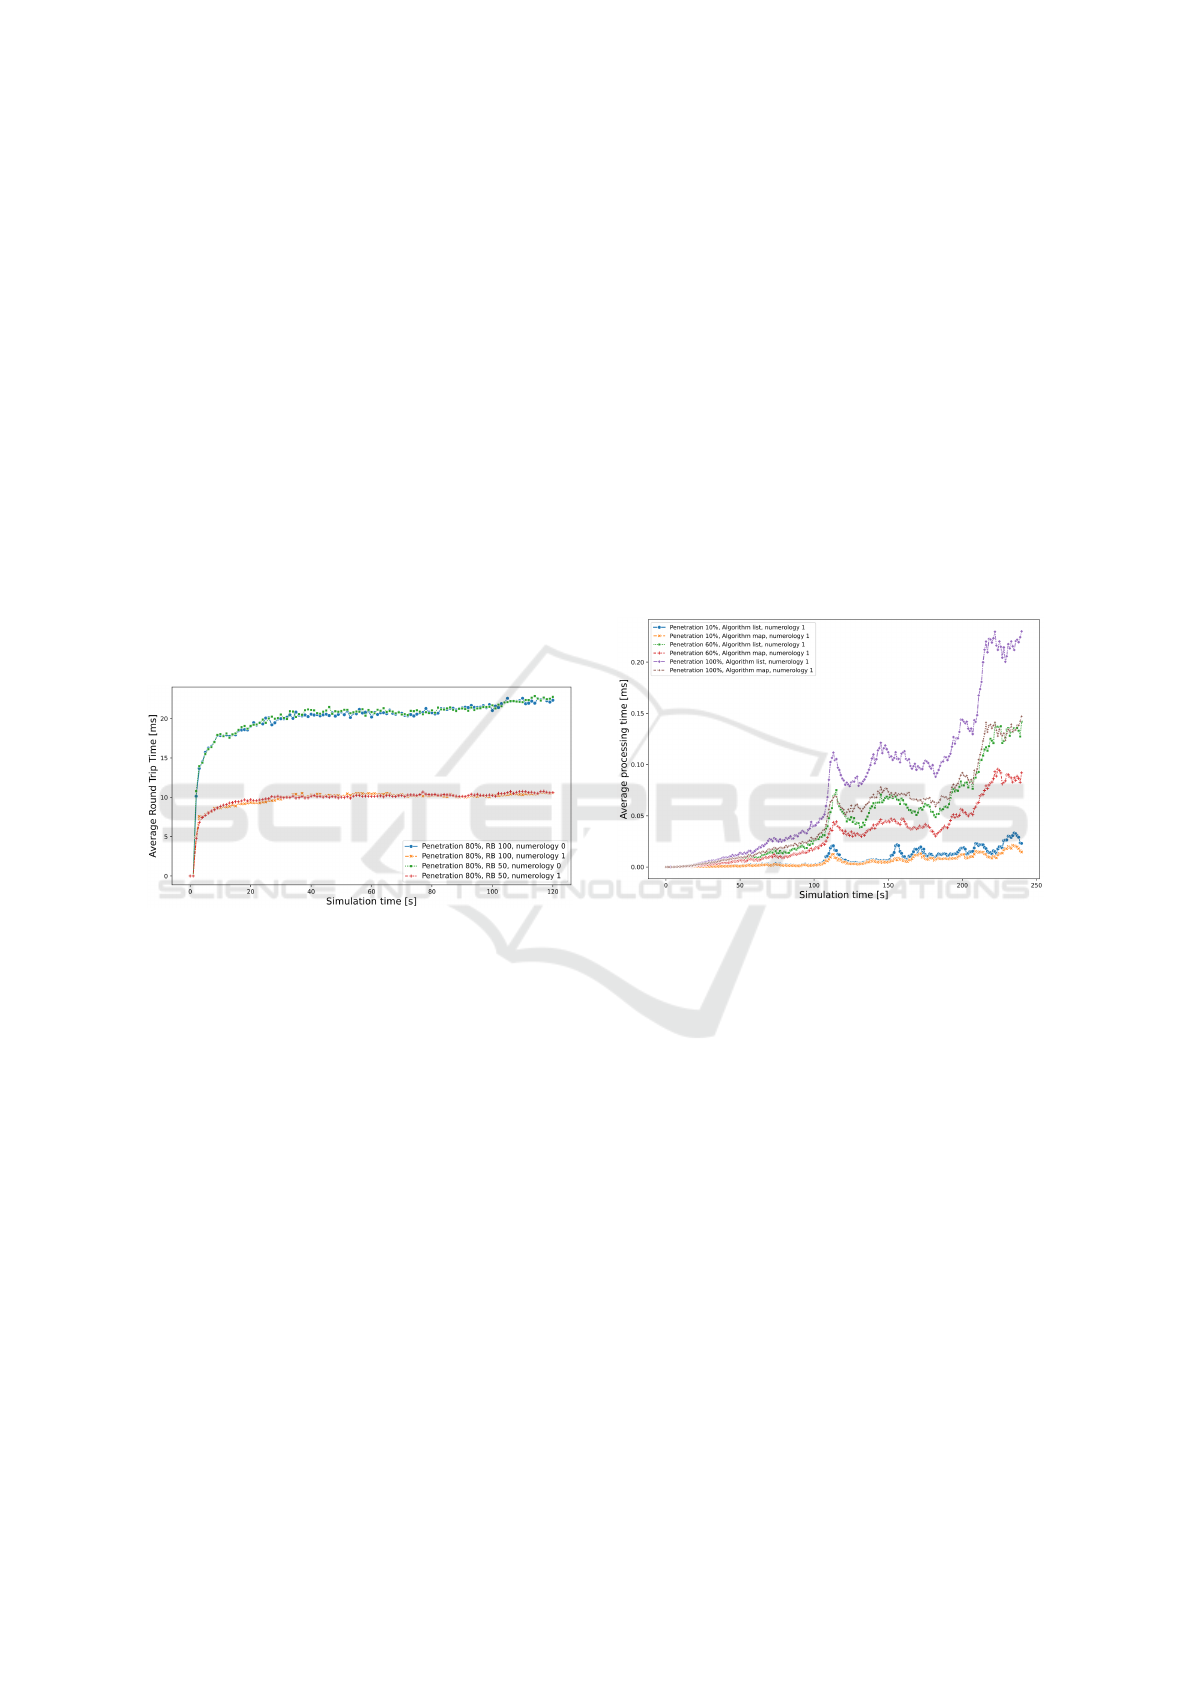
Figure 1). The most visible difference seen in Figure
1 regarding the latencies concerning the parameters is
in the case of changing the numerology index from
one to zero, which practically halves the average la-
tency experienced by the vehicles in the simulation.
This trend was also visible with fewer vehicles in the
scenario with 30% penetration.
Figure 1: Average experienced Round Trip Time (Study 1 -
80% penetration).
4.2 Study 2
The first reason for choosing the parameters as we did
for Study 2 was to see how an even increased vehicle
count would affect the experienced service quality. In
Study 1, setting the numerology index to 0 gave the
highest latency results. A slight increase in the aver-
age latency was also observable with more network
nodes. In Study 2, we saw the same trend, with the
gap between average latencies slightly increasing as
simulation time progressed. However, the average
latency still did not increase drastically as the num-
ber of cars increased. This could mean that either the
modeled network can handle a load even greater than
tested, or that this KPI alone does not fully describe
the experienced service quality, and other model as-
pects suffer from the increased load.
The second important validation of Study 2 was
to see how the MEC load model reacts with the dif-
ferent CPU capacity and CPM processing algorithm
complexity parameters. We make two observations
regarding the processing times that further back up
the capabilities of this simulation environment. The
first big noticeable difference between distinct param-
eter setups in Figure 2 is how the processing delay in-
creases as the penetration ratio rises. More connected
vehicles send more CPMs, possibly with even more
detections included in those messages, thus resulting
in higher delay. The second visible difference is be-
tween the processing algorithms. In the case of the
list-based algorithm variant, Equation (1) affects the
delay, whereas the map-based algorithm variant is af-
fected by Equation (2). As expected, the latter pro-
duces lower delays, meaning that different settings to
the load model (or substituting this part of the sim-
ulation with real fusion algorithms) can realistically
influence the processing delay and, thus, the perfor-
mance of any CP-based MEC service.
Figure 2: Average processing time of CPMs in the MEC
over simulation time (4000 MIPS capacity).
We ran another set of simulations with the MEC
server CPU capacity set to 2000 MIPS (see Table 2).
We observed similar trends, with the processing de-
lay reaching double the values compared to Figure 2
since half of the previous server capacity had to serve
the same load. However, this additional delay was
not significant enough to visibly increase the overall
round-trip time (see also Figure 3).
Study 2 gives more insight into the effects of real-
istic urban traffic (modeled by the Bologna scenario)
on CP and related functions, especially with 100%
V2X penetration. The number of vehicles nearly dou-
bled compared to Study 1, reaching a maximum of
about 550 cars in 240 seconds. This simulation study
can also be a reference for understanding the system
behavior from another perspective by looking at the
number of object detections embedded in the CPMs.
Figure 4 captures the Probability Density Function
(PDF) and Cumulative Distribution Function (CDF)
of the number of objects per CPM throughout the
Simulation-Based Performance Evaluation of MEC-Assisted Collective Perception Under Realistic Urban Traffic Load
409
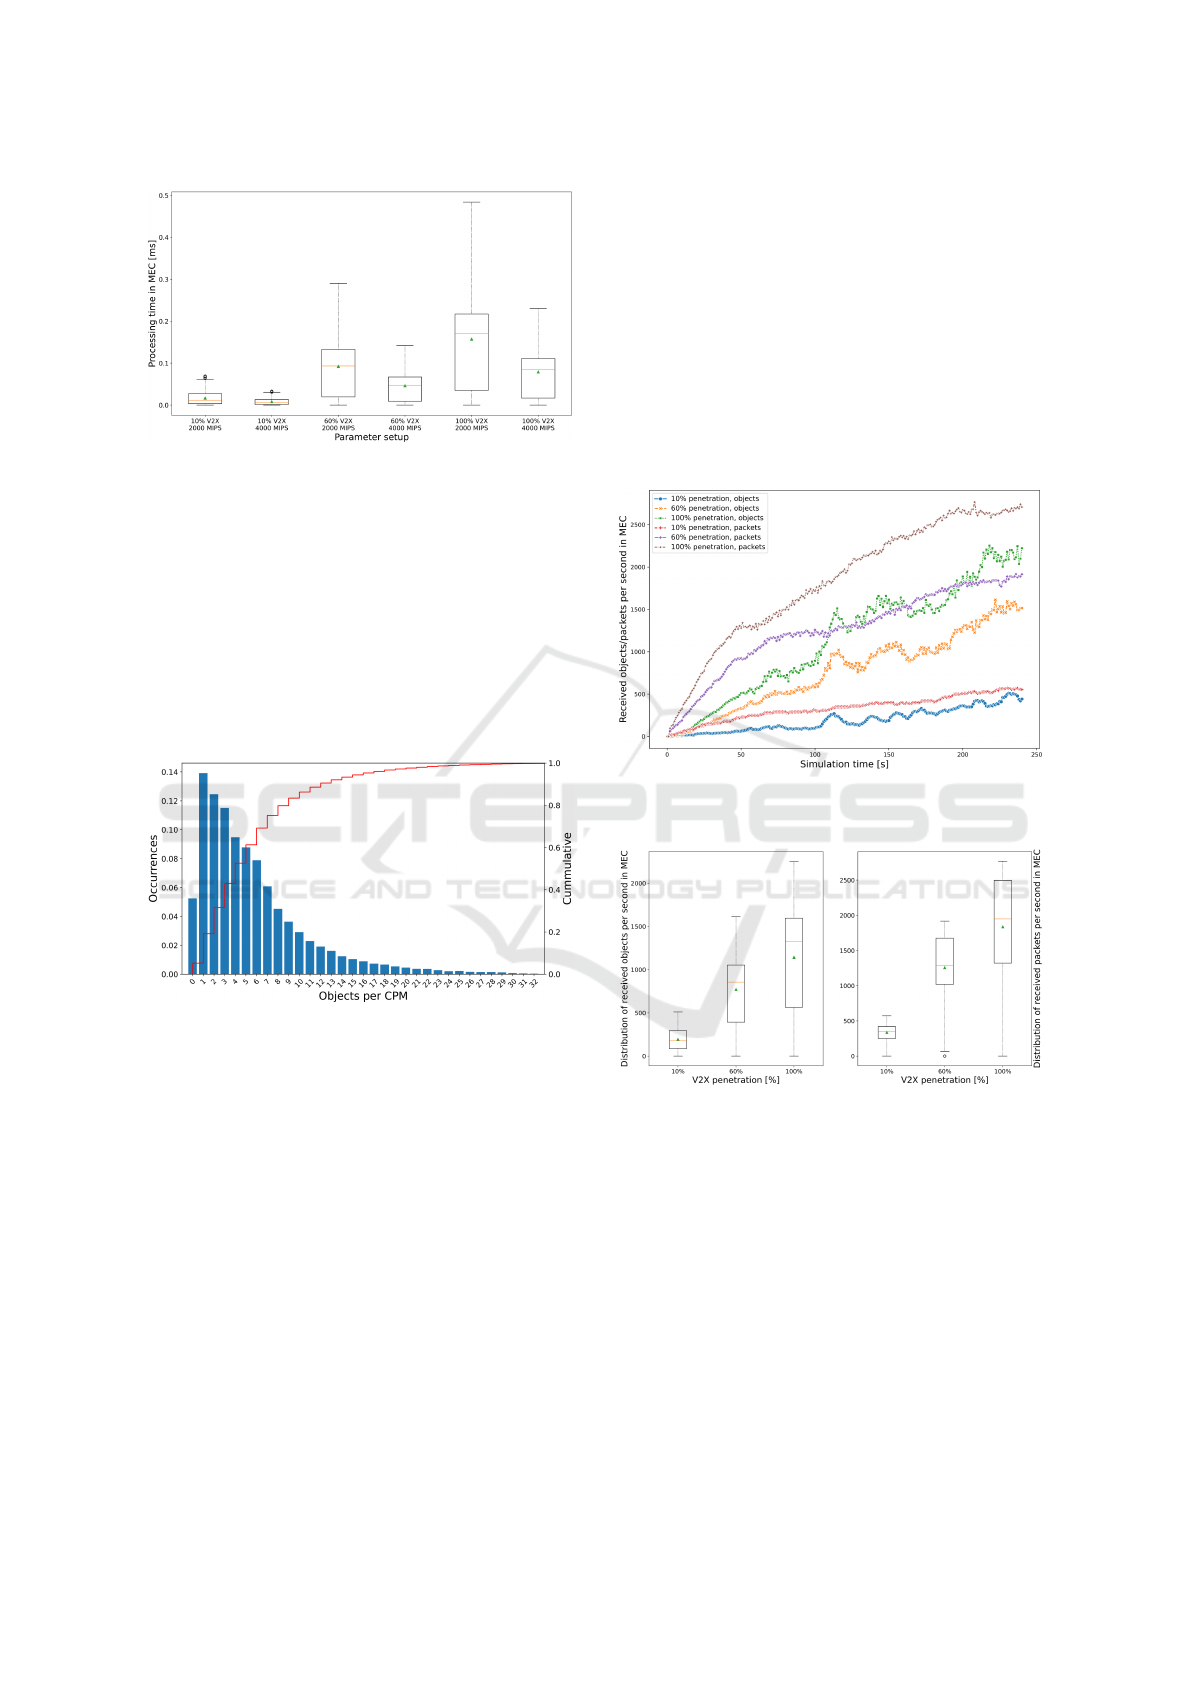
Figure 3: Distribution of CPM processing time in the MEC
over simulation time.
scenario. (Note: according to the standards, there
is a limit on how many object containers can be in-
cluded in each CPM, but in our implementation, we
neglected the limit to put as much stress on the edge
infrastructure as possible.) We can see that the traf-
fic is rather dense, and about 80% of the CPMs sent
reported 1-10 detected objects. (Note: the distribu-
tion could be different by changing parameters in the
environment model, e.g., by changing the number of
sensors and their properties, without altering traffic.)
Figure 4: Distribution of the number of detected objects per
CPM (PDF - blue bars, CDF - red line).
Considering the 5G connectivity and the edge ap-
plication, we can see how the number of objects re-
ported to the MEC applications changes over time. In
Figure 5, the increasing trends match how the num-
ber of nodes in the simulation increases over time,
with the occasional downfalls most likely represent-
ing the change in detected objects because of fewer
detections due to the nature of vehicle traffic in the
simulation. We can cross-reference the data about the
reported objects with the number of CPMs received
by the MEC server (see Figures 5 and 6) to ensure
that the occasional drops in the curve are not due to
hidden errors. The number of packets arriving shows
a monotonically increasing trend for all V2X penetra-
tion ratios tested, meaning that the network can serve
the nodes within the simulation, and the increasing
data range of the distributions also indicates the in-
crease in packets reaching the MEC. However, an in-
teresting phenomenon is that in the case of 60% and
100% penetrations, there are visible changes in the
slope that are not in line with the rate of new vehicles
coming in. That said, it is possible that some pack-
ets do not arrive at the MEC server, resulting in worse
service quality without affecting the average round-
trip time (i.e., the main KPI of the study). To see what
is happening during the scenario in more detail, the
definition of further KPIs and more simulation stud-
ies are necessary.
Figure 5: Number of detected objects/packets reported in
CPMs over simulation time (aggregated in MEC).
Figure 6: Distribution of detected objects/packets reported
in CPMs over simulation time (aggregated in MEC).
5 CONCLUSIONS
We described how the integrated Artery/Simu5G en-
vironment was extended to support MEC-based CP
services in a realistic urban traffic load based on a
well-known SUMO scenario. The edge load model
was modified with resource reallocation to support
the instantiation of newer MEC applications and mea-
sure the performance degradation. Multiple scenarios
were implemented and tested by experimenting with
different 5G parameters to see how the dynamically
SIMULTECH 2025 - 15th International Conference on Simulation and Modeling Methodologies, Technologies and Applications
410

created/deleted nodes resulting in a constantly grow-
ing number of users affect network performance, and
the user-experienced latency in a CP-based edge ap-
plication. Results show that the modeled 5G network
could keep up with the demand of that part of Bologna
and that the edge model responded to the growing de-
mand according to expectations.
FUNDING
The project supported by the Doctoral Excellence Fel-
lowship Programme (DCEP) is funded by the Na-
tional Research Development and Innovation Fund of
the Ministry of Culture and Innovation and the Bu-
dapest University of Technology and Economics.
REFERENCES
5GAA (2023a). Evolution of vehicular communication sys-
tems beyond 5G. Technical Report. [Online] https:
//5gaa.org/content/uploads/2023/08/5gaa-a-220058-5
geb-wp-v11-clean.pdf, Last accessed: 2025 Mar.
5GAA (2023b). Moving towards federated MEC de-
mos/trials (global MEC). Technical Report. [Online]
https://5gaa.org/content/uploads/2023/04/5gaa- m
oving-toward-federated-mec-demos-trials.pdf, Last
accessed: 2025 Mar.
Alalewi, A., Dayoub, I., and Cherkaoui, S. (2021). On 5G-
V2X Use Cases and Enabling Technologies: A Com-
prehensive Survey. IEEE Access, 9:107710–107737.
Bieker, L., Krajzewicz, D., Morra, A., Michelacci, C., and
Cartolano, F. (2015). Traffic Simulation for All: A
Real World Traffic Scenario from the City of Bologna.
In Behrisch, M. and Weber, M., editors, Modeling Mo-
bility with Open Data, pages 47–60, Cham. Springer
International Publishing.
C2C-CC (2021). Guidance for day 2 and beyond roadmap.
[Online] https://www.car-2-car.org/fileadmin/docum
ents/General Documents/C2CCC WP 2072 Roadm
apDay2AndBeyond V1.2.pdf, Last accessed: 2025
Mar.
CellMapper (2010). CellMapper. [Online] https://www.ce
llmapper.net, Last accessed: 2025 Mar.
ETSI (2023). ETSI TS 103 324 V2.1.1 (2023-06) – Intelli-
gent Transport System (ITS); Vehicular Communica-
tions; Basic Set of Applications; Collective Perception
Service; Release 2. [Online] https://www.etsi.org/del
iver/etsi ts/103300 103399/103324/02.01.01 60/ts 1
03324v020101p.pdf, Last accessed: 2025 Mar.
Hejazi, H. and Bokor, L. (2021). A Survey on the Use-Cases
and Deployment Efforts Toward Converged Internet
of Things (IoT) and Vehicle-to-Everything (V2X) En-
vironments. Acta Technica Jaurinensis, 15(2):58–73.
Hejazi, H. and Bokor, L. (2024). Modeling and evalua-
tion of cooperative Vulnerable Road User protection
schemes in realistic C-ITS environments. Computer
Networks, 246:110396.
Kov
´
acs, G. A. and Bokor, L. (2023). Implementation
of MEC-Assisted Collective Perception in an Inte-
grated Artery/Simu5G Simulation Framework. Sen-
sors, 23(18).
Li, L., Zhang, W., Wang, X., Cui, T., and Sun, C. (2024).
NLOS Dies Twice: Challenges and Solutions of V2X
for Cooperative Perception. IEEE Open Journal of
Intelligent Transportation Systems, 5:774–782.
Long, T., Ma, Y., Wu, L., Xia, Y., Jiang, N., Li, J., Fu, X.,
You, X., and Zhang, B. (2022). A novel fault-tolerant
scheduling approach for collaborative workflows in an
edge-IoT environment. Digital Communications and
Networks, 8(6):911–922.
Maller, L., Suskovics, P., and Bokor, L. (2023). Edge com-
puting in the loop simulation framework for automo-
tive use cases evaluation. Wireless Networks, 29:1–19.
Massari, S., Mirizzi, N., Piro, G., and Boggia, G. (2021).
An Open-Source Tool Modeling the ETSI-MEC Ar-
chitecture in the Industry 4.0 Context. In 2021 29th
Mediterranean Conference on Control and Automa-
tion (MED), pages 226–231.
Mouawad, N. and Mannoni, V. (2021). Collective Per-
ception Messages: New Low Complexity Fusion and
V2X Connectivity Analysis. In 94th IEEE Vehicular
Technology Conference (VTC2021-Fall), pages 1–5.
Nardini, G., Sabella, D., Stea, G., Thakkar, P., and Virdis,
A. (2020). Simu5G–An OMNeT++ Library for
End-to-End Performance Evaluation of 5G Networks.
IEEE Access, 8:181176–181191.
Nardini, G., Stea, G., and Virdis, A. (2021). Scalable Real-
Time Emulation of 5G Networks With Simu5G. IEEE
Access, 9:148504–148520.
Riebl, R., Obermaier, C., and G
¨
unther, H.-J. (2019). Artery:
Large Scale Simulation Environment for ITS Ap-
plications. In Virdis, A. and Kirsche, M., editors,
Recent Advances in Network Simulation: The OM-
NeT++ Environment and its Ecosystem, pages 365–
406. Springer International Publishing, Cham.
Schiegg, F. A., Llatser, I., Bischoff, D., and Volk, G. (2021).
Collective Perception: A Safety Perspective. Sensors,
21(1).
Soua, R., Turcanu, I., Adamsky, F., F
¨
uhrer, D., and Engel, T.
(2018). Multi-Access Edge Computing for Vehicular
Networks: A Position Paper. In 2018 IEEE Globecom
Workshops (GC Wkshps), pages 1–6.
Suryavansh, S., Bothra, C., Chiang, M., Peng, C., and
Bagchi, S. (2019). Tango of edge and cloud execu-
tion for reliability. In Proceedings of the 4th Workshop
on Middleware for Edge Clouds & Cloudlets, MECC
’19, pages 10–15, New York, NY, USA. ACM. Davis,
California.
Zhou, H., Xu, W., Chen, J., and Wang, W. (2020). Evolu-
tionary V2X Technologies Toward the Internet of Ve-
hicles: Challenges and Opportunities. Proceedings of
the IEEE, 108(2):308–323.
Simulation-Based Performance Evaluation of MEC-Assisted Collective Perception Under Realistic Urban Traffic Load
411
