
Bitcoin Fraud Detection: A Study with Dimensionality Reduction and
Machine Learning Techniques
Nuno Gomes
1
and Artur J. Ferreira
1,2 a
1
ISEL, Instituto Superior de Engenharia de Lisboa, Instituto Polit
´
ecnico de Lisboa, Portugal
2
Instituto de Telecomunicac¸
˜
oes, Lisboa, Portugal
Keywords:
Bitcoin, Feature Reduction, Feature Selection, Fraud Detection, Supervised Learning.
Abstract:
The use of cryptocurrencies corresponds to a remarkable moment in global financial markets. The nature of
cryptocurrency transactions, done between cryptographic addresses, poses many challenges to identify fraud-
ulent activities, since malicious transactions may appear as legitimate. Using data with these transactions,
one may learn machine learning models targeted to identify the fraudulent ones. The transaction datasets are
typically imbalanced, holding a few illicit examples, which is challenging for machine learning techniques to
identify fraudulent transactions. In this paper, we investigate the use of a machine learning pipeline with di-
mensionality reduction techniques over Bitcoin transaction data. The experimental results show that XGBoost
is the best performing method among a large set of competitors. The dimensionality reduction techniques are
able to identify adequate subsets suitable for explainability purposes on the classification decision.
1 INTRODUCTION
Cryptocurrencies such as Bitcoin (BTC) marked a
transformative moment in the global financial land-
scape. Based on distributed ledger technology
Blockchain, BTC allows rapid, decentralized, and se-
cure transactions, without intermediaries and facil-
itating global payments with reduced fees. As of
January 2025, the market capitalization of cryptocur-
rency exceeded $3.64 trillion, with BTC accounting
for approximately 55.53% of this value ($2.02 tril-
lion) (Team, 2024). This market presence has at-
tracted both legitimate users and malicious actors,
yielding an urgent need for security measures.
The evolution of cryptocurrencies posed a threat
to the foundations of the financial system. The de-
centralised nature of BCT, whilst innovative, presents
unique challenges for security, privacy, and fraud
prevention. The pseudo-anonymous characteris-
tics of transactions have enabled various illicit ac-
tivities, including money laundering and financial
fraud. Money laundering impacts between 2% and
5% of global Gross Domestic Product (United Na-
tions Office on Drugs and Crime, 2011), prompting
the need for Anti-Money Laundering (AML) frame-
works. These frameworks encompass customer iden-
a
https://orcid.org/0000-0002-6508-0932
tification, transaction monitoring, and suspicious ac-
tivity reporting. However, their effectiveness faces
limitations in cryptocurrency contexts due to trace-
ability challenges and regulatory fragmentation.
The European Union has comprehensive regula-
tion through the Markets in Crypto-Assets (MiCA)
framework. This legislation has rules to enhance
transparency, protect consumers, and prevent fi-
nancial crimes. The framework includes mecha-
nisms for tracking crypto-asset transfers and block-
ing suspicious transactions, strengthening market in-
tegrity. Despite these regulatory advances, detect-
ing fraud in BTC transactions remains challenging
due to the complex nature of cryptocurrency transac-
tions and the evolving sophistication of illicit activi-
ties. Unlike traditional financial systems with known
identities, BTC transactions occur between crypto-
graphic addresses without revealing personal infor-
mation (Nakamoto, 2008). This poses challenges in
identifying fraudulent activities, as malicious transac-
tions can appear legitimate while concealing illicit be-
havior (Weber et al., 2019). Consequently, Machine
Learning (ML) approaches become essential to ad-
dress these issues effectively.
In this paper, we devise a ML pipeline with dimen-
sionality reduction over imbalanced Bitcoin transac-
tion data. We resort to supervised ML techniques to
identify fraudulent transactions.
716
Gomes, N., Ferreira and A. J.
Bitcoin Fraud Detection: A Study with Dimensionality Reduction and Machine Learning Techniques.
DOI: 10.5220/0013647400003967
In Proceedings of the 14th International Conference on Data Science, Technology and Applications (DATA 2025), pages 716-723
ISBN: 978-989-758-758-0; ISSN: 2184-285X
Copyright © 2025 by Paper published under CC license (CC BY-NC-ND 4.0)

The remainder of the paper is organized as fol-
lows. Section 2 reviews the state-of-the-art of cryp-
tocurrency fraud detection techniques. The proposed
approach is described in Section 3. Section 4 reports
the experimental results of our approach and their key
findings. The paper ends in Section 5 with concluding
remarks and directions for future work.
2 RELATED WORK
This Section reviews related work on the topic ad-
dressed in the paper. First, we review cryptocurrency
fraud detection approaches in Section 2.1. Then,
we address the use of specific techniques on Bitcoin
transaction data in Section 2.2.
2.1 Cryptocurrency Fraud Detection
Figure 1 outlines key milestones in the development
of cryptocurrency fraud detection methods.
2008
Bitcoin Introduction
2009
Rule-Based Detection
2012
Statistical Methods
2016
Machine Learning (SVM, RF)
2019
Ensemble Methods, DNNs
2021
Graph Neural Networks
2023
Transformer Models
2024
Federated Learning
2025+
XAI, Quantum Resistance
Figure 1: A timeline of cryptocurrency fraud detection
methods.
The proposed approaches have evolved from rule-
based systems to ML techniques. Early methods,
while effective for identifying simple fraud patterns,
struggled with scalability and adaptability.
In the past years, ML approaches have become in-
creasingly applied to this problem. We now briefly
review some of ML techniques employed in this con-
text. Ensemble methods enhance predictive perfor-
mance by combining multiple models, thereby reduc-
ing variance, bias, and the risk of overfitting. Tech-
niques such as bagging, boosting, and stacking lever-
age diverse learning algorithms achieving more robust
and generalizable outcomes (Alarab and Prakoon-
wit, 2023a). Deep Neural Networks (DNN) employ
multiple hidden layers to model complex patterns in
high-dimensional data. These networks are trained
through a process called backpropagation, which ad-
justs the weights of the network to minimize the er-
ror in its predictions. Transformer models, based on
self-attention mechanisms, have revolutionized nat-
ural language processing and other sequential tasks
by enabling parallel processing and capturing long-
range dependencies (P
´
erez-Cano and Jurado, 2024;
Liu et al., 2024). Federated learning improves pri-
vacy and efficiency by decentralizing model train-
ing on multiple devices while preserving data local-
ity (Ahmed and Alabi, 2024). An approach based
on Explainable Artificial Intelligence (XAI) to pro-
viding interpretability and transparency to foster trust
and compliance in critical applications is proposed
by Taher et al. (2024). Recent approaches based on
Quantum Resistance, focused on developing crypto-
graphic algorithms resilient to quantum computing
threats, are proposed by Pushpak (2025); Allende
et al. (2023); Olutimehin (2025).
A survey of proposed approaches, is shown in Ta-
ble 1 with their advantages and shortcomings.
These techniques addressed different fraud detec-
tion challenges, namely scalability, interpretability,
and adversarial fraud techniques.
2.2 Bitcoin Fraud Detection
2.2.1 Early Approaches
Following Bitcoin’s introduction, early fraud detec-
tion approaches relied heavily on rule-based systems
and basic statistical analysis. These methods pri-
marily focused on transaction verification via the
blockchain consensus mechanism. Although effec-
tive in identifying basic fraud patterns, these mod-
els lacked adaptability to increasingly sophisticated
fraudulent schemes. Ngai et al. (2011) discuss the ap-
plication of data mining techniques in financial fraud
detection.
2.2.2 Machine Learning Approaches
ML techniques have been used to detect fraud within
BTC transactions, by identifying anomalous pat-
terns. We have approaches with supervised, unsuper-
vised, and semi-supervised learning techniques en-
hance fraud detection accuracy and efficiency.
Table 1: Advantages and Shortcomings of Proposed Ap-
proaches.
Year Methodology Advantages Shortcomings
2009 Rule-Based Detec-
tion
Simple, easy to implement High false positive rate, lacks
adaptability
2012 Statistical Methods Identifies basic transaction
patterns
Limited scalability, struggles
with new fraud techniques
2016 Machine Learning
(SVM, RF)
More accurate fraud detection Requires labeled data, inter-
pretability issues
2019 Ensemble Meth-
ods,DNN
Improved accuracy, better
feature extraction
Computationally expensive, re-
quires fine-tuning
2021 GNN Captures transaction relation-
ships effectively
Low interpretability, requires
large datasets
2023 Transformer Models Handles sequential transac-
tion data efficiently
High resource demand, potential
overfitting
2024+ Federated Learning,
XAI
Enhances privacy, improves
transparency
Implementation complexity, reg-
ulatory challenges
Bitcoin Fraud Detection: A Study with Dimensionality Reduction and Machine Learning Techniques
717

The 2016-2019 period marked significant ad-
vancements in the application of traditional ML tech-
niques to AML and BTC fraud detection. In the
following, we refer to some relevant approaches.
Monamo et al. (2016) apply unsupervised learning
(Trimmed K-means) to detect fraud in BTC transac-
tions. Pham and Lee (2017) explores anomaly de-
tection in BTC networks using unsupervised learn-
ing methods. They resort to a modified version of
SVM for unlabelled data, achieving greater consis-
tency in detecting anomalies, with a Dual Evaluation
Metric of 0.14415. Yin and Vatrapu (2017) estimate
the proportion of cybercriminal entities in BTC using
supervised ML. Three clustering methods—co-spend,
intelligence-based, and behaviour-based—were ap-
plied to categorize BTC transactions. The models
revealed that cybercrime-related entities account for
29.81% (Bagging) and 10.95% (Gradient Boosting)
of the total entities. Additionally, Bagging identi-
fied 5.79% of addresses and 10.02% of coins linked
to cybercrime. Harlev et al. (2018) demonstrates de-
anonymization of BTC entity types using supervised
ML. Their main finding was predicting the type of
a yet-unidentified entity using the Gradient Boost-
ing algorithm, achieving an accuracy of 77% and F1-
score of approximately 75%. Hu et al. (2019) detects
money laundering on BTC networks with deep walk
and node-to-vector techniques outperforming classi-
fiers in binary classification task reaching an average
accuracy of 92.29% and an F1-score of 93%. Weber
et al. (2019) experiments with GCN for anti-money
laundering in BTC. Zhang and Trubey (2019) inves-
tigates the use of ML models such as logistic regres-
sion, SVM, and artificial neural networks for money
laundering detection.
Recent studies have improved the performance of
traditional ML models for transaction classification
on blockchain-derived, manually labelled dataset.
These include Na
¨
ıve Bayes, SVM, Logistic Regres-
sion, Gradient Boosting, AdaBoost, Random For-
est (RF) (Chauhan et al., 2024; Taher et al., 2024;
Snigdha et al., 2024; Dutta et al., 2024), as well as
anomaly detection (Hisham et al., 2023), Long Short-
Term Memory (G
¨
urfidan, 2024), Federated Learn-
ing (Ahmed and Alabi, 2024) and Recurrent Neural
Networks (RNN) Abdulkadhim et al. (2024).
Md et al. (2023) proposed a classifier for detect-
ing fraudulent transactions on the Ethereum network.
Among individual models, RF achieved the highest
accuracy of 95.47%, followed by Gradient Boosting
at 94.61%. The Stacking classifier, combining Multi-
nomial NB and RF as base learners with Logistic Re-
gression as the meta-learner, attained the highest ac-
curacy of 97.18% with an F1 score of 97.02%
Despite its effectiveness, applying ML to fraud
detection presents challenges due to the immutable
and decentralized nature of blockchain data. The
lack of labeled data limits the effectiveness of super-
vised learning, which requires the use of unsupervised
clustering algorithms, such as K-means (MacQueen,
1967) and DBScan (Ester et al., 1996), to detect sus-
picious transaction clusters. Recent studies have also
explored the use of RNN and CNN to analyze transac-
tion sequences and detect anomalous behaviours. In
this context Di et al. (2022), suggested a framework
for modeling BTC transactions as a random graph to
exploit their structural properties and analyze them
from the Graph Theory perspective.
2.2.3 Deep Learning Approaches
Recently, the use of Deep Learning (DL) techniques
has been addressed. We briefly review some of
these approaches. GNN are employed to analyze
blockchain transaction networks, enabling the de-
tection of anomalous behaviour with high preci-
sion. For instance, GNN have achieved state-of-
the-art performance on Elliptic data, attaining an
accuracy of 98.99% and an F1-score of 91.75%
(Alarab and Prakoonwit, 2023b), by effectively cap-
turing complex relationships between blockchain en-
tities. Transformer-based models, including architec-
tures like BERT and GPT, have been adapted for fraud
detection, significantly enhancing anomaly detection
performance. These models excel at handling sequen-
tial transaction data and capturing long-range depen-
dencies, making them particularly effective in iden-
tifying patterns of fraudulent behaviour (Yang et al.,
2023).
3 PROPOSED APPROACH
In this Section, we describe the two phases of
our approach: baseline Exploratory Data Analysis
(EDA) and Dimensionality Reduction and Visualiza-
tion (DRV). Section 3.1 depicts the block diagrams of
these phases. Section 3.2 reports a detailed analysis
of the Elliptic dataset (Weber et al., 2019). The ML
techniques used in the two phases of our approach and
the evaluation metrics are summarized in Section 3.3.
3.1 Block Diagrams
The baseline EDA phase is depicted in Figure 2. From
the Elliptic dataset, we provide an exploratory analy-
sis of the data, organizing the data into two and three
classes. Finally, we evaluate ML models.
DATA 2025 - 14th International Conference on Data Science, Technology and Applications
718

Elliptic Dataset
Graphical Exploratory
Data Analysis
Prepare & Process Dataset for ML
(Split into 2 & 3 Classes)
Learn classifiers
Evaluate results
Figure 2: Phase 1 - The baseline Exploratory Data Analysis
(EDA) approach.
Elliptic dataset
(2class version and
3class version)
Dimensionality Reduction
(feature selection)
(ANOVA and XGBoost)
Dimensionality Reduction
(feature reduction)
(PCA and UMAP)
Find Explainability
(identify the most
decisive features)
Find Intrinsic
Dimensionality
(visualize the data
projected into lower
dimensionality space)
Learn classifiers
Evaluate
Learn classifiers
Evaluate
Figure 3: Phase 2 - The Dimensionality Reduction and Vi-
sualization (DRV) phase approach.
The DR phase is depicted in Figure 3. From
the several versions of the dataset, with two or three
classes, we perform DR with Feature Selection (FS)
and Feature Reduction (FR) techniques. We also ex-
plore combinations of FS and FR methods. The goal
of this phase is to find the best performing reduced di-
mensionality for this dataset and to identify the most
decisive features for explainability purposes.
3.2 Elliptic Bitcoin Transaction Dataset
The Elliptic Bitcoin transaction dataset (Weber et al.,
2019), comprises a Bitcoin blockchain transaction
graph where nodes represent individual transactions
(203,769 total) and edges denote Bitcoin flows be-
tween them (234,355 connections). The dataset has
166 attributes per transaction (94 local features and
72 aggregated features), organized across 49 tempo-
ral intervals representing 2-week periods. We have
a significant class imbalance, as described in Ta-
ble 2. This poses challenges for supervised learning
approaches as labeled data represents 22.85% of the
dataset (9.76% illicit vs 90.24% licit).
Table 2: Elliptic dataset class distribution.
Class Count Percentage
Illicit (class 1) 4,545 2.2%
Licit (class 2) 42,019 20.6%
Unknown (class 3) 157,205 77.2%
3.3 Machine Learning Techniques
In our experiments we have considered the following
ML methods. For FS, we have considered ANOVA F-
value and XGBoost Feature Importance for Explain-
ability. For FR, we have considered Principal Com-
ponent Analysis (PCA) and Uniform Manifold Ap-
proximation and Projection (UMAP). For the clas-
sification task, we have assessed many well-known
classifiers: Random Forest (RF), Decision Tree (DT),
XGBoost, LightGBM, CatBoost, Support Vector Ma-
chines (SVM), K-Nearest Neighbors (KNN), Multi-
Layer Perceptron (MLP), and Na
¨
ıve Bayes (NB).
We have considered the well-known evaluation
metrics, namely Accuracy, Precision, Recall, and F1-
score. We have also considered the use of the con-
fusion matrix, the area under the Receiver Operat-
ing Characteristic (ROC) curve designated as AUC,
and the Precision-Recall (PR) trade-off, preferred for
class imbalance assessment.
4 EXPERIMENTAL EVALUATION
In this Section, we report the experimental evaluation
of our proposed approach. Section 4.1 describes the
baseline EDA results on the original features, for the
2-class and the 3-class case. Section 4.2 reports the
experimental results of dimensionality reduction with
FS techniques, aiming to achieve explainability. The
experimental evaluation of dimensionality reduction
with FR techniques for visualization purposes and
FS/FR for classification is addressed in Section 4.3.
4.1 Baseline Results
4.1.1 Two-Class Dataset
Table 3 shows the results of classifiers on the two-
class original dataset (Class 1 and Class 2, in Table 2).
We use 10-fold cross-validation for the assessment.
The model with highest accuracy is XGBoost and
the model with the highest efficiency (defined as Ac-
curacy / Training Time) is KNN. Figure 6 depicts an
analysis of XGBoost binary classification results re-
garding the confusion matrix, ROC curve, and PR-
curve.
Class 1 shows 8,400 correct predictions and only 4
misclassifications as Class 0. Class 0 has 846 correct
Bitcoin Fraud Detection: A Study with Dimensionality Reduction and Machine Learning Techniques
719

Figure 6: XGBoost performance on the 2-class dataset: confusion matrix, ROC curve, and PR curve.
predictions, with 63 instances misclassified as Class
1. The model has nearly perfect Recall for Class
1 (8,400/8,404 = 99.95%) and very high Precision
(8,400/8,463 = 99.26%). The ROC curve shows AUC
of 0.9980. The curve rises almost vertically from the
origin, suggesting the model achieves very high true
positive rates with extremely low false positive rates.
The PR curve analysis shows a perfect performance
with an Average Precision (AP) of 1.00. Precision
remains at 1.0 across nearly the entire range of recall
values, only dropping slightly at the highest recall lev-
els. The model achieves perfect precision even when
recall increases.
The XGBoost model is particularly effective at
identifying Class 1 instances, with almost no false
negatives. Despite the presence of class imbalance,
the model maintains excellent performance across
evaluation metrics. The AUC of 0.9980 and AP of
1.00 suggest a model that would be extremely reliable
in production environments.
4.1.2 Three-Class Dataset
Table 4 shows the summary results of the ML meth-
ods to the 3-class original dataset.
The model with the highest accuracy is XGBoost.
Figure 7 depicts the analysis of the XGBoost classi-
fication results regarding the confusion matrix, ROC
curve, and PR-curve.
Class 2 shows the best performance with 30,874
correct predictions and relatively few misclassifica-
tions (480 as Class 1 and 87 as Class 0). Class 1
Table 3: Model comparison for 2-class classification. The
best accuracy is in boldface.
Model Accuracy Precision Recall F1 Score P. Time (s)
Efficiency
(Accuracy/Time)
Naive Bayes 0.6333 0.9198 0.6333 0.7064 4.13 0.1534
KNN 0.9753 0.9748 0.9753 0.975 0.66 1.4706
LinearSVC 0.9726 0.9718 0.9726 0.9718 192.06 0.0051
Decision Tree 0.9798 0.9801 0.9798 0.9799 225.37 0.0043
XGBoost 0.9928 0.9928 0.9928 0.9927 298.1 0.0033
SVM 0.9742 0.9735 0.9742 0.9734 612.54 0.0016
LightGBM 0.9919 0.9919 0.9919 0.9918 969.44 0.001
Random Forest 0.99 0.9901 0.99 0.9898 1040.6 0.001
CatBoost 0.9917 0.9918 0.9917 0.9916 1304.82 0.0008
Logistic Regression 0.9445 0.9403 0.9445 0.9406 1920.06 0.0005
MLP 0.9816 0.9814 0.9816 0.9815 2930.41 0.0003
has good performance with 7,409 correct predictions,
though with some misclassifications to Class 2 (995).
Class 0 has 750 correct predictions, with misclassifi-
cations primarily to Class 2 (132). All classes show
AUC scores above 0.98, indicating strong discrimi-
native power. Micro average AUC is 0.9960, sug-
gesting excellent overall classification performance.
Class 0 has the highest individual AUC (0.9950),
followed by Class 1 (0.9900) and Class 2 (0.9887).
All ROC curves rise steeply at low false positive
rates, indicating the model achieves high true posi-
tive rates while maintaining low false positive rates.
The PR curve analysis shows a curve with strong
performance across all classes. Class 2 shows the
best precision-recall trade-off with Average Precision
(AP) of 0.9964. Class 0 shows degradation in preci-
sion at higher recall values (AP = 0.9222). Class 1
maintains good precision until very high recall val-
ues (AP = 0.9707). The micro-average AP is 0.9924,
confirming excellent overall performance.
The XGBoost model provides adequate perfor-
mance for the 3-class classification problem. The
model is particularly effective at identifying Class 2
instances. Despite class imbalance, the model attains
strong performance across all classes with high AUC
and AP scores.
4.2 Feature Selection
We now assess the use of FS techniques over the
dataset. Table 5 compares features selected by dif-
ferent methods for the 2-class dataset.
Table 4: Model comparison for 3-class classification. The
best accuracy is in boldface.
Model Accuracy Precision Recall F1 Score P. Time (s)
Efficiency
(Accuracy/Time)
Naive Bayes 0.3095 0.8052 0.3095 0.42 6.63 0.0467
Decision Tree 0.923 0.9237 0.923 0.9233 588.92 0.0016
KNN 0.9023 0.8997 0.9023 0.8984 1.28 0.7068
XGBoost 0.9578 0.9573 0.9578 0.9573 925.94 0.001
CatBoost 0.9526 0.9519 0.9526 0.9519 1334.09 0.0007
LinearSVC 0.8509 0.8295 0.8509 0.8281 1602.05 0.0005
Random Forest 0.9523 0.9519 0.9523 0.9512 1730.69 0.0006
LightGBM 0.9507 0.9501 0.9507 0.95 2033.22 0.0005
Logistic Regression 0.8533 0.8306 0.8533 0.8321 3225.23 0.0003
SVM 0.9009 0.8998 0.9009 0.8875 6718.72 0.0001
MLP 0.919 0.9173 0.919 0.917 15742.4 0.0001
DATA 2025 - 14th International Conference on Data Science, Technology and Applications
720
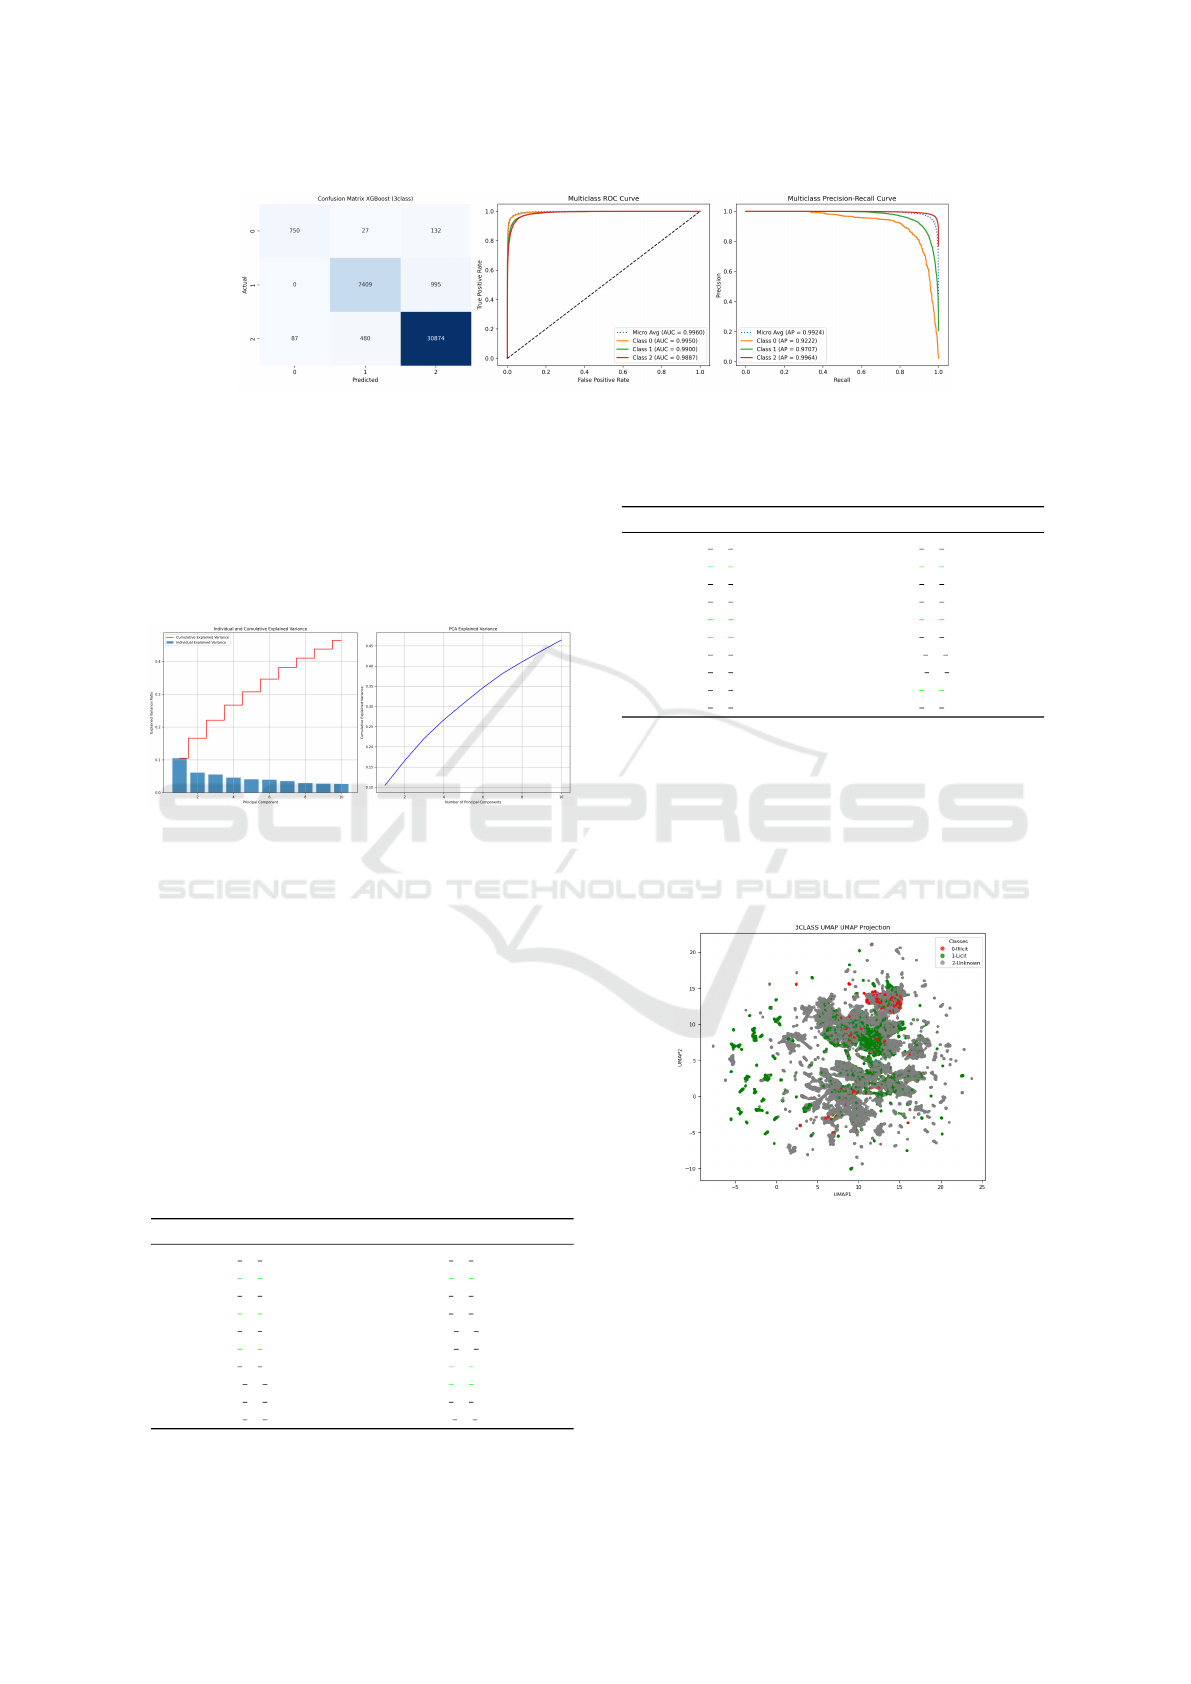
Figure 7: XGBoost performance on the 3-class dataset: confusion matrix, ROC curve, and PR curve.
Table 6 compares features selected by different
methods, for the 3-class dataset.
4.3 Feature Reduction
Figure 8 consists of two complementary plots analyz-
ing PCA results over the 3-class dataset.
Figure 8: PCA Explained variance for the 3-class dataset.
The individual and cumulative explained variance
shows both individual contribution (blue bars) and cu-
mulative explained variance (red step line) for the first
10 principal components. The first principal compo-
nent captures approximately 10% of the total vari-
ance. Subsequent components contribute progres-
sively less variance, exhibiting a typical elbow pat-
tern and the cumulative explained variance reaches
approximately 45% by the 10th component. This
PCA analysis reveals a dataset with high intrinsic di-
mensionality. No single component or small subset of
components captures the majority of variance. Even
Table 5: Comparison of features selected by different meth-
ods (2-class dataset). Top 10 features selected by each
method showing limited overlap (3 common features).
Selected Features (ANOVA) Selected Features (XGBOOST)
tx ftr 51 tx ftr 30
tx ftr 52 tx ftr 89
tx ftr 53 tx ftr 58
tx ftr 54 tx ftr 79
tx ftr 88 agg ftr 69
tx ftr 89 agg ftr 67
tx ftr 90 tx ftr 54
agg ftr 48 tx ftr 52
agg ftr 56 tx ftr 45
agg ftr 60 tx ftr 4
Table 6: Comparison of features selected by different meth-
ods (3-class dataset). Top 10 features selected by each
method showing limited overlap (3 common features).
Selected Features (ANOVA) Selected Features (XGBOOST)
tx ftr 51 tx ftr 19
tx ftr 52 tx ftr 59
tx ftr 53 tx ftr 84
tx ftr 54 tx ftr 75
tx ftr 58 tx ftr 58
tx ftr 59 tx ftr 33
tx ftr 60 tx ftr 4
tx ftr 64 agg ftr 30
tx ftr 65 tx ftr 52
tx ftr 66 tx ftr 47
with 10 components, less than half of the total vari-
ance is explained. This suggests a complex, high-
dimensional data structure where information is dis-
tributed across many features.
Figure 9 displays a UMAP visualization of the
dataset, reducing high-dimensional data to a 2D rep-
resentation.
Figure 9: UMAP Projection for the 3-class dataset.
The data points are colored by class: gray (2-
Unknown), green (1-Licit) and red (0-Illicit). The
projection shows complex, overlapping clusters with
some visible structure. Class 2 (Unknown, gray) ap-
pears most abundant and widely distributed. Class 1
(Licit, green) shows partial separation in some regions
but considerable overlap with Class 2. Class 0 (Illicit,
red) has fewer points and tends to overlap with both
Bitcoin Fraud Detection: A Study with Dimensionality Reduction and Machine Learning Techniques
721

other classes.
The UMAP visualization shows a significant over-
lap between classes. Some regions show higher den-
sity of specific classes, with partial discriminative
power in the features. The presence of small clus-
ters and substructures suggests potential subgroups
within each class. The manifold structure appears
complex, with multiple connected regions. While
complete class separation is difficult, there exist dis-
tinguishable patterns that ML algorithms might lever-
age. Some outlier points and smaller clusters appear
at the periphery, potentially representing unusual or
anomalous cases.
We now assess the evaluation of classification
with reduced dimensionality datasets, using XG-
Boost. Table 7 reports the results for the two-class
version dataset while Table 8 does a similar evalua-
tion for the three class version of the dataset.
Table 7: 2-Class reduced dimensionality with XGBoost.
The best global accuracy is in boldface. The best accuracy
with dimensionality reduction is highlighted in green.
Dataset Accuracy Precision Recall F1 Score P. Time (s) Efficiency
2class anova 0.9821 0.9818 0.9821 0.9816 0.37 2.6687
2class anova pca 0.9733 0.9725 0.9733 0.9724 0.35 2.7613
2class anova umap 0.9566 0.9569 0.9586 0.9574 0.22 4.3178
2class original 0.9928 0.9928 0.9928 0.9927 2.93 0.3386
2class original scaled 0.9931 0.9932 0.9931 0.9930 2.81 0.3533
2class pca 0.9715 0.9707 0.9715 0.9706 0.43 2.2647
2class umap 0.9553 0.9536 0.9553 0.9542 0.28 3.4115
2class xgboostfs 0.9839 0.9836 0.9839 0.9836 0.44 2.2515
2class xgboostfs pca 0.9802 0.9798 0.9802 0.9798 0.48 2.0252
2class xgboostfs umap 0.9764 0.9759 0.9764 0.9755 0.23 4.2638
Table 8: 3-Class reduced dimensionality with XGBoost.
The best global accuracy is in boldface. The best accuracy
with dimensionality reduction is highlighted in green.
Dataset Accuracy Precision Recall F1 Score P. Time (s) Efficiency
3class anova 0.9071 0.9045 0.9071 0.9036 3.97 0.2286
3class anova pca 0.8871 0.8845 0.8871 0.8789 4.00 0.2216
3class anova umap 0.8739 0.8700 0.8739 0.8615 3.24 0.2698
3class original 0.9578 0.9573 0.9578 0.9573 22.44 0.0427
3class original scaled 0.9576 0.9571 0.9576 0.9571 21.62 0.0443
3class pca 0.8867 0.8830 0.8867 0.8798 4.27 0.2078
3class umap 0.8657 0.8599 0.8657 0.8527 3.04 0.2852
3class
xgboost 0.9259 0.9244 0.9259 0.9238 3.76 0.2464
3class xgboostfs pca 0.8961 0.8939 0.8961 0.8901 3.92 0.2286
3class xgboostfs umap 0.8674 0.8646 0.8674 0.8547 2.92 0.2966
These DR reduction techniques do not improve
the classification results, as compared to the use of the
original dimensionality. However, data scaling im-
proves the results of XGBoost, for the 2-class case,
as compared with the ones reported in Table 3.
Among the classification models considered XG-
Boost provided the best results, performing better on
the 2-class dataset as compared to the 3-class dataset.
Combining insights from the data visualizations, we
conclude that the dataset exhibits high intrinsic di-
mensionality, as shown by the PCA analysis. The use
of dimensionality reduction techniques needs further
investigation.
5 CONCLUSIONS
The identification of fraudulent cryptocurrency trans-
actions has key importance. The transaction data
poses many challenges to machine learning methods.
These datasets have many features and are typically
imbalanced, with a few illicit examples.
In this paper, we have addressed the use of ma-
chine learning techniques over the Elliptic dataset
with Bitcoin transaction data, using dimensionality
reduction and classification techniques. Our experi-
mental evaluation has shown that the XGBoost clas-
sifier is the best performing method being resilient
to the natural class imbalance. The dimensional-
ity reduction techniques, with selection and reduc-
tion methods, were able to identify adequate and re-
duced subsets suitable for explainability purposes on
the classification decision. We have also addressed
the use of explainability techniques to identify the
most decisive features.
As future work, we plan to assess the effect of the
use of instance sampling techniques. We also plan
to explore more supervised dimensionality reduction
techniques to achieve lower dimensionality datasets.
ACKNOWLEDGEMENTS
This research was supported by Instituto
Polit
´
ecnico de Lisboa (IPL) under Grant
IPL/IDI&CA2024/ML4EP ISEL.
REFERENCES
Abdulkadhim, R., Abdullah, H., and Hadi, M. (2024). Sur-
veying the prediction of risks in cryptocurrency in-
vestments using recurrent neural networks. Open En-
gineering, 14.
Ahmed, A. and Alabi, O. (2024). Secure and scalable
blockchain-based federated learning for cryptocur-
rency fraud detection: A systematic review. IEEE Ac-
cess, 12:102219–102241.
Alarab, I. and Prakoonwit, S. (2023a). Graph-based LSTM
for anti-money laundering: Experimenting temporal
graph convolutional network with bitcoin data. Neural
Processing Letters, 55(1):689–707.
Alarab, I. and Prakoonwit, S. (2023b). Robust recur-
rent graph convolutional network approach based se-
quential prediction of illicit transactions in cryp-
tocurrencies. Multimedia Tools and Applications,
83(20):58449–58464.
Allende, M., Le
´
on, D., Cer
´
on, S., Pareja, A., Pacheco, E.,
Leal, A., and Silva, M. (2023). Quantum-resistance in
blockchain networks. Scientific Reports, 13(1):5664.
DATA 2025 - 14th International Conference on Data Science, Technology and Applications
722

Chauhan, R., Mehtar, K., Kaur, H., and Alankar, B. (2024).
Evaluating cyber-crime using machine learning and
AI approach for environmental sustainability. In Pro-
ceedings of the Sustainable Development through Ma-
chine Learning, AI and IoT, pages 37–49.
Di, Z., Wang, G., Jia, L., and Chen, Z. (2022). Bitcoin
transactions as a graph. IET Blockchain, 2:57–66.
Dutta, S., Sharma, A., and Rajgor, J. (2024). Ethereum
fraud prevention: A supervised learning approach for
fraudulent account recognition. In Proceedings of the
2024 1st International Conference on Trends in Engi-
neering Systems and Technologies.
Ester, M., Kriegel, H., Sander, J., and Xu, X. (1996). A
density-based algorithm for discovering clusters in
large spatial databases with noise. Proceedings of the
Second International Conference on Knowledge Dis-
covery and Data Mining (KDD-96), pages 226–231.
G
¨
urfidan, R. (2024). Suspicious transaction alert and block-
ing system for cryptocurrency exchanges in meta-
verse’s social media universes: Rg-guard. Neural
Computing and Applications, 36:18825–18840.
Harlev, M., Yin, H., Langenheldt, K., Mukkamala, R., and
Vatrapu, R. (2018). Breaking bad: De-anonymising
entity types on the bitcoin blockchain using super-
vised machine learning. In Proceedings of the 51st
Hawaii International Conference on System Sciences.
Hisham, S., Makhtar, M., and Aziz, A. (2023). Anomaly de-
tection in smart contracts based on optimal relevance
hybrid features analysis in the Ethereum blockchain
employing ensemble learning. International Jour-
nal of Advanced Technology and Engineering Explo-
ration, 10(109).
Hu, Y., Seneviratne, S., Thilakarathna, K., Fukuda, K., and
Seneviratne, A. (2019). Characterizing and detecting
money laundering activities on the bitcoin network.
https://arxiv.org/abs/1912.12060.
Liu, T., Wang, Y., Sun, J., Tian, Y., Huang, Y., Xue, T., Li,
P., and Liu, Y. (2024). The role of transformer mod-
els in advancing blockchain technology: A systematic
survey. arXiv.
MacQueen, J. (1967). Some methods for classification and
analysis of multivariate observations. Proceedings of
the Fifth Berkeley Symposium on Mathematical Statis-
tics and Probability, 1:281–297.
Md, A., Narayanan, S., Sabireen, H., Sivaraman, A., and
Tee, K. (2023). A novel approach to detect fraud in
ethereum transactions using stacking. Expert Systems,
40(7):e13255.
Monamo, P., Marivate, V., and Twala, B. (2016). Unsu-
pervised learning for robust bitcoin fraud detection.
In 2016 Information Security for South Africa (ISSA),
pages 129–134. IEEE.
Nakamoto, S. (2008). Bitcoin: A peer-to-peer electronic
cash system. Bitcoin.org. https://bitcoin.org/bitcoin.
pdf.
Ngai, E., Hu, Y., Wong, Y., Chen, Y., and Sun, X. (2011).
The application of data mining techniques in finan-
cial fraud detection: A classification framework and
an academic review of literature. Decision Support
Systems, 50(3):559–569.
Olutimehin, A. (2025). The synergistic role of machine
learning, deep learning, and reinforcement learning in
strengthening cyber security measures for crypto cur-
rency platforms. Asian Journal of Research in Com-
puter Science, 18(3):190–212.
Pham, T. and Lee, S. (2017). Anomaly detection in bitcoin
network using unsupervised learning methods. arXiv.
Pushpak, S. (2025). Quantum machine learning technique
for insurance claim fraud detection with quantum fea-
ture selection. Journal of Information Systems Engi-
neering and Management, 10(8s):750–756.
P
´
erez-Cano, V. and Jurado, F. (2024). Fraud detec-
tion in cryptocurrency networks—an exploration us-
ing anomaly detection and heterogeneous graph trans-
formers. Future Internet, 17(1):44.
Snigdha, K., Reddy, P., Hema, D., and Gayathri, S. (2024).
Bitpredict: End-to-end context-aware detection of
anomalies in bitcoin transactions using stack model
network. In Proceedings of the 3rd International Con-
ference on Advances in Computing, Communication
and Applied Informatics.
Taher, S., Ameen, S., and Ahmed, J. (2024). Advanced
fraud detection in blockchain transactions: An en-
semble learning and explainable AI approach. En-
gineering, Technology & Applied Science Research,
14:12822–12830.
Team, C. R. (2024). Global cryptocurrency market cap
charts. Available at: https://www.coingecko.com/en/
global-charts (Accessed: 23 April 2025).
United Nations Office on Drugs and Crime (2011). Estimat-
ing illicit financial flows resulting from drug traffick-
ing and other transnational organized crimes.
Weber, M., Domeniconi, G., Chen, J., Weidele, D. K. I.,
Bellei, C., Robinson, T., and Leiserson, C. E. (2019).
Anti-money laundering in bitcoin: Experimenting
with graph convolutional networks for financial foren-
sics. arXiv preprint arXiv:1908.02591. {https://arxiv.
org/abs/1908.02591}.
Yang, X., Zhang, C., Sun, Y., Pang, K., Jing, L., Wa, S., and
Lv, C. (2023). Finchain-bert: A high-accuracy auto-
matic fraud detection model based on nlp methods for
financial scenarios. Information, 14(9):499.
Yin, H. and Vatrapu, R. (2017). A first estimation of the pro-
portion of cybercriminal entities in the bitcoin ecosys-
tem using supervised machine learning. In 2017 IEEE
International Conference on Big Data (Big Data),
pages 3690–3699. IEEE.
Zhang, Y. and Trubey, P. (2019). Machine learning and
sampling scheme: An empirical study of money
laundering detection. Computational Economics,
54(3):1043–1063.
Bitcoin Fraud Detection: A Study with Dimensionality Reduction and Machine Learning Techniques
723
