
Data-Driven Prediction of High-Risk Situations for Cyclists Through
Spatiotemporal Patterns and Environmental Conditions
Sarah Di Grande
1a
, Mariaelena Berlotti
1b
, Salvatore Cavalieri
1c
and Daniel G. Costa
2d
1
Department of Electrical Electronic and Computer Engineering, University of Catania, Viale A. Doria n.6, Catania, Italy
2
SYSTEC-ARISE, Faculty of Engineering, University of Porto, Rua Dr. Roberto Frias, Porto, Portugal
Keywords: Machine Learning, Cyclists Safety, Risk Prediction, Urban Mobility.
Abstract: Enhancing cycling is an increasingly important challenge, especially as it is promoted for its economic,
environmental, and health benefits. However, ensuring safety of cyclists is crucial to support this shift in
mobility. In this context, machine learning offers promising avenues. This study proposes a novel approach
to identifying high-risk locations by dynamically incorporating spatiotemporal patterns and environmental
conditions. The method was tested using comprehensive data from Germany, and its design suggests strong
potential for generalization to different countries. This work can support urban planners, policymakers, and
navigation systems in improving road safety and informing smarter mobility decisions.
1 INTRODUCTION
Cycling is an increasingly popular mode of
transportation due to its economic, environmental,
and health benefits. However, its widespread
adoption is still hindered by a major concern: safety.
Despite its advantages, cycling remains one of the
most vulnerable forms of transport, with users often
perceiving it as riskier than motorized alternatives.
This perception is supported by the increasing
number of bicycle-related accidents reported
annually. For example, according to statistics from
the National Safety Council (NSC), the number of
deaths resulting from bicycle transportation incidents
increased by 53% over a ten-year period, from 2014
to 2023 (Bicycle Deaths, 2025). As a result, there is a
pressing need for effective measures to improve
cyclist safety.
Traditional interventions aimed at enhancing
cycling infrastructure and road signage have been
shown to reduce the severity of bicycle accidents. For
instance, in (Reynolds et al., 2009) it is shown that
purpose-built bicycle-specific facilities can decrease
crashes and injuries among cyclists. Additionally, in
(Asgarzadeh et al., 2017) the types of intersections
a
https://orcid.org/0009-0008-8895-2175
b
https://orcid.org/0009-0007-6564-704X
c
https://orcid.org/0000-0001-9077-3688
d
https://orcid.org/0000-0003-3988-8476
where crashes are more likely to result in higher
injury severity are highlighted, helping in identifying
localized safety solutions. Nevertheless,
infrastructure interventions have not been sufficient
to prevent accidents entirely, as evidenced by the high
number of fatalities. Recent advancements in data-
driven technologies, particularly Machine Learning
(ML), offer promising tools to support the prediction
and mitigation of traffic-related risks (Silva et al.,
2020).
While a growing body of research has explored
the use of ML in the context of bicycle safety, most
existing studies have concentrated on post-accident
analyses (Bassani et al., 2020; Ding et al., 2024; Zhu,
2021). However, few studies have addressed the
prediction of high-risk conditions for cyclists before
an accident occurs, which is a crucial step toward
proactive safety planning.
This research aims to fill that gap by developing a
ML model capable of predicting whether a given
situation is potentially high-risk for cyclists. The
novelty of our approach lies in its proactive
processing methodology, assessing risk beforehand.
By leveraging historical accident records along
with contextual environmental variables, the
Di Grande, S., Berlotti, M., Cavalieri, S., Costa and D. G.
Data-Driven Prediction of High-Risk Situations for Cyclists Through Spatiotemporal Patterns and Environmental Conditions.
DOI: 10.5220/0013646400003967
In Proceedings of the 14th International Conference on Data Science, Technology and Applications (DATA 2025), pages 677-684
ISBN: 978-989-758-758-0; ISSN: 2184-285X
Copyright © 2025 by Paper published under CC license (CC BY-NC-ND 4.0)
677

proposed model is able to identify high-risk locations
and conditions for cyclists. This can serve as a
valuable tool for urban planners, policy makers, and
navigation applications, enhancing road safety and
informing smarter mobility decisions. Furthermore, a
key strength of our approach is its generalizability: it
requires only a limited set of commonly available
features, making it adaptable across different
countries and urban contexts.
This paper is structured as follows: Section 2
reviews the existing literature on ML applications in
the context of bicycle risk prediction and positions the
contribution of this study within that body of work;
Section 3 describes the proposed methodology;
Section 4 presents and analyses the experimental
results; Section 5 describes a potential application of
our ML model for real-time bicycle risk prediction;
finally, Section 6 concludes the paper by
summarizing the key findings and outlining
directions for future research.
2 RELATED WORK
This section reviews previous research in the field of
bicycle accident analysis and risk prediction.
The study of cyclist safety has gained increasing
attention in recent years, largely due to the growing
availability of data and the prioritization of road
safety in urban policy. Two primary research
directions emerge from the existing literature: the first
involves post-event and spatial risk analysis; the
second focuses on real-time detection methods.
2.1 Post-Event and Spatial Risk
Analysis
The first category of research focuses on
understanding the severity of crashes, identifying
contributing factors based on retrospective crash data,
and analysing spatial risk.
(Zhu, 2021) developed classification models to
assess the severity of vehicle-bicycle crashes in
Victoria, Australia. The study aimed to identify the
variables that contribute to more severe crash
outcomes.
(Birfir et al., 2023) proposed ML models to
predict cyclist injury severity using Israeli road crash
data. The study identified the most influential factors
in determining whether an injury was minor, serious,
or fatal.
(Lu et al., 2022) combined ML and path analysis
to investigate behavioural pathways in bicycle-motor
vehicle crashes using data from North Carolina. Their
framework included two models: one to predict pre-
crash behaviours and another to estimate injury
severity, both informed by contributing behavioural
factors.
(Wang et al., 2019) analysed e-bike rider risk
patterns in China using ML and quasi-induced
exposure theory. The study classified riders into high-
risk and non-high-risk groups.
(Ding et al., 2024) introduced a hybrid ML-
regression framework to model bicycle crash
frequency in London. By combining SHAP-based
feature interpretation from Random Forests with
traditional regression analysis, the study quantified
the impact of multiple predictors on crash occurrence.
(Bassani et al., 2020) applied spatial analysis
techniques to identify crash hotspots involving
vulnerable road users in Turin.
(Brito et al., 2024) used a geospatial approach to
evaluate the risk of cyclist accidents in Münster,
Germany. K-means clustering was applied to road
intersections, bike lanes, and bus stops data, to
identify risk clusters within the city. Furthermore, the
authors found a correlation between past accident
data and the computed critical zones.
Collectively, these studies are instrumental for
policy-making, planning, and post-crash evaluation.
However, they are generally static and retrospective
in nature. In contrast, our work proposes a forward-
looking approach that predicts high-risk situations
before accidents occur, leveraging ML and dynamic,
spatiotemporal and environmental features. This
enables our model to be effectively used in real-time
safety applications and cyclist-aware mobility
solutions.
2.2 Real-Time Detection
The second area of research deals with real-time
accident detection and cyclist safety monitoring using
on-bike sensors and time series data.
(Tabei et al., 2021) proposed a real-time crash
detection system for cyclists using wearable sensors,
principal component analysis and ML model to
analyse motion data. The system aimed to detect
crash events and potentially trigger emergency
responses such as alerting emergency contacts.
(Schnee et al., 2021) developed a probabilistic
classification system based on on-bike sensors data to
distinguish between normal riding, near-miss events,
and actual crashes in real time. Their approach was
designed to be integrated into bike-mounted or
wearable safety devices, providing potentially
triggering emergency responses.
DATA 2025 - 14th International Conference on Data Science, Technology and Applications
678

(Lehmann et al., 2022) trained ML models on
helmet-collected time series data to classify
dangerous cycling segments in Copenhagen. The
system enabled both municipal-level risk analysis and
real-time user warnings via navigation apps.
These sensor-based methods are technically
sophisticated and accurate in detecting risk
conditions. However, their primary limitation is
scalability: they depend on individual riders being
equipped with sensors and require continuous
collection of detailed time series data. This could
create a barrier for widespread adoption. On the other
hand, our approach addresses this limitation by
providing a generalizable, data-efficient alternative,
enabling scalable deployment across cities.
2.3 Paper Contribution
This study introduces a novel, predictive ML
framework aimed at enhancing cyclist safety by
identifying high-risk scenarios for bicycle
involvement in traffic accidents.
The proposed model is trained on historical traffic
accident records, where each instance corresponds to
a known accident. Within this data record, some
accidents involved bicycles and others did not,
allowing us to formulate a binary classification task:
predicting whether or not a bicycle was involved
(target variable = 1 or 0) based on contextual features.
The selected features include only those variables that
are observable regardless of accident occurrence,
such as time of day, lighting and road surface status.
This approach enables the model to generalize
beyond retrospective analysis and become a tool for
conditional risk estimation, answering the question:
“Given that an accident occurs at a certain place and
time, under specific environmental conditions, how
likely is it that a cyclist would be involved?”.
The model can estimate cyclist risk in real-time or
for future scenarios, even where no accidents have yet
occurred, by using observable environmental
features. This forward-looking approach supports
urban safety planning, infrastructure prioritization,
and cyclist alert apps—without relying on real-time
sensors or intrusive data—ensuring efficient and
ethical application across various settings.
3 THE PROPOSED APPROACH
In this section, the proposed approach will be
presented in detail, covering the dataset description,
preprocessing steps, model development, and
evaluation.
3.1 Original Dataset Description
This study utilizes data from the open-access
Germany georeferenced road accident dataset
provided by the German Federal Statistical Office
(Data.Europa.Eu, 2024). The dataset comprises
detailed records of road accidents across Germany,
covering the period from 2016 to 2023.
The original dataset contains a wide range of
features related to each recorded accident. These
variables can be grouped into the following
categories:
Spatial attributes: including federal state,
administrative region, administrative district,
municipality, and geographical coordinate
(longitude and latitude);
Temporal attributes: such as year, month, hour,
and day of the week;
Accident severity: indicating whether the
accident resulted in fatalities, serious injuries, or
minor injuries;
Kind of accident: describing the sequence of
events that unfolded during the accident;
Type of accident: referring to the causal or
conflict situation that led to the accident;
Road surface conditions: categorized as dry,
wet/damp, or slippery due to winter weather;
Lighting conditions: distinguishing whether the
accident occurred during daylight, twilight, or
darkness;
Involved road users: identifying the categories
of participants, such as passenger cars,
motorcycles, bicycles, goods vehicles, and
public transport.
3.2 Variables Selection
Since the goal of this study is to predict high-risk
situations before an accident occurs, any variables
that are only available after an accident, such as
accident severity and type, were excluded from the
dataset. From the location-related features, only
geographic coordinates and federal state information
were retained, to provide the model with both a
precise spatial reference and a broader regional
context. Lastly, among the variables describing the
road users involved in each accident, only the binary
indicator for cyclist involvement was retained. This
variable takes the value 1 if a cyclist was involved in
the accident, and 0 otherwise. It serves as the target
variable in the classification task, enabling the model
to learn patterns that differentiate between accidents
that involved a cyclist and those that did not.
Data-Driven Prediction of High-Risk Situations for Cyclists Through Spatiotemporal Patterns and Environmental Conditions
679
While this variable explicitly reflects the
involvement of a bicycle in past accidents, its role in
the model allows for a broader, predictive application.
Indeed, when the trained model is applied to new
scenarios—situations in space and time where no
accident has occurred, but where the relevant
contextual features (e.g., location, time of day,
lighting, road surface) are known—the predicted
probability of cyclist involvement reflects how
similar that situation is to past accidents involving
cyclists. In this way, a predicted value of 1 suggests
that, if an accident were to occur under those specific
conditions, it would likely resemble past cyclist-
involved accidents, marking it as a high-risk scenario
for cyclists. Conversely, a value of 0 indicates
conditions historically associated with non-cyclist
accidents, implying lower relative risk to cyclists.
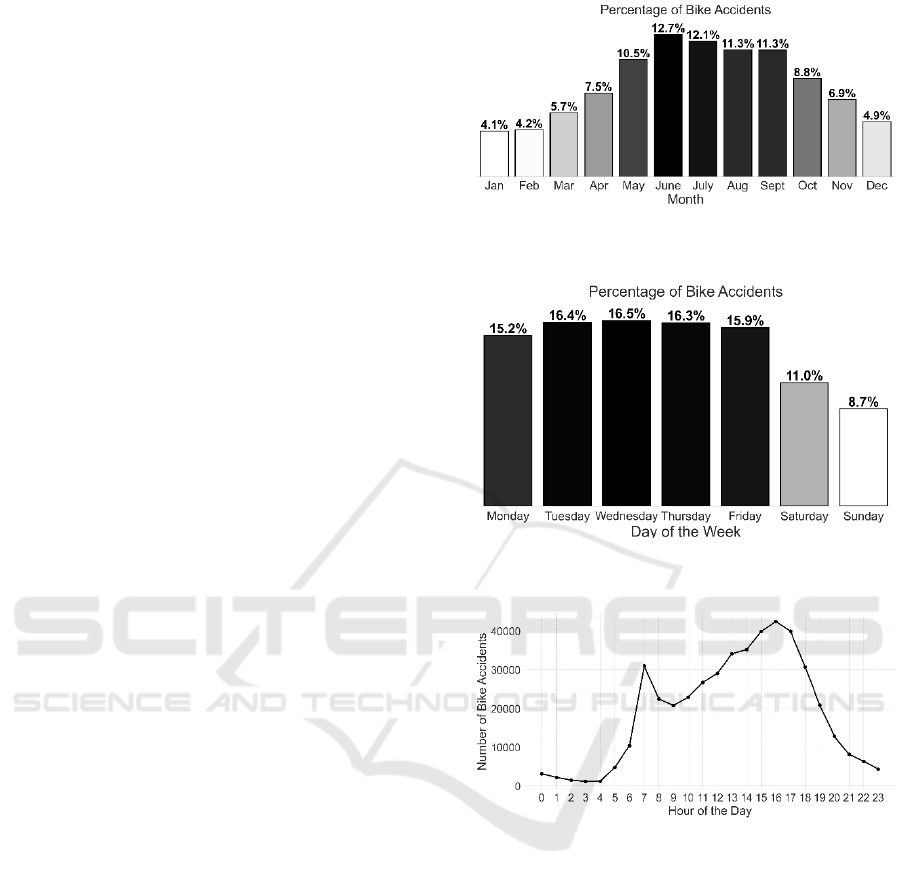
3.3 Feature Engineering
Feature engineering was applied to spatiotemporal
variables to explore whether transformations could
improve model performance.
The temporal variables accounting for month, day
of the week, and hour of the day were analysed to
examine how the number of bicycle-involved
accidents varied over time. Specifically, the aim was
to observe how accidents were distributed across the
months of the year, how their frequency changed
depending on the day of the week, and how they
varied over the hours of the day.
This analysis, conducted on data from 2016 to
2022 (Figures 1–3), revealed temporal patterns that
informed the feature engineering process. Based on
these patterns, the original time variables were
grouped into categories reflecting different levels of
cyclist-related risk and used as input features in the
model.
For the month variable, two grouping strategies
were used: a detailed three-level split (low-risk: Jan,
Feb, Dec; moderate-risk: Mar, Apr, Oct, Nov; high-
risk: May–Sep) and a binary split (low-risk: Jan, Feb,
Mar, Nov, Dec; moderate/high-risk: Apr–Oct). For
the day of the week, categories were either weekend
or weekday (low-risk: Sat/Sun; high-risk: Mon–Fri)
or separated into Sunday, Saturday, and weekdays for
finer granularity. Hourly risk was grouped as either
three levels (low: 0–5, 22–23; medium: 6, 8–11, 19–
21; high: 7, 12–18) or a three level simplified split
(low: 0–4, 23; medium: 5–6, 20–22; high: 7–19).
These categorizations allowed models to capture both
detailed and broad temporal risk patterns based on
accident frequency.
Figure 1: Percentage of bike accidents per month,
considering the total number of recorded accidents.
Figure 2: Percentage of bike accidents per day of the week,
considering the total number of recorded accidents.
Figure 3: Number of bike accidents per hour of the day,
considering the total number of recorded accidents.
To further enhance the predictive capability of the
model, an additional feature was engineered to
represent the spatial risk level associated with bicycle
accidents: bike accident density. This variable was
designed to incorporate localized accident history
into the dataset, providing spatial context that enables
the model to learn from patterns observed across
different geographic areas. This feature was created
by dividing Germany into 500 m × 500 m grid cells
and assigning each accident to its corresponding cell
based on geographic coordinates. The density
variable reflects the number of bicycle accidents in
each cell, capturing localized risk. To avoid data
leakage, density for each accident was calculated
using only data from prior years (e.g., 2018 risk used
DATA 2025 - 14th International Conference on Data Science, Technology and Applications
680

2016–2017 data), ensuring that model training relies
solely on historical information simulating a real-
world deployment scenario.
Therefore, the final dataset contains month, day of
week, hour (all with raw and two engineered
features), latitude, longitude, federal state, year,
lighting and road surface conditions, grid cell bike
accident density, and a binary target indicating cyclist
involvement.
3.4 Models Development and
Performance Evaluation
To develop the predictive classification model,
several ML experiments were conducted using the
processed dataset.
For models evaluation, the dataset was split into a
training set (from 2016 to 2022) and a test set (2023).
Initially, models were developed using only non-
engineered features. Subsequently, the impact of
including the variable representing the bike accident
density was evaluated to assess its predictive value.
Then, for temporal-related features, multiple
experiments were conducted to explore a variety of
configurations, including models using only raw date-
time features, models using only transformed
features, and models using a combination of both.
Following this, due to class imbalance, random
under sampling was applied to the majority class
through the imbalanced-learn library in Python
(Imbalanced-Learn Documentation, 2024).
All selected models are tree-based algorithms,
chosen for their high performance ability. Among the
most robust and widely used algorithms, the
following were implemented: Random Forest
(Breiman, 2001), XGBoost (Chen and Guestrin,
2016), Gradient Boosting (Friedman, 2001), Extra
Trees (Geurts et al., 2006), CatBoost (Prokhorenkova
et al., 2019), and LightGBM (Ke et al., 2017). The
models were developed using the Python scikit-learn
library (Pedregosa et al., 2011), with base
hyperparameter settings.
Evaluation metrics were carefully selected to
assess the performance of the models (Rainio et al.,
2024). In this task, missing a true bicycle accident is
costlier than a false positive, so maximizing recall for
Class 1 is prioritized. Weighted precision, recall, and
F1 score are also reported to ensure balanced
performance.
To compare model configurations, a metric-based
ranking was applied: models were ranked for each
metric (with ties assigned the same rank, and
subsequent ranks adjusted accordingly). Each
model’s total ranking score was the sum of its ranks
across metrics, with lower scores indicating better
overall performance.
4 RESULTS
In this section, the results achieved in the study will
be presented and discussed.
Multiple models were developed and evaluated to
identify the best-performing approach for the defined
prediction task.
4.1 Impact of Feature Engineering on
Models Performance
An initial experiment assessed the effect of adding the
bike accident density variable. The first test used
standard features (results in Table 1); the second
included bike accident density (Table 2).
Table 1: Models performance without accident density
variable.
Models Metrics
Recall 1 Precision Recall F1
RF 0.679 0.669 0.6 0.612
XGB 0.737 0.691 0.601 0.62
GB 0.751 0.665 0.552 0.56
ET 0.643 0.641 0.57 0.583
CatB 0.734 0.695 0.617 0.628
LGBM 0.733 0.679 0.589 0.6
Table 2: Models performance with accident density
variable.
Models
Metrics
Recall 1 Precision Recall F1
RF 0.731 0.694 0.616 0.628
XGB 0.764 0.71 0.627 0.638
GB 0.768 0.699 0.602 0.613
ET 0.71 0.682 0.607 0.619
CatB 0.764 0.712 0.631 0.642
LGBM 0.773 0.706 0.614 0.625
Including bike accident density improved all
models, highlighting the value of spatial accident
history for identifying high-risk situations.
As a second step, we conducted experiments to
assess the impact of various representations of the
month, day of the week, and hour variables. The
results indicate that Random Forest, Extra Trees,
LightGBM and CatBoost perform best with raw
temporal features, suggesting these models
effectively utilize the original structure of the data. In
contrast, Gradient Boosting benefits from selective
feature engineering for the month and day of the week
Data-Driven Prediction of High-Risk Situations for Cyclists Through Spatiotemporal Patterns and Environmental Conditions
681
variables (approach 1), while retaining the hour
variable in its raw form. XGBoost achieved optimal
performance with a combination of raw features for
month and hour and an engineered representation for
the day of the week (approach 1).
4.2 Performance of Best-Performing
Models
In Table 3, the performance of the final best models
for each algorithm is reported. Models are listed in
descending order of performance.
Table 3: Models performance in descending order.
Models Metrics
Recall 1 Precision Recall F1
CatB 0.764 0.712 0.631 0.642
XGB 0.762 0.71 0.628 0.639
LGBM 0.773 0.706 0.614 0.625
RF 0.731 0.694 0.616 0.628
GB 0.768 0.699 0.604 0.614
ET 0.71 0.682 0.607 0.619
CatBoost emerges as the top-performing
algorithm, confirming its ability to provide balanced
and high-quality predictions, and making it
particularly effective in settings where both class-
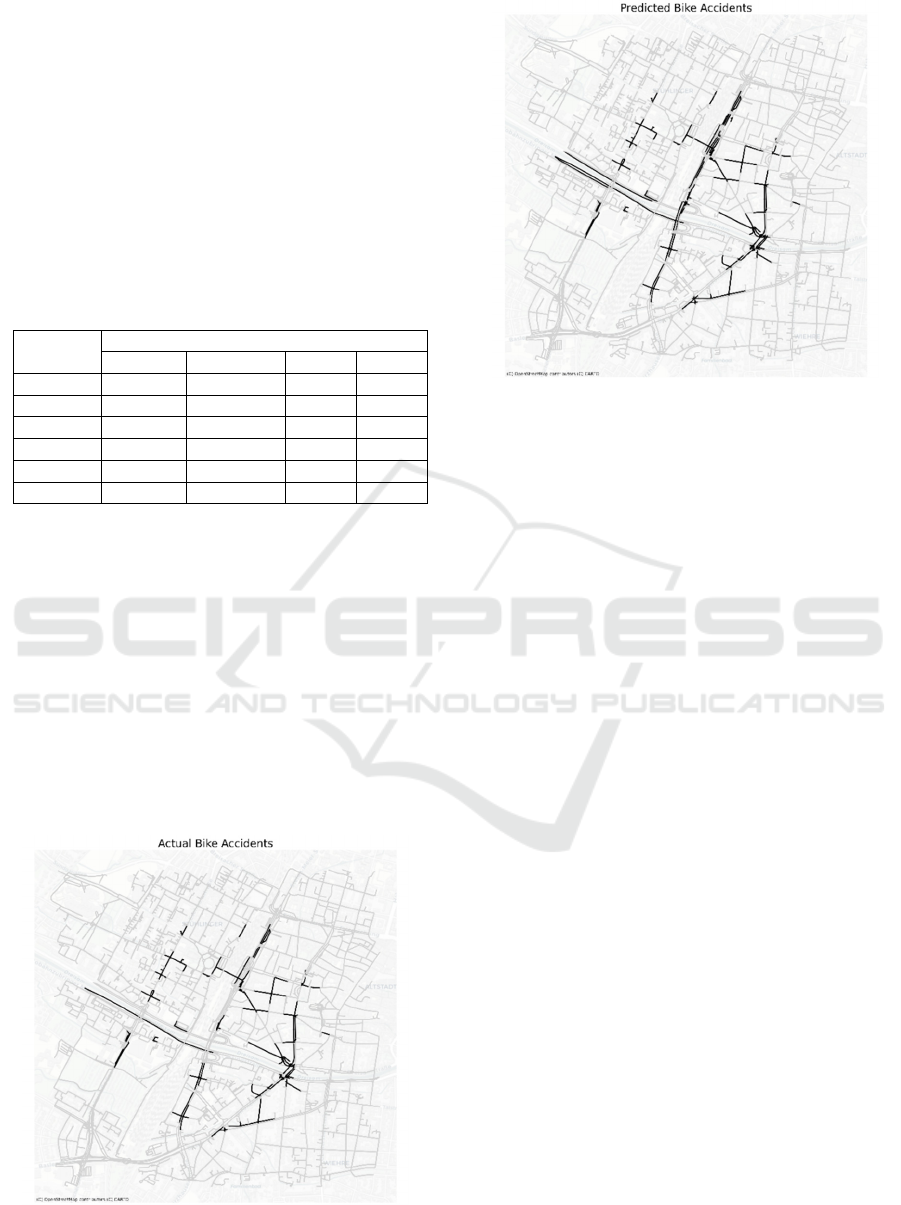
specific and overall performance matter. Figures 4
and 5 compare observed and CatBoost-predicted
bicycle accidents in Freiburg im Breisgau, illustrating
the model’s performance on a local example.
The road network shown is restricted to bike-
accessible streets. Street segments are coloured black
if at least one bike accident (actual or predicted)
occurred in close proximity. All other streets are
shown in light grey for context.
Figure 4: Actual Bike Accidents in an urban area of
Freiburg im Breisgau, Germany.
Figure 5: Predicted Bike Accidents by CatBoost model in
an urban area of
Freiburg im Breisgau, Germany.
Figure 4 shows actual recorded accidents, while
the Figure 5 displays accidents predicted by the
model. By comparing the two, we can see that the
model successfully identifies many of the high-risk
areas, including key intersections and major cycling
corridors. The number of streets with observed
accidents that were not predicted by the model is
relatively small. Conversely, some segments are
flagged by the model as high-risk despite having no
recorded accidents, which may indicate model
caution or areas where accidents are underreported.
5 PROPOSAL FOR REAL-TIME
BICYLE RISK PREDICTION
The proposed ML model is designed to function as a
real-time bicycle risk estimation tool that predicts
cyclist risk before accidents occur. This approach
offers a proactive method for identifying high-risk
conditions, allowing cyclists to make informed route
decisions in real-time.
A potential application of the model involves
predicting road safety within a 500-meter radius of a
cyclist’s specified location. By utilizing the cyclist’s
geographical coordinates (latitude and longitude) and
the time of the query, relevant spatiotemporal features
can be accurately extracted. Moreover, integrating
real-time weather data it would be possible to detect
current surface conditions, such as dry (sun), wet
(rain), or icy (ice).
To demonstrate the applicability of the model, we
simulated a scenario in which a cyclist is located in
Berlin (coordinates: 52.597858, 13.332482), in June
DATA 2025 - 14th International Conference on Data Science, Technology and Applications
682

2023 at 17:00 on a Monday, under dry road
conditions. Based on the cyclist’s location, the
accident density rate from the corresponding grid was
retrieved. Bicycle-accessible roads were identified
using the OpenStreetMap network graph (OSMnx
Documentation, 2024). Each road segment was
evaluated at three points (start, middle, end), with risk
classified as high if all points were identified as high-
risk by the model, moderate if one or two points were
high-risk, and low if none were high-risk. Figure 6
shows risk levels by colour: black for high-risk, grey
for moderate, dashed light grey for low-risk, with the
cyclist marked by an icon.
By providing real-time, localized risk predictions,
this tool demonstrates a practical application of the
proposed model for enhancing urban cycling safety.
The proactive identification of high-risk areas offers
cyclists valuable guidance for safer route planning,
potentially reducing accident likelihood and
improving overall cycling experiences.
Figure 6: Map with roads safety predictions.
6 CONCLUSIONS
This study proposed a data-driven approach to
proactively identify high-risk situations for cyclists
by leveraging spatiotemporal patterns and
environmental conditions, moving beyond
retrospective crash analysis.
Using data from a German accidents dataset, we
developed and evaluated several tree-based ML
models, exploring both raw and engineered features
derived from temporal and spatial characteristics. A
key contribution of this work lies in the integration of
a spatial accident density feature, computed through
a dynamic grid-based method that preserved temporal
integrity. The inclusion of this feature consistently
improved model performance across all algorithms.
Our results demonstrate that CatBoost
outperformed the other models in terms of both class-
specific and overall predictive performance. Another
key insight was the differential impact of feature
engineering across algorithms.
This work offers a scalable and generalizable
framework for forecasting cyclist risk in real-time. By
relying solely on pre-accident features, the approach
supports proactive safety measures, such as dynamic
route planning in navigation apps, where temporal
and spatial context can be inferred and environmental
conditions obtained from external sources. Future
work will focus on advanced model tuning, and
incorporating infrastructure data.
ACKNOWLEDGEMENTS
The work of Sarah Di Grande and Mariaelena
Berlotti, who has contributed to the development of
the micromobility model in urban scenarios, has been
supported by Italian Ministry for Research (MUR) in
the framework of PNRR M4C2 Line 1.4, “National
Centre for HPC, Big Data and Quantum Computing”,
Spoke 9 “Digital Society & Smart Cities” (Code
CN00000013, CUP E63C22001000006). The work
of Salvatore Cavalieri, who has contributed to the
development of the machine learning algorithm, has
been supported by MUR in the framework of PNRR
project PE0000013-FAIR (Future Artificial
Intelligence Research), Code PE0000013, CUP
E63C22001940006.
REFERENCES
Asgarzadeh, M., Verma, S., Mekary, R. A., Courtney, T.
K., and Christiani, D. C. (2017). The role of intersection
and street design on severity of bicycle-motor vehicle
crashes. Injury Prevention, 23(3), 179–185.
https://doi.org/10.1136/injuryprev-2016-042045
Bassani, M., Rossetti, L., and Catani, L. (2020). Spatial
analysis of road crashes involving vulnerable road users
in support of road safety management strategies.
Transportation Research Procedia, 45, 394–401.
https://doi.org/10.1016/j.trpro.2020.03.031
Bicycle Deaths. (2025). Injury Facts. https://injuryfa
cts.nsc.org/home-and-community/safety-topics/bicycle-
deaths/
Birfir, S., Elalouf, A., and Rosenbloom, T. (2023). Building
machine-learning models for reducing the severity of
Data-Driven Prediction of High-Risk Situations for Cyclists Through Spatiotemporal Patterns and Environmental Conditions
683

bicyclist road traffic injuries. Transportation
Engineering, 12, 100179. https://doi.org/10.1016/j.
treng.2023.100179
Breiman, L. (2001). Random Forests. Machine Learning,
45(1), 5–32. https://doi.org/10.1023/A:1010933404324
Brito, B., Costa, D. G., and Silva, I. (2024). Geospatial Risk
Assessment of Cyclist Accidents in Urban Areas: A K-
means Clustering Approach. 2024 IEEE 22nd
Mediterranean Electrotechnical Conf. (MELECON),
744–749. https://doi.org/10.1109/MELECON56669.2
024.10608791
Chen, T., and Guestrin, C. (2016). XGBoost: A Scalable Tree
Boosting System. Proceedings of the 22nd ACM
SIGKDD International Conference on Knowledge
Discovery and Data Mining, 785–794. https://doi.org
/10.1145/2939672.2939785
Data.europa.eu. (2024). Road Traffic Accidents in Germany.
https://data.europa.eu/data/datasets/f433e6d0-840b-4bfe
-bdc9-ba86f4245781?locale=en&utm_source=chatgpt.
com
Ding, H., Wang, R., Chen, T., Sze, N. N., Chung, H., and
Dong, N. (2024). A hybrid approach for modeling
bicycle crash frequencies: Integrating random forest
based SHAP model with random parameter negative
binomial regression model. Accident Analysis &
Prevention, 208, 107778. https://doi.org/10.1016/j.
aap.2024.107778
Friedman, J. H. (2001). Greedy function approximation: A
gradient boosting machine. The Annals of Statistics,
29(5), 1189–1232. https://doi.org/10.1214/aos/1013
203451
Geurts, P., Ernst, D., and Wehenkel, L. (2006). Extremely
randomized trees. Machine Learning, 63(1), 3–42.
https://doi.org/10.1007/s10994-006-6226-1
Imbalanced-learn documentation. (2024). https://imbalanc
ed-learn.org/stable/
Ke, G., Meng, Q., Finley, T., Wang, T., Chen, W., Ma, W.,
Ye, Q., and Liu, T.-Y. (2017). LightGBM: A Highly
Efficient Gradient Boosting Decision Tree. Advances in
Neural Information Processing Systems, 30. https://pa
pers.nips.cc/paper_files/paper/2017/hash/6449f44a102f
de848669bdd9eb6b76fa-Abstract.html
Lehmann, M., Mair, D., and Guehring, G. (2022). Danger
Detection for Cyclists with Machine Learning (In The
City Of Copenhagen). International Journal for Traffic
and Transport Engineering (IJTTE), 12, 272–290.
https://doi.org/10.7708/ijtte2022.12(2).09
Lu, W., Liu, J., Fu, X., Yang, J., and Jones, S. (2022).
Integrating machine learning into path analysis for
quantifying behavioral pathways in bicycle-motor
vehicle crashes. Accident; Analysis and Prevention, 168,
106622. https://doi.org/10.1016/j.aap.2022.106622
OSMnx documentation. (2024). https://osmnx.readthedocs
.io/en/stable/
Pedregosa, F., Varoquaux, G., Gramfort, A., Michel, V.,
Thirion, B., Grisel, O., Blondel, M., Prettenhofer, P.,
Weiss, R., Dubourg, V., Vanderplas, J., Passos, A., and
Cournapeau, D. (2011). Scikit-learn: Machine Learning
in Python. Scikit-Learn: Machine Learning in Python.
Prokhorenkova, L., Gusev, G., Vorobev, A., Dorogush, A.
V., and Gulin, A. (2019). CatBoost: Unbiased boosting
with categorical features (arXiv:1706.09516). arXiv.
https://doi.org/10.48550/arXiv.1706.09516
Rainio, O., Teuho, J., and Klén, R. (2024). Evaluation
metrics and statistical tests for machine learning.
Scientific Reports, 14(1), 6086. https://doi.org/10.1038
/s41598-024-56706-x
Reynolds, C. C., Harris, M. A., Teschke, K., Cripton, P. A.,
and Winters, M. (2009). The impact of transportation
infrastructure on bicycling injuries and crashes: A
review of the literature. Environmental Health, 8, 47.
https://doi.org/10.1186/1476-069X-8-47
Schnee, J., Stegmaier, J., and Li, P. (2021). A probabilistic
approach to online classification of bicycle crashes.
Accident Analysis & Prevention, 160, 106311.
https://doi.org/10.1016/j.aap.2021.106311
Silva, P. B., Andrade, M., and Ferreira, S. (2020). Machine
learning applied to road safety modeling: A systematic
literature review. Journal of Traffic and Transportation
Engineering (English Edition), 7(6), 775–790. https://
doi.org/10.1016/j.jtte.2020.07.004
Tabei, F., Askarian, B., and Chong, J. W. (2021). Accident
Detection System for Bicycle Riders. IEEE Sensors
Journal, 21(2), 878–885. IEEE Sensors Journal.
https://doi.org/10.1109/JSEN.2020.3021652
Wang, C., Kou, S., and Song, Y. (2019). Identify Risk
Pattern of E-Bike Riders in China Based on Machine
Learning Framework. Entropy, 21(11), Article 11.
https://doi.org/10.3390/e21111084
Zhu, S. (2021). Analysis of the severity of vehicle-bicycle
crashes with data mining techniques. Journal of Safety
Research, 76, 218–227. https://doi.org/10.1016/j.
jsr.2020.11.011
DATA 2025 - 14th International Conference on Data Science, Technology and Applications
684
