
A Comparison Study of Cloud Environment Simulations
Adri
´
an Jim
´
enez, Carlos Juiz
a
and Belen Bermejo
b
Computer Science Department, University of the Balearic Islands, Spain
Keywords:
Simulation, CloudSim, Datacenter, Performance.
Abstract:
Over the years, the need for cloud computing systems (virtualized) has continued to grow. For this reason,
it is necessary to evaluate their performance under different workload conditions. This is typically done by
benchmarking to assess their behavior with different workloads. Simulation tools offer a practical solution,
allowing evaluations to be carried out at a fraction of the cost compared to real-world deployments. CloudSim
is one of these tools, widely used to model complex cloud computing scenarios. In this work, we extend a
previous published real-world evaluation and aim to replicate it within a reproducible and flexible simulation
environment. This allows us to analyze system behavior under different workload intensities derived from real-
world arrival rate patterns. Since CloudSim does not natively support time-based realistic traces or efficient
data collection, we extended its functionality to address these limitations proposing a modular and reproducible
simulation system based on CloudSim.
1 INTRODUCTION
Over the years, the need for virtualized systems and
cloud computing has increased. Therefore, evaluat-
ing their performance under different loads is neces-
sary. This is because service, scalability, and quality
must be guaranteed. However, this poses a problem:
when we want to run tests to see how these systems
would perform under different loads, we find that it
is expensive, slow, and risky. For this purpose, there
are certain simulation tools that allow us to do so at a
cost comparable to that of the real world. CloudSim,
a simulator widely used by the research community,
can be used for this type of task. CloudSim (Buyya
et al., 2009) can help us solve complex cloud com-
puting scenarios. Of course, it does not exempt us
from having to make modifications to its codebase
to be able to use it as we wish. Therefore, in this
study, we use yours as a reference. The goal is to
replicate it, but in a simulated environment that is re-
producible and flexible. This will allow us to study
the behavior of the system under different load inten-
sities based on the arrival rate. This may work quickly
and in a controlled manner, but we still have a prob-
lem. CloudSim, by default, does not directly sup-
port realistic traces that act over time, much less ef-
ficient data collection. In this paper, we demonstrate
a
https://orcid.org/0000-0001-6517-5395
b
https://orcid.org/0000-0002-9283-2378
a modular and reproducible simulation system based
on CloudSim. Our contributions include:
• Generation of synthetic loads based on the arrival
rates of real traces
• A custom broker that accepts these types of traces
• A JSON configurator for fast and reproducible
testing
• Real-time data collection
• Evaluation of the system in a saturated state and
some measures to resolve it under high loads
2 RELATED WORK
Several studies have addressed the performance eval-
uation of virtualized cloud environments under trans-
actional workloads. Notably, (Juiz et al., 2023)
present a real-world case study involving a flight seat
availability service deployed on virtual machines, fo-
cusing on the full performance engineering process
from monitoring to tuning. Their work includes work-
load clustering, queuing network modelling (H/H/c
queues), capacity planning, and overhead estimation
for VM consolidation and containerization (Juiz and
Bermejo, 2024).
In contrast to their approach, our work focuses
on synthetic workload generation based on real ar-
rival rate traces and the extension of the CloudSim
398
Jiménez, A., Juiz, C., Bermejo and B.
A Comparison Study of Cloud Environment Simulations.
DOI: 10.5220/0013646300003970
In Proceedings of the 15th International Conference on Simulation and Modeling Methodologies, Technologies and Applications (SIMULTECH 2025), pages 398-403
ISBN: 978-989-758-759-7; ISSN: 2184-2841
Copyright © 2025 by Paper published under CC license (CC BY-NC-ND 4.0)

simulator to support flexible and reproducible perfor-
mance evaluations. While (Juiz et al., 2023). eval-
uate a production system with real monitoring data
and apply analytical and discrete-event simulation us-
ing QNAP2 (Potier, 1984), we build a lightweight
but powerful simulation environment through the
customization of CloudSim’s scheduling and broker
logic.
Moreover, our approach prioritizes real-time data
collection and low-memory simulation strategies, en-
abling the analysis of high-volume workloads (up to
320 million requests) on limited hardware resources.
Although we currently focus on system behavior un-
der variable load conditions, future work will explore
scaling policies and tuning strategies similar to those
studied in (Juiz et al., 2023).
Therefore, while both works share common goals
such as performance analysis, workload modeling,
and capacity evaluation, our methodology contributes
a more flexible and modular simulation platform
geared toward experimental reproducibility and work-
load variability exploration.
3 PROBLEM DEFINITION
Evaluating the performance of cloud-based systems
under varying workloads is a critical yet challenging
task. Real-world testing requires access to production
infrastructure, incurs significant cost, and introduces
potential risks to service stability. As a result, simula-
tion tools such as CloudSim are often used as a safer,
more controlled alternative. However, CloudSim in
its default form lacks support for several features re-
quired for realistic large-scale performance evalua-
tion, including trace-driven workload injection, run-
time data collection, and dynamic workload scaling.
In performance studies, it is important to consider
time-varying workload intensities that resemble real-
istic usage patterns. Static or uniformly distributed
workloads may fail to reflect the impact of bursty or
uneven demand, which can significantly affect system
behavior. For this reason, synthetic workload genera-
tion based on empirical arrival rate traces can provide
more representative simulation scenarios.
This work addresses these aspects by extending
CloudSim with the ability to run simulations based on
synthetic workloads derived from real arrival rate pat-
terns. The framework supports configuration through
JSON, streaming workload injection, and round-robin
scheduling via a custom broker. These features en-
able high-volume simulations to be executed on lim-
ited hardware, with results collected in real time for
post-analysis.
Figure 1: System model used in the simulation.
4 METHODOLOGY
This section presents the methodology followed for
the design, implementation, and evaluation of the
simulation environment. The main objective is to
realistically reproduce the system’s behavior under
different workload intensities, using the CloudSim
framework as the simulation backbone. To ensure that
the simulation is reproducible and robust, the process
was structured into several phases: workload model-
ing, system configuration, extension of the CloudSim
framework, and finally, data analysis (Heermann and
Heermann, 1990).
Each of these phases was designed with repro-
ducibility in mind, allowing us to validate system be-
havior and identify patterns observed in prior studies,
such as in [reference to previous work].
The following subsections describe the work-
load generation process, the modifications applied to
CloudSim, the simulation execution strategy, and the
methodology used to collect and analyze simulation
results.
4.1 System Understanding and
Workload Characterization
The system simulated in this work is based on the con-
figuration proposed in (Juiz et al., 2023). This setup
consists of two hosts, each containing four virtual ma-
chines (VMs), with 16 virtual cores (vCores) per VM,
one of which is reserved for the operating system. The
processor model used as reference is the Intel Xeon
Gold 6148, which features 20 physical cores and 40
threads, operating at a base frequency of 2.4 GHz.
Since the second host in the original setup was in-
tended for backup purposes, it was not used in our
experiments. Therefore, our simulations were con-
ducted using only four VMs with 16 vCores each.
The original data was provided by Bel
´
en and Car-
A Comparison Study of Cloud Environment Simulations
399

los. In our case, we selected the Italy 1 dataset, al-
though datasets 2 and 3 were also available for use.
After reviewing the results in the reference paper, we
decided to simulate only the first day of data. This day
was deemed sufficiently representative, as the original
paper shows that all five days exhibit a similar usage
pattern.
Using this selected dataset, we generated a syn-
thetic workload by extracting and analyzing its arrival
rate over time, which served as the foundation for our
simulation inputs.
4.2 Synthetic Workload Generation
The workload was generated using a tool. This
tool, based on a configurable random seed, uses the
dataset’s arrival rate, timestamp, and service time as
inputs. A specific time window is selected for gener-
ating the synthetic workload. For instance, the 0.5x
workload was divided into four 6-hour segments; the
1.0x workload followed the same segmentation; the
1.5x workload was divided into three 6-hour segments
and three 2-hour segments; and finally, the 2.0x work-
load was split into twelve 2-hour segments.
For each of these segments, a cubic interpolation
function λ
f
was computed to represent the arrival rate
over time. This function provides a smooth approx-
imation of the number of incoming requests per sec-
ond, reflecting the original dataset’s behavior. Using
λ
f
, a synthetic workload is generated by uniformly
distributing requests within short intervals (e.g., one
second), where the number of requests per interval
is determined by the interpolated arrival rate at that
point in time.
This approach enables us to test various system
load conditions in a controlled and reproducible way.
It also ensures that, in future experiments, new simu-
lations with higher or lower load intensities can be ex-
ecuted and compared under the same framework and
methodology.
4.3 CloudSim Framework Extension
This part of the work involved several mod-
ifications to the CloudSim source code, in-
cluding changes to core classes such as
CloudletSchedulerSpaceShared and CloudSim,
as well as the development of new features such
as custom brokers, workload readers, and a con-
figuration system for easy model switching and
reproducibility.
We started by addressing a rounding error found
in the CloudletSchedulerSpaceShared class. The
issue was resolved by applying a patch that corrected
inaccuracies in the scheduling logic. In addition, we
modified the CloudSim class to expose the internal
future event queue, enabling more detailed logging
and better tracking of scheduled events throughout the
simulation.
To support reproducible and flexible testing, we
implemented a configuration system based on JSON
files. This system automatically creates datacenters
and virtual machines according to the provided in-
put. In our case, we simulate a single host with four
VMs. Since CloudSim does not distinguish between
physical cores, virtual cores, or threads, we manually
set the number of processing elements (PEs) for the
host to 60, representing the total processing capac-
ity needed. The configuration file also includes fields
to define the input workload trace file and the output
path for storing simulation results.
To efficiently load workloads and ensure com-
patibility with CloudSim, we developed several
new classes. The Workload class, which extends
SimEntity, is responsible for sending cloudlets to the
broker based on the synthetic workload data. A sub-
class, TracefileWorkload, handles the retrieval and
submission of individual or batched requests. These
requests are read from an iterator obtained through a
custom Dataloader class. Rather than loading the
entire workload into memory, this component reads
the data stream on demand, significantly reducing
memory consumption.
With this infrastructure in place, we created a cus-
tom broker capable of processing the event stream
from the workload. This broker extends the default
DatacenterBroker in CloudSim and includes sev-
eral optimizations to improve resource usage. For
instance, we eliminated internal cloudlet lists to re-
duce memory overhead. Instead, execution results are
written in real time as each cloudlet finishes. This
greatly improves scalability when simulating large
workloads.
With this infrastructure in place, we created a cus-
tom broker capable of processing the event stream
from the workload. This broker extends the default
DatacenterBroker in CloudSim and includes sev-
eral optimizations to improve resource usage. For
instance, we eliminated internal cloudlet lists to re-
duce memory overhead. Instead, execution results are
written in real time as each cloudlet finishes, which
greatly improves scalability when simulating large
workloads.Unlike the default DatacenterBroker,
which only supports static cloudlet submissions and
lacks temporal control, our CustomBroker can re-
ceive and process cloudlets dynamically, driven by
external workload traces. It uses a round-robin
scheduling policy to distribute requests among vir-
SIMULTECH 2025 - 15th International Conference on Simulation and Modeling Methodologies, Technologies and Applications
400

tual machines and supports deferred queuing when
no VMs are available. Furthermore, to handle high
request volumes, we implemented an asynchronous,
buffered logging mechanism that writes execution
records directly to CSV files in batches, signifi-
cantly reducing heap memory usage and I/O over-
head. These enhancements are essential to simulate
large-scale, time-sensitive workloads efficiently and
reproducibly.
4.4 Simulation Execution Strategy
Due to certain technical limitations related to the
hardware running CloudSim, we were required to
split the simulations into smaller segments. This deci-
sion was motivated by the high memory consumption
of the Java Virtual Machine, which exceeded 27 GB
during execution—close to the system’s total capac-
ity of 32 GB. To prevent out-of-memory errors and
ensure simulation stability, we opted to divide each
test case into smaller execution windows.
In the 0.5x test case, the workload was divided
into four separate runs, each covering a 6-hour time
window. The same segmentation strategy was applied
in the 1.0x test case, with four 6-hour simulations.
In the 1.5x test case, we initially attempted to fol-
low the same approach with four 6-hour runs. How-
ever, due to the increased arrival rate—particularly
during the final hours—CloudSim could no longer
handle the memory requirements. To resolve this,
we divided the workload into eigth 3-hour segments,
allowing simulations to complete successfully within
the available memory limits.
In the 2.0x test case, we had to reduce the simula-
tion window even further, splitting the workload into
twelve 2-hour segments to prevent system overload.
These different execution strategies revealed that
in both the 1.5x and 2.0x test cases, a significant num-
ber of events remained queued throughout the simu-
lation. This behavior will be further analyzed and dis-
cussed in the results section.
Table 1: Workload segmentation strategy per arrival rate
multiplier.
Arrival Rate Nº Segments Duration
0.5x 4 6 hours
1.0x 4 6 hours
1.5x 8 3 hours
2.0x 12 2 hours
4.5 Data Collection and Post-Processing
To reduce memory consumption and improve sim-
ulation performance, data collection was performed
in real time as each cloudlet completed execution.
Rather than storing cloudlets in memory, which
would quickly exhaust available resources, each
cloudlet’s output was immediately written to a CSV
file.
Due to the volume of generated data—ranging
from approximately 80 million rows for the 0.5x test
case up to 320 million for the 2.0x test case—standard
tools like Excel were not suitable for process-
ing. Even opening the CSV files directly be-
came impractical. For this reason, we used Python
along with libraries such as pandas, numpy, and
matplotlib.pyplot to handle data manipulation
and visualization.
Before starting the analysis, we merged the CSV
files from each test case into a single file to facilitate
processing. This was done by applying time offsets
to align the timestamps of each segment sequentially.
Once merged, we calculated the per-VM utilization in
2-minute intervals.
However, due to the segmented nature of
the simulations—necessitated by technical limi-
tations—discontinuities appeared at the segment
boundaries. These breaks disrupted the continuity of
the resulting plots and metrics. To address this is-
sue, we applied a data interpolation strategy to smooth
transitions between segments.
The interpolation process was performed by iden-
tifying the final 2 minutes of a given segment and the
initial 2 minutes of the next one. We calculated the
average resource usage during these windows and re-
placed the corresponding values at the boundary with
the computed average. Finally, we applied linear
interpolation to smooth the transition between data
points.
This preprocessed and corrected dataset was then
used for visualization and deeper analysis, which will
be further discussed in the results and conclusions
sections.
5 RESULTS
Figures 1 to 4 show the virtual machine utilization
results for each of the tested scenarios.
As seen in the graphs, increasing the arrival rate
leads to a steady rise in utilization. This correlates
with longer service times, especially in the 1.5x and
2.0x test cases. In these scenarios, the system reaches
high operational limits, with VM utilization peaking
A Comparison Study of Cloud Environment Simulations
401
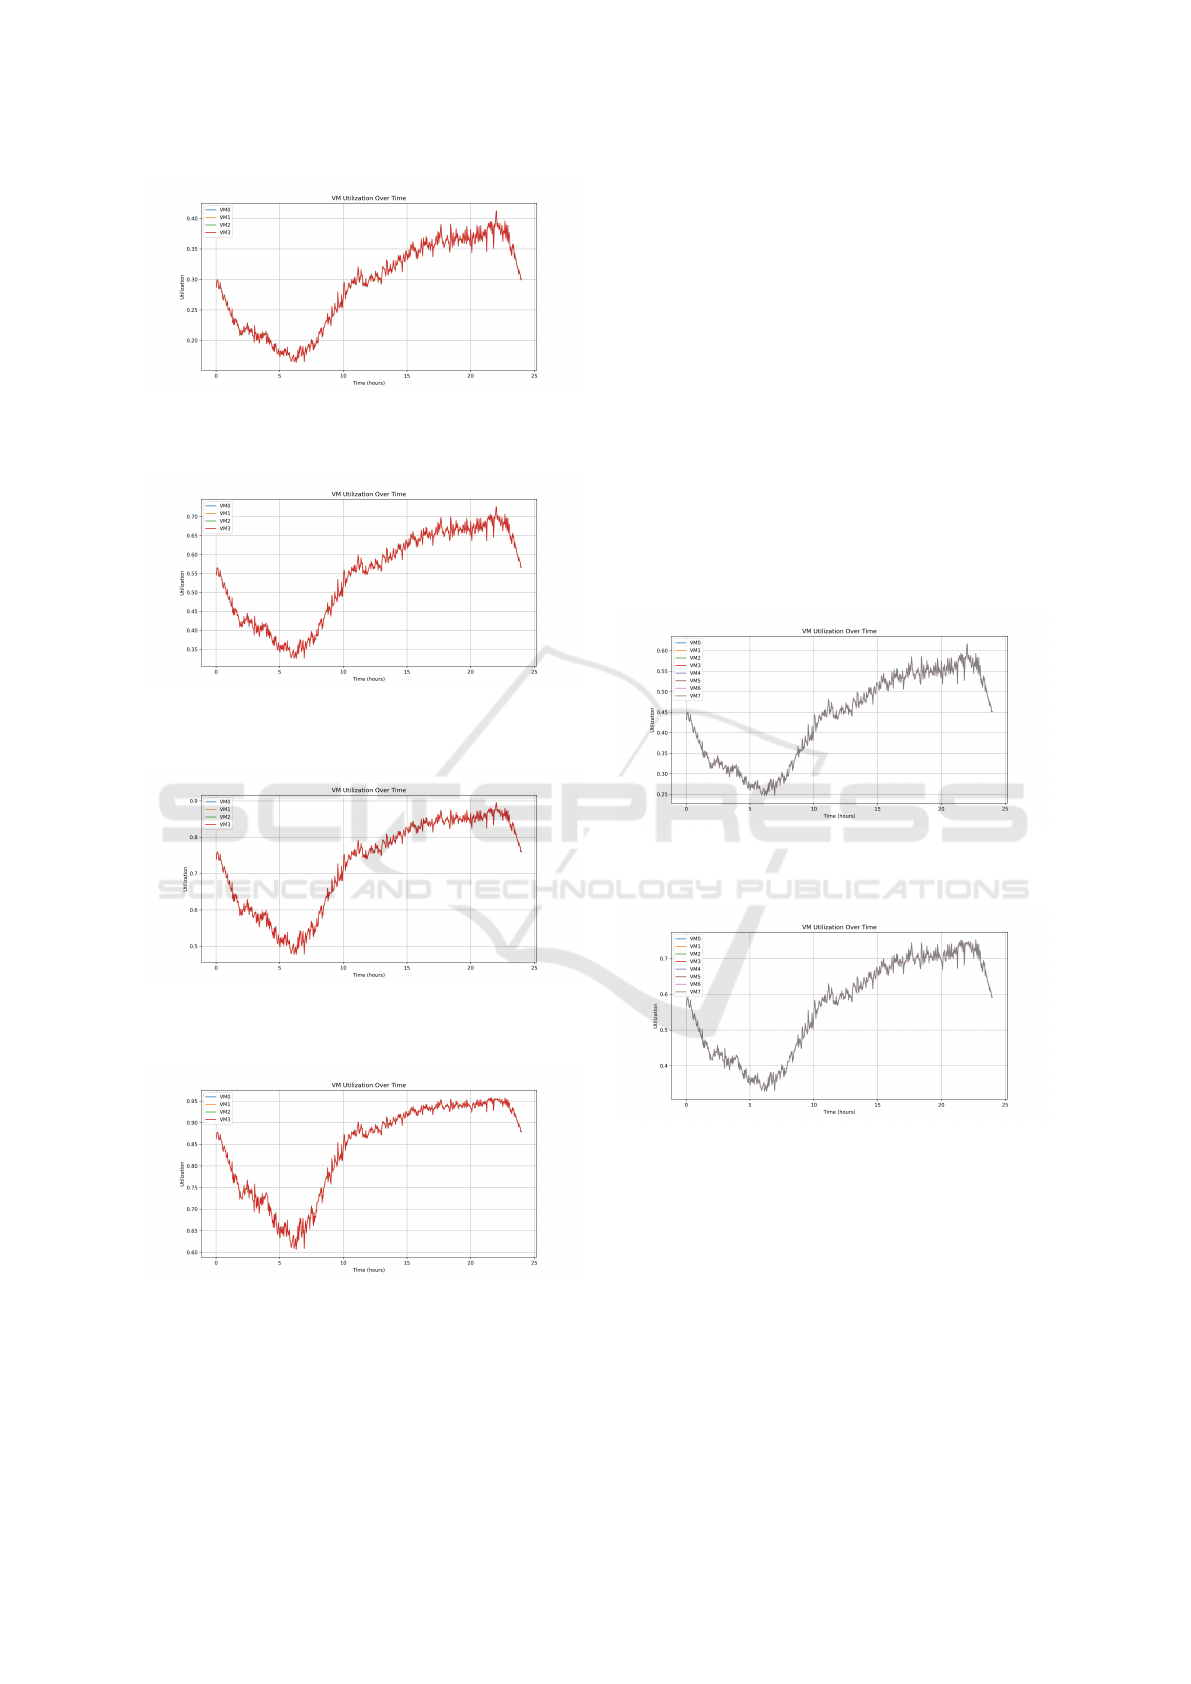
Figure 2: VM utilization over time for the 0.5x arrival rate
test case. Utilization remains low and stable, showing light
system load.
Figure 3: VM utilization over time for the 1.0x arrival rate
test case. A clear increase in usage is observed during peak
hours.
Figure 4: VM utilization over time for the 1.5x arrival rate
test case. The system operates near its capacity limit during
most of the day.
Figure 5: VM utilization over time for the 2.0x arrival rate
test case. Sustained peak usage suggests system saturation.
at 90% for 1.5x and up to 95% for 2.0x.
These results indicate that when the number of re-
quests becomes too high, the virtual machines are un-
able to manage the full load efficiently. As a conse-
quence, more requests are queued, resulting in longer
service times.
Additionally, we observe that VM utilization
grows significantly between hours 10 and 24, where
the system reaches its maximum load. Utilization in-
creases steadily during this period and then decreases
slightly as the arrival rate drops.
It is also worth noting that there are no significant
differences in behavior among the virtual machines.
Since all VMs have identical configurations and are
assigned tasks in a round-robin fashion, they handle
the workload in a similar manner.
To evaluate the impact of resource scaling, we ex-
tended the 1.5x test case by doubling the system ca-
pacity. This was done by adding a second host with
the same specifications and configuration as the first
one, resulting in a total of eight virtual machines dis-
tributed across two hosts.
Figure 6: VM utilization over time for the 1.5x arrival rate
test case. Shows the VM utilization over time after this
change.
Figure 7: VM utilization over time for the 2.0x arrival rate
test case. Shows the VM utilization over time after this
change.
Compared to the original setup with four VMs, the
utilization values are noticeably lower and more sta-
ble throughout the simulation. This indicates that the
additional resources allowed the system to distribute
the workload more evenly, reducing the load on in-
dividual VMs and preventing them from approaching
saturation.
This experiment confirms that increasing the num-
ber of VMs under high arrival rates can help maintain
system performance and avoid excessive queuing or
SIMULTECH 2025 - 15th International Conference on Simulation and Modeling Methodologies, Technologies and Applications
402

service delays.
Finally, after analyzing the results from the pre-
vious experiments, it becomes evident that increasing
the arrival rate to 3.0x or 4.0x would not contribute
additional value to this study. With four VMs, the sys-
tem already operates close to full saturation at 2.0x.
Therefore, further tests under higher load intensities
would not provide any new relevant insights for the
research objectives.
6 CONCLUSIONS AND FUTURE
WORK
Through this work, we have developed a customized
and reproducible simulation infrastructure that en-
ables performance evaluation of a selected system
model under realistic synthetic workloads, while
maintaining low memory usage. This was achieved
by partitioning workloads according to the system’s
memory constraints. In doing so, we have success-
fully replicated and adapted a solid scientific method-
ology to a simulation context, which grants unprece-
dented flexibility—eliminating the need for physical
machines and allowing the simulation of hours, days,
or even weeks of workload in a fraction of the time
required by real systems.
This approach allows for the processing of
millions of requests quickly and efficiently, en-
abling straightforward experimentation with schedul-
ing policies, scaling strategies, and system degrada-
tion scenarios. Unlike real environments, where repli-
cating infrastructure or waiting for long execution
times is often unfeasible, our simulation framework
offers a low-cost, high-speed alternative that facili-
tates advanced experimentation.
With this infrastructure in place, we investigated
system saturation points under increasing load con-
ditions. The results show that, when operating at
1.5x and 2.0x the original arrival rate, the system
reaches its operational limits, causing significant re-
quest queuing and increased service times. This raises
a key question: what would happen if the system had
twice the number of virtual machines? Would utiliza-
tion decrease, or would the system still become satu-
rated?
In real-world environments, answering such a
question would require time, money, and infrastruc-
ture changes. In our simulator, however, this can be
done in minutes—by modifying a JSON configura-
tion and launching a new test. This level of flexibility
is one of the most powerful advantages of simulation-
based research.
It is important to note that all of this has only
been possible due to the improvements applied to
CloudSim. Without these extensions, the frame-
work would be unable to manage high-volume re-
quest streams without consuming excessive memory.
Additionally, we have resolved internal errors and en-
hanced CloudSim to support dynamic workloads and
real-time data handling.
Looking forward, the platform opens the door to
future extensions such as advanced scheduling poli-
cies, dynamic VM scaling, container-based deploy-
ments, or even cost estimation models to simulate
economic impact under different load scenarios. As
such, this work serves not only as a practical founda-
tion for future simulation research, but also as a case
study demonstrating the value of using trace-driven
synthetic workloads for performance evaluation.
ACKNOWLEDGMENTS
The authors thank Luca Zanussi for his valuable tech-
nical support and for providing key tools and code
fixes used during the implementation and evaluation
phases of this work.
REFERENCES
Buyya, R., Ranjan, R., and Calheiros, R. N. (2009). Mod-
eling and simulation of scalable cloud computing en-
vironments and the cloudsim toolkit: Challenges and
opportunities. In 2009 international conference on
high performance computing & simulation, pages 1–
11. IEEE.
Heermann, D. W. and Heermann, D. W. (1990). Computer-
simulation methods. Springer.
Juiz, C. and Bermejo, B. (2024). On the scalability of
the speedup considering the overhead of consolidat-
ing virtual machines in servers for data centers. The
Journal of Supercomputing, 80(9):12463–12511.
Juiz, C., Capo, B., Bermejo, B., Fern
´
andez-Montes, A., and
Fern
´
andez-Cerero, D. (2023). A case study of transac-
tional workload running in virtual machines: The per-
formance evaluation of a flight seats availability ser-
vice. IEEE Access, 11:81600–81612.
Potier, D. (1984). New users’ introduction to QNAP 2. PhD
thesis, INRIA.
A Comparison Study of Cloud Environment Simulations
403
