
Leveraging Spatial Analysis for Sustainable Land Use Change
Management: A Case of the Mountain Elgon Region
Isdore Paterson Guma
1a
, Agnes Semwanga Rwashana
2b
, Benedict Oyo
1c
and Daniel Waiswa
3
1
Department of Computer Science, Gulu University, Gulu, Uganda
2
College of Computing and Information Science, Makerere University, Kampala, Uganda
3
College of Agricultural and Environmental Sciences, Makerere University, Kampala, Uganda
Keywords: Synergies, Land Use, Digital Elevation Model, Crammer’s Coefficient, Associations, Environmental
Sustainability.
Abstract: Anthropogenic activities such as agriculture, deforestation and expansion of infrastructure have significantly
changed land use land cover. These changes have raised environmental concerns, including soil erosion,
landslides, water-catchment degradation and loss of biodiversity, with adverse consequences for food
production and thus livelihoods. This study sought to explore how the associations between slope, elevation,
distance to roads and rivers, population growth and hillshade influence spatial and temporal variations in land
use change. The methodology involved integrating remote sensing, geographic information systems and
spatial modelling. The study found that deforestation is a persistent phenomenon, with forest cover falling
from 32.34% (2014) to 14.40% (2054). Similarly, the rangeland coverage is projected to decrease significantly
from 17.74% in 2014 to 8.91% in 2054.Urbanization, on the other hand is rapidly increasing, tripling from
18.27% in 2014 to 48.55% in 2054. It has been shown that population growth, distance from roads, elevation
and slope are strongly correlated, with the latter being very strong. Among the identified potential synergies,
built up areas are expected to almost reach 50% by 2054 at the expense of deforestation, land degradation and
water loss. Based on the identified synergies, it is recommended that a balance between economic growth and
environmental sustainability be sought to promote land use change management.
1 INTRODUCTION
Over the years, anthropogenic activities have
significantly altered land use and land cover (LULC)
(Ojelabi et al., 2025). These changes have triggered
environmental concerns, including soil erosion,
landslides, water catchment degradation, and
biodiversity loss (Aduku et al., 2024), and have had
undesirable effects on food production, thus
threatening livelihoods, especially in developing
countries (Luwa et al., 2024). These changes have
incited global debate as they directly affect
sustainable development and human well-being
(Aduku et al., 2024).
Spatial analysis, GIS, and remote sensing support
informed land use decisions by revealing connections
across sectors and balancing environmental, social,
a
https://orcid.org/0000-0002-8282-2993
b
https://orcid.org/0000-0002-4824-0260
c
https://orcid.org/0000-0003-0859-9858
and economic priorities. This approach supports the
integration of geographic data, predictive modeling,
and decision support tools, thereby advancing
planning, policymaking, and sustainability efforts
(Bielecka, 2020).
Additionally, spatial analysis provides
geographic specificity, enhancing the realism of
models by incorporating factors such as topography,
climate, and infrastructure (Oztuna, 2023).
Consequently, extensive research has been
undertaken at various spatial and temporal scales for
diverse purposes highlighting the essential role of
spatial analysis in land use change management.
Between 1987 and 2015 in Côte d’Ivoire, 1.44%
of forestland and 3.44% of dense forest were
converted to agricultural and degraded forest areas,
respectively (Kouassi et al., 2021). In Ethiopia,
cultivated and settlement areas increased by 6.4% and
382
Guma, I. P., Rwashana, A. S., Oyo, B., Waiswa and D.
Leveraging Spatial Analysis for Sustainable Land Use Change Management: A Case of the Mountain Elgon Region.
DOI: 10.5220/0013644800003970
In Proceedings of the 15th International Conference on Simulation and Modeling Methodologies, Technologies and Applications (SIMULTECH 2025), pages 382-389
ISBN: 978-989-758-759-7; ISSN: 2184-2841
Copyright © 2025 by Paper published under CC license (CC BY-NC-ND 4.0)
6.5%, while grassland and forest cover are projected
to decline by 22.3% and 63.8% by 2050 (Mathewos
et al., 2022). Similarly, urban areas in Southwestern
Nigeria expanded from 341.7 km² to 520.6 km²
between 1984 and 2019 (Fashe et al., 2020). These
rapid LULC changes pose major challenges to
sustainable development, affecting forest cover,
increasing flood risks, complicating urban planning,
and straining agriculture and water resources
(Akinyemi, 2021).
In Uganda's Mt. Elgon region, various studies
have addressed LULC dynamics. Luwa et al. (2020)
used intensity analysis to assess change patterns;
Opedes et al. (2022) examined land cover change and
subsistence farming; and Bamutaze et al. (2021)
evaluated erosion risk via Global Positioning System
data. However, these studies explicitly underscored
the associations between population growth,
proximity to rivers, proximity to roads, slope, digital
elevation model (DEM), hill shade, and aspect. This
study explored how the associations between these
factors influence spatial and temporal variations in
land use change.
2 MATERIALS AND METHODS
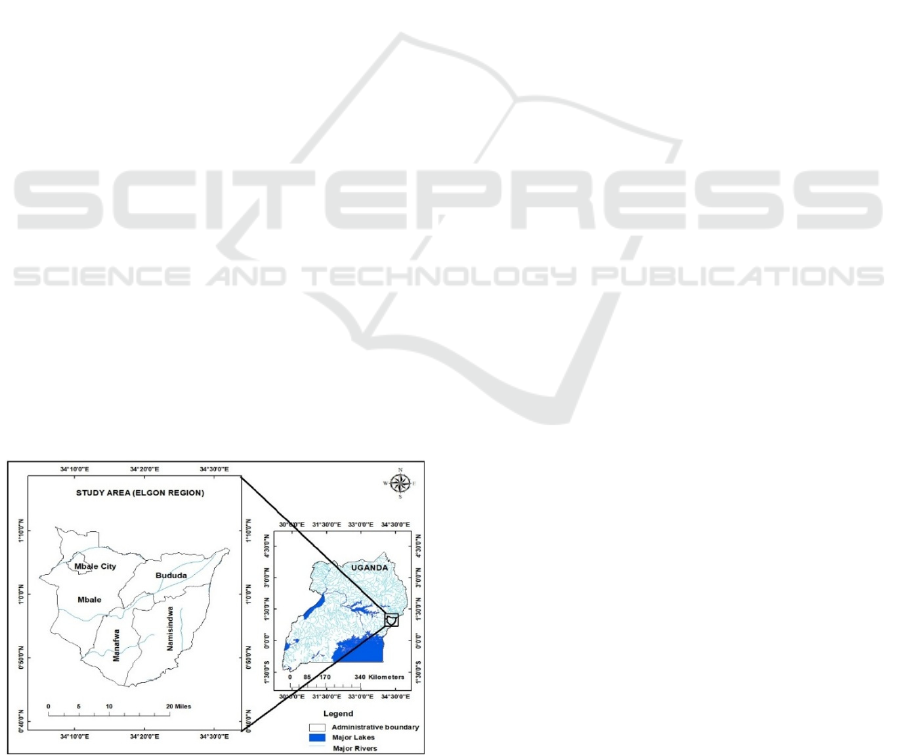
2.1 Study Area
The study was conducted in Mbale, Bududa,
Manafwa and Namisindwa (Figure 1). The study area
is positioned between 0°40'0"N and 1°10'0"N latitude
and 34°10'0"E and 34°30'0"E longitude. The region
encompasses a total area of 320 km² with a population
of approximately 1,338,178 people. The topography,
climatic conditions and socio-economic activities
provide a complex context for analysing LULC
changes, making ideal setting for this research.
Figure 1: The Study Area.
The methodological approach integrates remote
sensing with geographic information systems (GIS)
to assess LULC dynamics in the region.
2.2 Data Collection
2.2.1 Satellite Imagery
Multi-temporal satellite images from Landsat 8, with
a spatial resolution of 30 m, were acquired from the
United States Geological Survey (USGS) Earth
Explorer (https://earthexplorer.usgs.gov/) for the
years 2014, 2019 and 2024. The imagery was chosen
based on phenological considerations, seasonality
and minimal cloud cover to ensure precise analysis.
2.2.2 Cramer's V Analysis of Driver
Variables
To evaluate the strength of association between
selected drivers and LULC changes, Cramer's V
values were computed using the R-Processing plugin
in QGIS. Cramer's V, ranging from 0 (no association)
to 1 (strong association), quantifies relationships
between categorical variables. This analysis revealed
how spatial factors such as population growth,
proximity to rivers and roads, slope, elevation
(DEM), and hillshade contribute to LULC dynamics.
The results highlighted which variables most strongly
influenced land use changes in the Mount Elgon
region.
2.2.3 Ancillary Data
Roads and rivers were derived from OpenStreetMap
(http://www.openstreetmap.org/), providing essential
infrastructure data. Population growth data were
sourced from WorldPop (http://www.worldpop.org),
offering insights into demographic pressures.
2.3 Data Pre-processing
2.3.1 Geometric Correction
Geometric correction was conducted on all satellite
images to ensure spatial alignment using reference
layers such as DEM, slope, and distance from roads.
The correction process utilized the MOLUSCE
plugin in QGIS to preserve data consistency across
temporal layers.
2.3.2 Image Classification
A supervised classification technique, specifically the
maximum likelihood algorithm within ArcGIS, was
Leveraging Spatial Analysis for Sustainable Land Use Change Management: A Case of the Mountain Elgon Region
383

employed to categorize LULC types. Training
samples were selected based on expert knowledge
and field validation, ensuring the accuracy of the
classification process. To assess the reliability of the
classified maps, their accuracy was evaluated using a
confusion matrix and kappa coefficient, comparing
the classified outputs with ground-truth data. This
approach ensured a robust validation of the
classification results.
2.4 Analysis of Spatial and Temporal
Variations
2.4.1 Land Use Change Detection
The LULC maps for 2014, 2019, and 2024 were
analyzed to detect spatial and temporal changes. The
MOLUSCE plugin in QGIS was used for change
detection, specifically employing post-classification
comparison to identify transitions among different
LULC categories over time. This method was chosen
because it allowed for accurate identification of land
use changes by comparing classified maps from
different years, making it ideal for assessing spatial
dynamics and temporal trends in LULC.
2.4.2 Spatial Variable Analysis
This study examined how factors such as DEM,
slope, proximity to rivers and roads, and population
influenced land use change in the Mount Elgon
region. DEM and slope determine land suitability by
identifying areas vulnerable to erosion and landslides,
thereby guiding human activities. Proximity to rivers
impacts agriculture and settlement patterns due to
water availability and flood risk, while proximity to
roads drives urban expansion, agricultural
development, and resource extraction. Population
growth increases the demand for farmland and
settlements. Together, these factors shape the spatial
and temporal dynamics of land use change in the
region. Spatial analysis tools in ArcGIS were
employed to calculate proximity metrics and generate
thematic layers.
2.5 Future Land Use Land Cover
Prediction
The MOLUSCE module in QGIS was used to predict
future LULC changes using a Cellular Automata and
Neural Network (CA-ANN) model. This approach
utilizes historical LULC maps for 2014, 2019 and
2024 as input layers, integrating spatial variables to
simulate future scenarios. The projected maps offer
insights into potential LULC dynamics based on
observed trends.
Table 1: Area statistics of LULC classes for the years 2014, 2019 and 2024 and percentages of change.
LULC
Classes
2014 2019 2024
Chan
g
e in
2014-2019
Chan
g
e in
2019-2024
Chan
g
e in
2014-2024
sq.k
m
% sq.k
m
% sq.k
m
% Δ % Δ % Δ %
Wate
r
0.04 0.00 0.33 0.02 0.08 0.01 0.02 -0.018 0.00
Trees 443.56 32.34 410.69 29.95 316.71 23.09 -2.40 -6.852 -9.25
Crop lan
d
433.95 31.64 506.14 36.91 434.02 31.65 5.26 -5.259 0.00
Built areas 250.54 18.27 276.73 20.18 418.23 30.50 1.91 10.318 12.23
Rangelan
d
243.31 17.74 177.52 12.94 202.36 14.76 -4.80 1.812 -2.99
Table 2: Classification Accuracy Assessment of each Land use Maps.
LULC Classes 2014 2019 2024
Producer's
Accurac
y
User's
Accurac
y
Producer's
Accurac
y
User's
Accurac
y
Producer's
Accurac
y
User's
Accurac
y
Trees 0.97 1.00 0.97 1.00 0.96 0.77
Crop land 1.00 1.00 1.00 0.93 0.57 0.93
Built areas 0.96 1.00 0.92 1.00 0.79 0.54
Rangeland 1.00 0.86 1.00 1.00 0.90 0.69
Overall accuracy (%) 97.00
80.00
98.00
Kappa coefficient 0.97
0.96
0.64
SIMULTECH 2025 - 15th International Conference on Simulation and Modeling Methodologies, Technologies and Applications
384

3 RESULTS
3.1 Land Use Land Cover
Classification
The LULC area statistics are shown in Table 1. The
total surface area of the analysed area is 1,371.4028
km
2
. The distribution of the Elgon LULC classes
shows that in the year 2014, 32.34% of the area was
forested, 31.64% cropland, 18.27% built-up, 17.74%
rangeland and 0% water body. Whereas the year 2019
analysis shows that 36.91% of the Elgon region is
agricultural land (cropland), 29.95% forest, 20.18%
built-up, 12.94% pasture and 0.02% water body. In
the year 2024, the agricultural, built-up, forest,
rangeland and water bodies were 31.65, 30.50, 23.09,
14.76 and 0.01 percent respectively.
3.2 Classification Accuracy Assessment
The classification accuracy assessment (Table 2) for
the LULC maps of 2014, 2019, and 2024 reveals a
clear decline in both overall accuracy and class-
specific reliability in 2024. While the Producer’s and
User’s Accuracies for most land cover classes
remained high in 2014 and 2019 with Overall
Accuracy values of 97% and 98%, and Kappa
Coefficients of 0.97 and 0.96, respectively, a
substantial drop was observed in 2024. The Overall
Accuracy fell to 80%, and the Kappa Coefficient
dropped markedly to 0.64, indicating a notable
decrease in agreement between the classified and
reference data.
Class-specific performance in 2024 illustrates the
nature of this decline. Built-up areas showed a
pronounced reduction in both Producer’s Accuracy
(0.79) and User’s Accuracy (0.54), implying
increased confusion with other classes and potential
overestimation of urban expansion. Cropland also
exhibited a major drop in Producer’s Accuracy from
1.00 (in 2014 and 2019) to 0.57 in 2024, indicating
significant misclassification, even though its User’s
Accuracy remained stable at 0.93. Trees and
rangeland, while more stable, also showed decreased
User’s Accuracy, suggesting reduced reliability in
mapping these categories.
The reduced classification quality in 2024 may
have compromised the accurate detection of land
cover changes between 2019 and 2024.
Misclassification of built-up or cropland areas could
have resulted in either exaggerated or underestimated
land transitions during this period.
Table 3: Change of area between LULC classes for the years 2014-2019, 2019-2024 and 2014-2024.
Changes between LULC classes 2014-2019 (sq.km) 2019-2024 (sq.km) 2014-2024 (sq.km)
Water to Water 1.00 0.22 0.86
Water to Trees 0.00 0.08 0.01
Water to Croplan
d
0.00 0.60 0.07
Water to Built-up areas 0.00 0.09 0.02
Water to Rangeland 0.00 0.02 0.04
Trees to Water 0.00 0.00 0.00
Trees to Trees 0.82 0.71 0.67
Trees to Cropland 0.05 0.05 0.07
Trees to Built-up areas 0.05 0.14 0.14
Trees to Rangeland 0.09 0.10 0.11
Cropland to Water 0.00 0.00 0.00
Cropland to Trees 0.03 0.01 0.02
Cropland to Cropland 0.86 0.75 0.74
Cropland to Built-up areas 0.06 0.16 0.19
Cropland to Rangeland 0.04 0.08 0.05
Built areas to Wate
r
0.00 0.00 0.00
Built areas to Trees 0.05 0.00 0.00
Built areas to Cropland 0.08 0.03 0.05
Built areas to Built-up areas 0.86 0.96 0.94
Built areas to Rangeland 0.01 0.01 0.01
Rangeland to Wate
r
0.00 0.00 0.00
Rangeland to Trees 0.09 0.10 0.04
Rangeland to Cropland 0.37 0.14 0.28
Rangeland to Built-up areas 0.06 0.10 0.15
Rangeland to Rangeland 0.48 0.66 0.5
Leveraging Spatial Analysis for Sustainable Land Use Change Management: A Case of the Mountain Elgon Region
385
Moreover, since future LULC projections up to
2054 are based on trends derived from historical and
current maps, the 2024 dataset serves as a critical
input. Lower classification confidence in this dataset
may propagate uncertainty into the projection model,
potentially distorting forecasts of land cover change
particularly for rapidly evolving classes like urban or
agricultural land.
3.3 Change of Area Between Land Use
Land Cover Classes
When the change values are examined (Table 3);
shrinkage was detected in water, trees, cropland, and
rangeland by 0.02%, 9.25%, 5.26%, and 2.99
respectively with greater shrinkage in the trees
(forested area) by 9.25% in the year 2014-2024,
whereas expansion was observed in built-up areas
throughout the years with greater expansion values by
12.23%, for the period 2014-2024.
The change analysis of the LULC classes showed
that the expansion in the built-up areas had arisen
from water bodies, Trees, Cropland and rangeland
where 0.09, 0.14,0.19, and 0.15 Km
2
of respective
LULC classes were transformed into built-up areas
from the year 2014 to the year 2024. Over a 30-year
period (2024-2054), the built-up area is projected to
increase from 30.5 to 48.6 and the trees, croplands
and rangelands to decrease from 23.1 to 14.4, 31.7 to
28.1 and 14.8 to 8.9 percent respectively, with
minimal changes in water bodies.
3.4 Projected LULC Area Statistics for
2054 Relative to the Baseline (2014)
Figures 2 and 3 illustrate LULC changes between
2014 and 2024, along with projections for 2054.
These figures highlight trends across various land
cover categories, revealing a steady transformation of
natural landscapes into urban and built-up areas.
A key trend is deforestation, with forest cover
decreasing sharply from 32.34% in 2014 to a
projected 14.40% by 2054. This persistent loss is
driven by urban expansion, agricultural
encroachment, illegal logging, and land degradation.
Urbanisation is another prominent trend, with
built-up areas projected to nearly triple from 18.27%
in 2014 to 48.55% by 2054. This surge is likely fueled
by population growth, increased housing demand,
infrastructure development, and rural-to-urban
migration affecting green spaces and croplands,
greater pollution, urban heat island effects, and
heightened pressure on water and waste management
systems.
Cropland initially increased between 2014 and
2019 due to agricultural expansion but is expected to
decline from 2024 onward due to urban
encroachment, soil degradation, and the impacts of
climate change on agricultural productivity. The
shrinking cropland base poses risks to food security
and signals a shift in economic focus from agriculture
toward industry and services.
Rangelands have also seen a significant decline
from 17.74% in 2014 to a projected 8.91% in 2054.
Contributing factors may include overgrazing, land
degradation, urban encroachment, and climate
change affecting pasture availability. This threatens
livestock farming and may exacerbate soil
degradation if unsustainable grazing continues.
Figure 2: Visualizing Land Use Land Cover changes from
2014 to 2054.
Figure 3: Spatial distribution of the LULC for the years
2014, 2019, 2024 and Prediction for 2054.
3.5 Association Between Driving
Forces of Land Use Land Cover
Change
Table 4 presents the explanatory power of each driver
variable influencing LULC changes, measured using
SIMULTECH 2025 - 15th International Conference on Simulation and Modeling Methodologies, Technologies and Applications
386
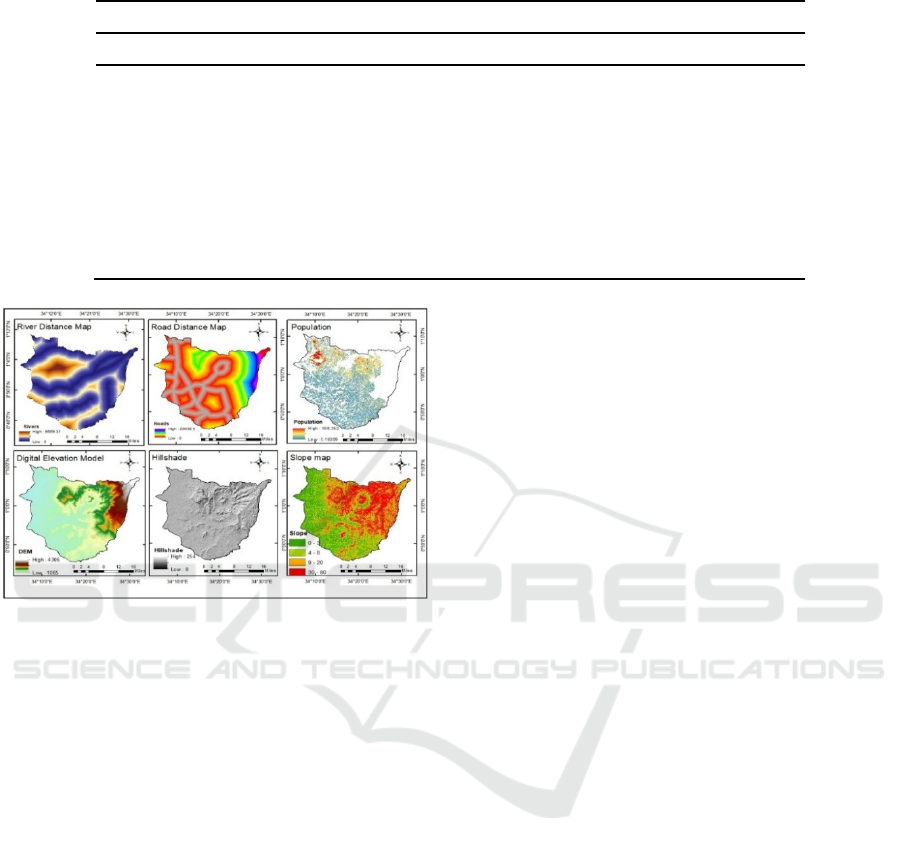
Table 4: Cramer's V Values of Driver Variables.
Cramer's Coefficient
Variable Cramer's V Value Interpretation
Population Growth 0.5316 Strong association
Distance from Rivers 0.3801 Moderate association
Distance from Roads 0.5337 Strong association
Slope 0.7205 Very strong association
DEM (Digital Elevation Model) 0.5236 Strong association
Hillshade 0.2973 Weak association
Aspect 0.4171 Moderate association
Figure 4: Distribution of driver variables.
the Cramer's V coefficient. All variables
demonstrated significant associations, with Cramer's
V values exceeding 0.15. Among them, distance from
rivers (0.3801) and aspect (0.4171) exhibited
moderate explanatory power. Hillshade showed a
weaker association (0.2973), while population
growth, distance to roads, elevation (DEM), and slope
demonstrated strong correlations, slope showed a
very strong relationship. Following the identification
of these key drivers, the specified land cover
transitions were modeled within a unified transition
sub-model. This process produced transition potential
maps, which demonstrated accuracy levels ranging
between 40% and 95%.
4 DISCUSSION OF RESULTS
Land use and land cover change at global level is a
problem for the environment and for development
because of its complex nature and local occurrence.
For the coming decades, the world population is
expected to continue growing, causing major
problems (Unger & Lakes, 2023). Land demand is
reflected in different land-use interests, which can
lead to land-use synergies that are manifested locally.
Satellite data allow continuous monitoring of land
use change at various scales. It should also be noted
that understanding the interrelationships between the
various land use factors and their effects is conducive
to optimising land use patterns and promoting land
use sustainability. However, spatial differences and
the drivers of synergies between the various land use
factors in the region have not been well studied.
4.1 Historical Land Use Land Cover
Change Dynamics Analysis
Historical changes in the LULC (Table 1) shows that
agricultural land and rangelands have been reduced
between 2014 and 2024. Trees have declined over the
years, while built-up areas have increased steadily.
Agricultural expansion (Alshari & Gawali, 2022) and
urbanisation (Gündüz, 2025) has caused more than
28.6% of forest cover to be lost in the last 10 years.
Similarly, studies in the region have reported that the
conversion of forests and the reduction of rangelands
are indicators of an increase in anthropogenic activity
and food demand (Ojelabi et al., 2025). Historical
findings on LULC dynamics align with studies
showing that agricultural and urban expansion are
driving the loss of natural vegetation (Alshari &
Gawali, 2022).
4.2 Spatial and Temporal Land Use
Change Trends
The analysis of Cramer's V values provided insights
into the key drivers influencing LULC changes in the
Mount Elgon region. These results are consistent with
a study conducted in Sana’a City in Yemen (Ouma et
al., 2024). Slope exhibited the strongest association
(0.7205) (Xu et al., 2021).
Leveraging Spatial Analysis for Sustainable Land Use Change Management: A Case of the Mountain Elgon Region
387

Distance from roads (0.5337) and population growth
(0.5316) also had strong associations, defining
infrastructure development and urban expansion
(Rahnama, 2021). DEM (0.5236) and distance from
rivers (0.3801) influenced land use patterns (Abbas et
al., 2021; Gharaibeh et al., 2020), while hillshade
(0.2973) showed the weakest association (Ouma et
al., 2024). These findings are consistent with the
findings of Abijith et al. (2025) where DEM, slope
and distance from roads including population growth
contribute to the change in land use.
5 CONCLUSION AND FUTURE
WORK
The study modeled LULC changes by analyzing key
environmental and human-driven factors such as
elevation, slope, distance from roads and rivers, and
population growth. Accurate LULC modeling
requires careful selection of relevant predictors and
the use of spatiotemporal data to capture complex
dynamics. Among the variables analyzed, slope
showed the strongest influence, followed by distance
to roads, elevation, and population growth. Distance
to rivers and aspect had moderate associations, while
hillshade had the weakest. Despite these insights, the
study acknowledges limitations in simulating human
behaviour and policy influences. To enhance
predictive accuracy, future research should
incorporate integrated models, scenario-based
simulations, and advanced techniques like machine
learning or Artificial Intelligence. Incorporating
socio-economic drivers is also essential, as human
activity significantly shapes LULC patterns.
DECLARATION OF COMPETING
INTEREST
The authors declare that there were no known
conflicting interests that could have influenced the
work reported in this paper.
FUNDING
This research received financial support from
Building Stronger Universities (BSU IV) project,
Gulu University and Makerere University Research
and Innovation Fund.
REFERENCES
Abbas, Z., Yang, G., Zhong, Y., & Zhao, Y. (2021).
Spatiotemporal change analysis and future scenario of
lulc using the CA-ANN approach: A case study of the
greater bay area, China. Land, 10(6). https://doi.org/10
.3390/land10060584
Abijith, D., Saravanan, S., Parthasarathy, K. S. S., Reddy,
N. M., Niraimathi, J., Bindajam, A. A., Mallick, J.,
Alharbi, M. M., & Abdo, H. G. (2025). Assessing the
impact of climate and land use change on flood
vulnerability : a machine learning approach in coastal
region of Tamil. Geoscience Letters, 1–26. https://
doi.org/10.1186/s40562-025-00377-7
Aduku, J. G., Ogah, A. T., & Marcus, N. D. (2024).
Assessing the effects of changing land use and land
cover on the flood events in ibaji local government
area, kogi state, nigeria. 10(1), 237–247.
Akinyemi, F. O. (2021). Vegetation trends, drought severity
and land use‐land cover change during the growing
season in semi‐arid contexts. Remote Sensing, 13(5), 1–
20. https://doi.org/10.3390/rs13050836
Alshari, E. A., & Gawali, B. W. (2022). Modeling Land Use
Change in Sana’a City of Yemen with MOLUSCE.
Journal of Sensors, 2022. https://doi.org/10.1155
/2022/7419031
Bamutaze, Y., Mukwaya, P., Oyama, S., Nadhomi, D., &
Nsemire, P. (2021). Intersecting RUSLE modelled and
farmers perceived soil erosion risk in the conservation
domain on mountain Elgon in Uganda. Applied
Geography, 126(October 2020), 102366. https://doi.
org/10.1016/j.apgeog.2020.102366
Bielecka, E. (2020). Gis spatial analysis modeling for land
use change. A bibliometric analysis of the intellectual
base and trends. Geosciences (Switzerland), 10(11), 1–
21. https://doi.org/10.3390/geosciences10110421
Fashe, O. A., Adagbasa, E. G., Olusola, A. O., & Obateru,
R. O. (2020). Land use land cover change and land
surface emissivity in Ibadan, Nigeria. Town and
Regional Planning, 77, 71–88. https://doi.org/
10.18820/2415-0495/trp77i1.6
Gharaibeh, A., Shaamala, A., Obeidat, R., & Al-Kofahi, S.
(2020). Improving land-use change modeling by
integrating ANN with Cellular Automata-Markov
Chain model. Heliyon, 6(9), e05092. https://doi.org/
10.1016/j.heliyon.2020.e05092
Gündüz, H. İ. (2025). Land-Use Land-Cover Dynamics and
Future Projections Using GEE, ML, and QGIS-
MOLUSCE: A Case Study in Manisa. Sustainability
(Switzerland), 17(4). https://doi.org/10.3390/su1
7041363
Kouassi, J. L., Gyau, A., Diby, L., Bene, Y., & Kouamé, C.
(2021). Assessing land use and land cover change and
farmers’ perceptions of deforestation and land
degradation in south-west Côte d’Ivoire,West Africa.
Land, 10(4). https://doi.org/10.3390/land10040429
Luwa, K. J., Bamutaze, Y., Majaliwa Mwanjalolo, J. G.,
Waiswa, D., Pilesjö, P., & Mukengere, E. B. (2020).
Impacts of land use and land cover change in response
to different driving forces in Uganda: evidence from a
SIMULTECH 2025 - 15th International Conference on Simulation and Modeling Methodologies, Technologies and Applications
388

review. African Geographical Review, 00(00), 1–17.
https://doi.org/10.1080/19376812.2020.1832547
Luwa, K. J., Majaliwa, J. G. M., Bamutaze, Y., Wasswa,
D., Pilesjö, P., & Espoir, B. (2024). Intensity analysis
applied to land use and land cover change and
transitions in a fragile tropical mountain environment:
a case of sironko catchment on Mt. Elgon, Eastern
Uganda. African Geographical Review, 00(00), 1–21.
https://doi.org/10.1080/19376812.2024.2331493
Mathewos, M., Lencha, S. M., & Tsegaye, M. (2022). Land
Use and Land Cover Change Assessment and Future
Predictions in the Matenchose Watershed, Rift Valley
Basin, Using CA-Markov Simulation. Land, 11(10).
ttps://doi.org/10.3390/land11101632
Ojelabi, K. O., Lawin, Emmanuel, A., Amichiatchi, J. N.,
& Oluwasemire, K. O. (2025). Impacts of
anthropogenic activities on land use land cover change
dynamics in the Ogun. 1–15. https://doi.org/10.216
6/wcc.2025.586
Opedes, H., Mücher, S., Baartman, J. E. M., Nedala, S., &
Mugagga, F. (2022). Land Cover Change Detection and
Subsistence Farming Dynamics in the Fringes of Mount
Elgon National Park, Uganda from 1978–2020. Remote
Sensing, 14(10). https://doi.org/10.3390/rs14102423
Ouma, Y. O., Nkwae, B., Odirile, P., Moalafhi, D. B.,
Anderson, G., Parida, B., & Qi, J. (2024). Land-Use
Change Prediction in Dam Catchment Using Logistic
Regression-CA, ANN-CA and Random Forest
Regression and Implications for Sustainable Land–
Water Nexus. Sustainability (Switzerland), 16(4).
https://doi.org/10.3390/su16041699
Oztuna, A. (2023). Environmental Analysis Using
Integrated GIS and Spatial Configurations in Israel.
Journal of Geographic Information System, 15(02),
267–293. https://doi.org/10.4236/jgis.2023.152014
Rahnama, M. R. (2021). Forecasting land-use changes in
Mashhad Metropolitan area using Cellular Automata
and Markov chain model for 2016-2030. Sustainable
Cities and Society, 64, 102548.
https://doi.org/10.1016/j.scs.2020.102548
Xu, Q., Wang, Q., Liu, J., & Liang, H. (2021). Simulation
of land-use changes using the partitioned ann-ca model
and considering the influence of land-use change
frequency. ISPRS International Journal of Geo-
Information, 10(5).
Leveraging Spatial Analysis for Sustainable Land Use Change Management: A Case of the Mountain Elgon Region
389
