
Data-Driven Visitor Tracking Analytical Insights and
Recommendation System
Rutuja Khedkar, Prema Sahane, Anushka Patil, Abhijit Jawkar and Sharvayu Dhemse
Dept. of Computer Engineering JSPM’s Rajarshi Shahu College of Engineering Pune, India
Keywords: Visitor Tracking, Analytical System, Recommendation System, User Experience.
Abstract: Novel Way of Visualizing Visitor Behavior: From behavior on a website to behavior in a buildingAbstract—
In the digital age, it is crucial to understand visitor behavior in websites and physical locations to improve
user experience and optimize business strategy. We present a Visitor Tracking, Analytical, and
Recommendation System (VTARS) able to log, process and produce insights about visitor interactions.
VTARS uses cutting-edge tracking technologies to record the movements, preferences, and activities of
individual visitors across multiple touchpoints. It aggregates data from different sources, such as web
analytics, location-based services, IoT devices to create holistic visitor profiles. VTARS captures visitor
insights using machine learning algorithms and statistics, tracking visitor interaction data like browsing,
purchases, and engagement frequency. This information is then synthesized, resulting in an interactive report
and visualizations to give stakeholders a better idea of who their visitors are and what things interest them. It
functions by anticipating the specific needs that users may have during their engagement and suggesting
relevant content, products, or services that users may be interested in based on their previous interactions and
behaviors, with the purpose of improving user satisfaction and conversion rates. Iterative learning improves
recommendations over time, as they adapt to changing patterns in visitor behavior and preferences.
1 INTRODUCTION
In this digital age, many organizations try to
understand what their visitors do to improve users
experience and make strategic decisions. To meet
these goals, proper visitor tracking and analysis have
become essential elements. The Visitor Tracking,
Analytical and Recommendation System (VTARS) is
developed as a powerful platform for observing
visitors online and physical places and analyzing
their behaviours.
VTARS employs sophisticated tracking
techniques to monitor individual user behavior and
activity. The system creates detailed visitor profiles
by combining data from a variety of sources,
including web analytics, location-based services, and
Internet of Things (IoT) sensors. This information is
condensed in profiles, which provide a
comprehensive picture of user habits, such as what
kind of online content they are consuming, how much
they are buying, and how often they engage with
platforms.
Using extensive machine learning algorithms and
statistical methods, VTARS identifies trends and
patterns in visitor behavior. Through the system's in-
built analytics feature, stakeholders have access to
on-demand reports and visualizations to gain insights
into visitor demographics, interests and engagement
levels. Such data-drivenness allows businesses to
make sound decisions that lead to an elevated user
experience and increased productivity.
VTARS is designed with a recommendation
engine that analyzes user behavior and preferences to
suggest content collaboratively and based on content
features. VTARS seeks to enhance user satisfaction
and drive conversion rates by providing personalized
recommendations for content, products, or services
tailored to users' unique preferences and previous
interactions. This information, along with real-time
updates, helps the system to learn over time, making
it an integral part of the visitor planning experience.
Finally, VTARS is a complete package for any
business looking to capitalize on their visitors and
make properly justified decisions. VTARS also
improves operational efficiency and encourages
Khedkar, R., Sahane, P., Patil, A., Jawkar, A. and Dhemse, S.
Data-Driven Visitor Tracking Analytical Insights and Recommendation System.
DOI: 10.5220/0013640700004664
Paper published under CC license (CC BY-NC-ND 4.0)
In Proceedings of the 3rd International Conference on Futuristic Technology (INCOFT 2025) - Volume 3, pages 705-711
ISBN: 978-989-758-763-4
Proceedings Copyright © 2025 by SCITEPRESS – Science and Technology Publications, Lda.
705

better customer engagement and loyalty in an
increasingly competitive setting.
2 LITERATURE SURVEY
They have come up with a low-cost indoor
navigation and tracking system based on Wi-Fi RSSI
(Received Signal Strength Indicator) values.
HandyMap used a Fingerprint map and a k-Nearest
Neighbor (k-NN) algorithm for user location
estimation and Dijkstra's algorithm for finding the
shortest path. It is based on an Android mobile device,
integrated with a server on a Raspberry Pi 4B for data
processing and realtime tracking via a webapp. A
maximum accuracy of 78% was reached with an
average distance error of 0.86 meters and a maximum
distance error of less than 3 meters. They also achieve
optimal performance equipped with 8 routers and a
sampling time of 3 seconds result in user navigation
and tracking of individuals' movements inside a
building by the system. (Ryan, et al. , 2020), (Russo,
et al. , 2010)
The gang made a bi-directional individual counter
the usage of an Arduino Uno microcontroller and IR
sensors. The primary sensors used were infrared (IR)
sensors what saved the results; the Arduino Uno as a
signal controller and a visitor display on an LCD. All
of the system software was designed on the Arduino
IDE and validate through Proteus simulation. For
hardware, sensors were interfaced with Arduino, the
custom PCB for placement and assembly and
enclosure for handling. The result was a dependable
visitor counter that showed up-to-the-minute
information on how many people were coming in and
out of a designated space. This system proved to be
strong and affordable, making it useful for managing
crowds and monitoring traffic.
http://dx.doi.org/10.2139/ssrn.4443869 (Erlina, and,
Fikri, 2023), (Singh, et al. , 2023)
This study looked into how visitors move around
the Fort Larned National Historic Site by using GPS
Visitor Tracking (GVT). Visitors were given GPS
devices, allowing researchers to track where and
when people traveled around the site. They created
maps that show where visitors went most often. The
results showed that many people tended to move in a
clockwise direction, starting at a key attraction and
heading towards the visitor center. The maps also
highlighted areas that didn’t see as many visitors,
giving site managers ideas on how to adjust their
outreach and spread out the flow of guests. This study
indicates that GVT can help improve the visitor
experience by pinpointing busy spots and finding
ways to draw attention to the quieter areas. Overall,
this method can enhance how heritage sites engage
with people and tell their stories better. (Wu, et al. ,
2021), (Choi, et al. , 2013)
This project outlined in the document combined
the YOLO algorithm, Raspberry Pi, and other
hardware like webcams and speakers to set up a
system that detects visitors in small retail stores. The
YOLOv4-tiny model was trained to spot people and
reached an impressive mAP of 89.21%. It can tell the
difference between customers and possible
shoplifters by analyzing their movements, alerting the
store owner via Telegram. This system not only
enhanced store security but also increased customer
interaction, all while being affordable and simple to
implement, making it perfect for small businesses.
(Khedkar and Tandle, 2019), (Korade, et al. , 2024)
In another part of the research, advanced tracking
methods were used, mainly relying on GPS to collect
data about how visitors moved throughout a theme
park. This approach helped in examining how people
behave and move in a controlled setting. Although the
initial tracking was limited, it revealed the importance
of gathering data for managing attractions effectively.
The outcomes pointed out the need to tackle various
challenges in future studies, especially in less
controlled spaces like semi-open and outdoor tourist
sites. The research also highlighted the possibility of
integrating mobile tracking technologies alongside
GPS to deepen the understanding of visitor behavior
in broader contexts. Furthermore, privacy concerns
and the logistics of managing devices in open areas
were identified as challenges. In the end, the study
showed that advanced visitor tracking could greatly
improve how attractions and destinations perform,
opening up possibilities for future research that might
expand beyond theme parks to various tourist spots
and urban locations. (Ayed, et al. , 2019), (Korade, et
al. , 2024)
The researchers used a range of wireless
communication techniques for location tracking,
particularly focusing on ZigBee technology. Their
main strategies included Time of Arrival, Received
Signal Strength, Angle of Arrival, Time Difference of
Arrival, and Time of Flight to figure out where
visitors were located. The setup was designed to track
visitors by giving each a unique transmitter node that
wirelessly communicated with reference nodes
placed at intervals along their route. As visitors got
closer to these reference nodes, the system updated
their location and estimated arrival time based on the
signal strength from the nodes. A tree routing method,
based on the ZigBee standard, ensured smooth data
transfer from sensor nodes to a central hub,
INCOFT 2025 - International Conference on Futuristic Technology
706

maintaining their relationships during tracking. As a
result, the project boasted improved accuracy in
pinpointing visitors' locations, checking their paths,
and providing estimated arrival times, all of which
enhanced the visitor experience in places like
university campuses and factories. (Ching, 2019),
(Joshi, 2023)
The researchers adopted various techniques to
meet their goals. They conducted thorough data
analysis to reveal patterns and trends that guided their
decisions. A key focus was on developing predictive
models, allowing them to forecast outcomes based on
past data. They also used simulation methods to
explore different scenarios and evaluate how various
factors affected outcomes. Optimization techniques
helped refine model performance for better resource
use. They put robust validation processes in place to
ensure the results were accurate and dependable. The
project's outcomes were impressive; it improved
prediction accuracy, which was a central aim, and
increased process efficiency, leading to quicker
decision-making. The results provided a solid
understanding of the data landscape, offering
valuable ideas for future research. Moreover, the
models created were not only effective but also
scalable, indicating they could be applied more
widely. Overall, the project showcased the successful
blending of different techniques, leading to
meaningful results that could benefit various fields.
In another study, the researchers looked closely at
a visitor management software system using Grid
View. This approach allowed them to thoroughly
assess how the software affected visitor management
processes by gathering both qualitative and
quantitative data. They collected primary data
through interviews with key people, such as security
staff, front desk employees, and visitors, while also
observing the visitor management process directly.
They supplemented this with secondary data from
company documents, visitor management policies,
and logs. The study found significant improvements
in multiple areas. The introduction of the visitor
management software using Grid View made the
system more efficient, user-friendly, and secure. It
streamlined check-in and check-out processes,
reduced data entry mistakes, and improved data
consistency. (Kumbhar, et al. , 2023)
The authors used advanced techniques to
recognize suspicious behavior based on facial
features. They combined High-order Joint Derivative
Local Binary Pattern, Local Binary Pattern
histogram, and Support Vector Machine algorithms
to extract expressions, especially focusing on fear,
achieving about 69.3% accuracy. They also applied
techniques like band-pass filtering and Eulerian and
Lagrangian transforms to analyze frequency signals
from video data to estimate heart rates linked to
feelings of fear. The system was trained using the
CK+ dataset and tested on online videos, showing a
true recognition rate of 88.89% for identifying fear,
even though it struggled to meet real-time processing
needs. Overall, the results showed that this method
exceeded traditional approaches in accuracy and heart
rate estimation, while also being efficient when run
on a Raspberry Pi 3. The project successfully
illustrated the possibility of using facial features to
detect suspicious behavior, especially focusing on
emotional recognition. (Gawade, et al. , 2020)
Lastly, the team employed various techniques,
including the YOLO model for real-time people
detection and the Particle Swarm Optimization
algorithm for tracking individuals. The system was
created to allow smooth tracking as someone moved
out of one camera's view and into another, achieved
through an inter-camera hand-off protocol. To assess
tracking quality, the researchers introduced the
Motion Smoothness metric. Their tests, which
included tracking two individuals with three cameras,
showed solid and smooth tracking, with most errors
kept below 30 pixels and only 0.15% of frames
experiencing significant discrepancies. (Sahane, et al.
, 2024)
3 METHODOLOGY
The application is supported by a technical
implementation of backend storage, APIs, and system
architecture that allows easy usage and GPS tracking
by the user. The website is visited by users and they
are asked to give some basic information like name,
place, age and if we can track their location. Virtual
boundaries are configured using geofencing
technology to track visitor desire within the park.
With data trucked to a processing and storage, tools
like Apache Flink, Apache Spark, and PyTorch are
used to process, clean, and sort noisy data.
Furthermore, behavioral analysis is performed using
Tableau, Power BI, and Apache Spark, a tool to gain
insights about visitors path, preferences, etc. Clues
include paths taken, areas visited, sessions duration.
Tools like Mapbox, QGIS, and Qlik Sense create
entire reports and maps, which provide actionable
insights for improving visitor experience and park
management.
Data-Driven Visitor Tracking Analytical Insights and Recommendation System
707
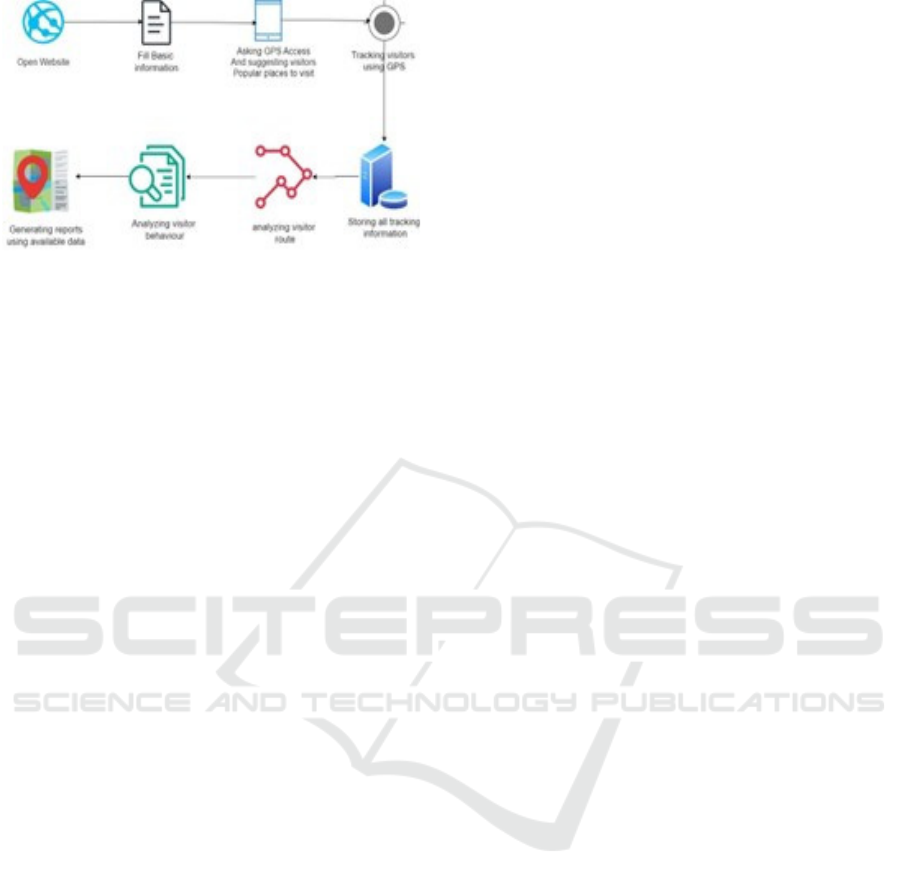
Figure 1: Proposed Method Architecture
3.1 Analytical System
3.1.1 Data collection
Learn more about VTARS VTARS first collects data
from different sources, so it provides a holistic
perspective of visitor interactions. Web analytics are
an essential part of the process, as they record data on
how a website is being used including page views,
click-through rates, average session times and
navigation paths. Furthermore, the system also
employs location-based services to track the
movements of individuals in the physical world,
measuring foot traffic, movement patterns, and dwell
times within the space. By incorporating IoT-
Augmented Visitor Tracking and Recording
Systems (VTARS), organizations can capture and
analyze interaction events with physical objects and
environments, allowing them to collect data from the
digital world that enhances their view of interactions
across the visitor journey or lifecycle. For location we
use Google Maps API, Leaflet.js (already in use), or
OpenStreetMap.
3.1.2 Data Analysis
So in essence VTARS is all about crunching
significant amounts of data and providing the
business value to users. Descriptive Analytics
Descriptive analytics summarizes historical data,
giving a comprehensive view of visitor behaviors
over time such as average duration of visit, most
visited pages, and common paths taken. VTARS
uses predictive analytics that helps with trending of
visitors, which goes beyond descriptive analysis,
utilizing machine learning algorithms to predict
future visitor behaviors and trends. This predictive
ability allows companies to meet visitor expectations
and take preemptive action. It also employs
behavioral segmentation to categorize visitors with
similar traits and behaviors, enabling more precise
strategies for marketing and engagement. We use
Logistic Regression, Decision Trees, Random Forest
for analysis of data.
3.1.3 Pattern Recognition
I figured out VTARS is an edge based component for
doing pattern recognition over visitors behaviour and
for use as a decision making engine. As categories of
products and content trends resurface, the system is
tuned to catch them early. Identifying trends early
allows businesses to adjust their strategies and make
the most of new opportunities Identifying trends
early, allows businesses to adjust their strategies and
takes advantage of the new opportunities. VTARS
not only can identify trends, but also helps detect
anomalies. These functionalities help in spotting
anomalous visitor behaviour that deviates from
established behaviour patterns, which may signify
potential customer experience issues or upswings in
demand for a new product or service here we use
Visualize high-density visitor areas using tools like
d3.js or heatmap.js.
3.1.4 Visualization and Reporting
VTARS also provides strong visualization and
reporting capabilities to make insights from data
analysis easy to access and use. Let’s explore a
completely different way of visualising your insights,
real-time dashboards! Reports can be tailored to suit
the business requirements outlining key findings and
recommendations. Custom reports are produced,
showcasing the most relevant findings and
recommendations in a manner customized to
individual business needs. It can also use visual tools,
like heatmaps and flow charts, to graphically
represent where visitors are moving or where they are
interacting, whether online or IRL. Visualizations
allow businesses to understand complex data at
glance and take informed decisions in a timely
manner.
3.1.5 Security and Privacy
In brute where data privacy is emphasised, VTARS
focuses on data security and privacy compliance.
Visitor data is protected from unauthorized access
and breaches because of the system's string security
measures. Such capabilities are encryption, secure
data storage and access control mechanisms.
Moreover,VTARS complies with data privacy
regulations and standards like the General Data
Protection Regulation (GDPR) and the California
Consumer Privacy Act (CCPA), allowing businesses
INCOFT 2025 - International Conference on Futuristic Technology
708
to use the system with confidence, knowing that
visitor data is handled responsibly and in compliance
with legal requirements. We use TLS/SSL for
security and Privacy purpose
3.2 RECOMMENDATION SYSTEM
3.2.1 Recommendation Engine
A core component of VTARS is a powerful
recommendation engine that serves personalized
content, products, or services to visitors. The system
is based on two central algorithms namely
collaborative filtering and content-based filtering.
Collaborative filtering makes recommendations
based on the behavior of users that are like the given
user, whereas content-based filtering recommends
items based on the features of the items or content
that the user has interacted with in the past.
Collaborative filtering recommends items based on
the actions of its similar users while the content-based
filtering suggests items according to the features of
the items or contents from which a user interacted
before. To increase the accuracy and relevance of its
recommendations, VTARS employs a combination of
hybrid model and content-based approaches, ensuring
that the users receive personalized suggestions that
match their interests.
3.2.2 Data Input for Recommendations
The recommendation system is driven by multiple
data inputs which help to make accurate
recommendations. One type of data source is the rich
user profiles generated (through tracking and
analysis) that enable identification of the users and
their cohorts by their preferences, behaviors and
previous interactions. Additionally, VTARS takes
into account contextual information, like time of day,
user location, and device type, to further tailor
recommendations. VTARS also incorporates
contextual data, such as the time of day, user location,
and device type, to further refine recommendations.
For instance, a visitor’s preferences may change
based on their location (in-store vs. online) or the
device they are using (desktop vs. mobile), and
VTARS adapts its recommendations to suit these
contexts, providing a more relevant and timely
experience for the user.
3.2.3 Recommendation Filtering
VTARS uses two primary filtering methods:
collaborative filtering and content-based filtering. It
uses commonalities for the behavior and tastes of
other users to highlight trends to recommend items
that these users have initiated or bought, named
collaborative filtering. Content-based filtering, on the
other hand, recommends items based on their
similarity to items the user has already interacted
with, relying on properties or characteristics of the
items, like categories or features. We use
Collaborative Filtering (Matrix Factorization),
Content-Based Filtering for recommendation
filtering.
3.2.4 Real-time Processing
VTARS makes sure that its suggestions are always
fresh and relevant by using real-time processing.
When users engage with the system, their information
is processed right away, which means the
recommendations can change instantly based on
what’s happening. This feature keeps users up to date
with the most relevant suggestions, improving their
experience. Plus, VTARS is designed to grow, so the
recommendation engine can manage a lot of data and
users without slowing down, making it a good fit for
businesses of all sizes.
3.2.5 User Feedback Integration
One important thing about VTARS is how it takes
user feedback to make its recommendations better. It
gathers feedback in two ways: users can give ratings
and write reviews, which is called explicit feedback,
while implicit feedback comes from things like how
often people click on items, how long they stay on a
page, and how frequently they interact. This
information helps VTARS fine-tune its
recommendations. By looking at this feedback
regularly, VTARS changes its suggestions to match
what users like more closely, making the
recommendations feel more personal and useful as
time goes on.
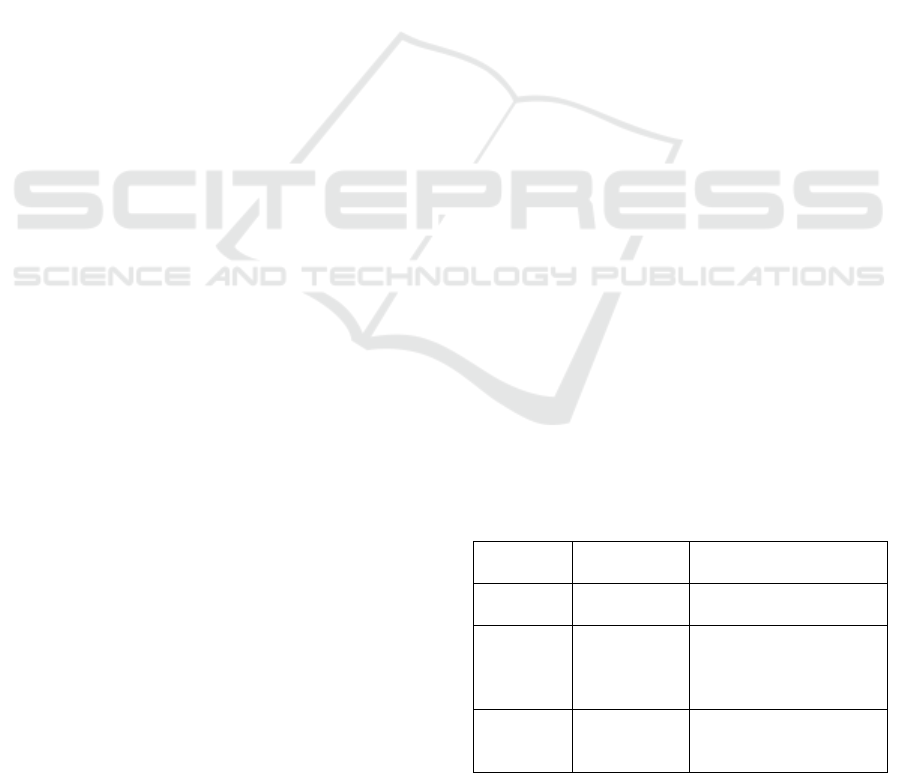
Table 1: Recommendation System
Recommend
ation Syste
m
Accuracy. 88% Percentage of correct
recommendations
Precision 91% Proportion of relevant
recommendations
among all
recommendations.
Clustering
Accuracy
93% Effectiveness in
segmenting visitors into
meanin
g
ful
g
rou
p
s.
Data-Driven Visitor Tracking Analytical Insights and Recommendation System
709

4 USER EXPERIENCE
4.1 Tailored User Journeys
VTARS helps you create personalized user journeys
by customizing interactions according to the
individual visitor data. The system captures user
actions through several touchpoints, online as well as
offline, and utilizes these data to personalize the
content, products, and services that are shown to
each visitor. VTARS uses this history to ensure each
user presents an experience that is tailored to their
unique preferences and needs. VTARS tailors the
user journey to their interests so that whether the
visitor is browsing a website, shopping in-store, or
using a mobile app, they feel satisfied and are
encouraged to come back and engage again.
4.2 Real-time Interaction
VTARS improves user experience through real-time
interaction. VTARS continues to process user
interactions with a website or app and make instant
updates to the content or offers immediately. If a
visitor shows interest in a particular product
category, VTARS is capable of instantly
recommending similar products or providing
discounts, bringing interactivity and personalization
to an all-time high. Being capable of in-the-moment
actions, enhancing user experience and boosting
conversion rates as their needs are catered to
instantly.
4.3 Proactive Support and Guidance
Finally, VTARS enhances user experience through
its proactive support and guidance throughout the
user journey. For example, if the AI system notices
that visitors are spending a lot of time on the FAQ
page, it can predict that they may needed assistance
and can prompt visitors to live-chat with a
representative, show visitors the relevant tips, guide
users through procedures steps etc. Educating visitors
in this way proactively ensures that they get the
assistance they require before problems occur,
minimizing frustration and improving the overall
experience. VTARS fosters a better and more user-
friendly environment by making interactions
seamless and fluid.
4.4 Feedback and Continuous
Improvement
User experience is a continuous improvement
process, driven by feedback loops, across and through
VTARS. The system gathers and interprets
information from users, either in explicit form such as
surveys and ratings or in the form of implicit signals
such as engagement metrics and behavioral data. The
feedback received is to identify areas for
improvement and make informed adjustments to
optimize the user experience. VTARS improves and
enhances the way people interact with any platform
by creating smooth, fluid and easy interactions.
Feedback and Continuous Improvement User
experience is a continuous improvement cycle, fed in
and across and through VTARS by feedback loops.
The system collects and processes data from users,
both in explicit forms (surveys, ratings) and implicit
signals (engagement, behavioral data, etc.).
5 CONCLUSIONS
In a world increasingly driven by data, the confluence
of visitor tracking, analytics, and recommendation
systems represents a powerful toolset for shaping the
future of digital interactions. These systems offer the
potential to understand users on a granular level,
enabling the creation of personalized experiences that
resonate with individual needs and preferences. From
e-commerce to content delivery, the ability to predict
and respond to user behavior in real time is
transforming industries and redefining engagement
strategies.
However, as we push the boundaries of what is
possible, we must remain vigilant about the ethical
implications of our work. The fine line between
personalization and privacy must be carefully
navigated. Transparency in data collection practices,
user consent, and robust security measures are not just
legal obligations but moral imperatives. Ensuring that
users feel safe and respected in their digital
environments will be key to the long-term success of
these technologies.
As we look ahead, the potential for visitor
tracking and recommendation systems to create more
meaningful, efficient, and enjoyable user experiences
is immense. The challenge lies in harnessing this
potential responsibly, balancing innovation with the
need to protect and empower users. With thoughtful
design and ethical considerations at the forefront,
these systems will not only enhance business
INCOFT 2025 - International Conference on Futuristic Technology
710

outcomes but also contribute to a more connected and
user-centric digital landscape
REFERENCES
Ryan L. Sharp, Ted T. Cable, Aubrey Burns “The
Application of GPS Visitor Tracking Implications for
Interpretation at Heritage Sites”, journal of
interpretation research (0975 – 8887) Volume 24 – No.
1, September 2020
Russo, A.P., Clave, S.A., Shoval, N. (2010). “Advanced
Visitor Tracking Analysis in Practice: Explorations in
the PortAventura Theme Park and Insights for a Future
Research Agenda.” In: Gretzel, U., Law, R., Fuchs, M.
(eds) Information and Communication Technologies in
Tourism 2010. Springer, Vienna. DOI.org (Crossref),
Erlina, T., & Fikri, M. (2023). “YOLO Algorithm-based
Visitor Detection System for Small Retail Stores using
Single Board Computer.” Journal of Applied
Engineering and Technological Science (JAETS), 4(2),
908–920
Singh, Vidushi and Rathi, Nandini and Choudhary, Khushi
and Gupta, Pragya and Mehendale, Ninad, “Design and
Development of Bidirectional Visitor Counter using
Arduino Uno Micro-Controller and IR Sensors” (May
10, 2023).
Wu, Yi-Chang, Ching-Han Chen, Yao-Te Chiu, and Pi-Wei
Chen. 2021. "Cooperative People Tracking by
Distributed Cameras Network" Electronics 10, no. 15:
1780.
S. -H. Choi, S. -Y. Kim and Y. -C. Ra, "A Study on Visitors
Tracking Method Using Wireless Communication,"
2013 International Conference on Information Science
and Applications (ICISA), Pattaya, Thailand, 2013,
R. G. Khedkar, S. R. Tandle “Rating Prediction based on
Social Sentiment from Textual Reviews”, International
Journal of Computer Applications (0975 – 8887)
Volume 178 – No. 26, June 2019
Dr. Nilesh B. Korade , Dr. Mahendra B. Salunke , Dr. Amol
A. Bhosle , Dr. Prashant B. Kumbharkar , Gayatri G.
Asalkar , Rutuja G. Khedkar “Strengthening Sentence
Similarity Identification Through OpenAI Embeddings
and Deep Learning” (IJACSA) International Journal of
Advanced Computer Science and Applications, Vol.
15, No. 4, 2024
M. Ben Ayed, S. Elkosantini, S. A. Alshaya and M. Abid,
"Suspicious Behavior Recognition Based on Face
Features," in IEEE Access, vol. 7, pp. 149952-149958,
2019.
Dr. Nilesh B. Korade, Dr. Mahendra B. Salunke, Gayatri G.
Asalkar, Rutuja G. Khedkar, Ashwini U. Bhosale,
Dhanashri M. Joshi, Amol C. Jadhav “Exploring NLP
Techniques for Duplicate Question Detection to
Maximizing Responses on Q&A Websites”
International Journal of Intelligent Systems and
Applications in Engineering IJISAE, 2024
Y. K. Ching, A. S. Prabuwono and R. Sulaiman, "Visitor
face tracking system using OpenCV library," 2009
IEEE Student Conference on Research and
Development (SCOReD), Serdang, Malaysia, 2009
A Joshi, P.G., “Algorithm for Safety Decisions in Social
Media Feeds Using Personification Patterns”, JAIT,
Vol. 14, No. 1, 2023
V. Kumbhar, U. Maurya, et.al, "Crevice Identification: A
Survey on Surface Monitoring," 2023 IEEE
International Conference on Contemporary Computing
and Communications (InC4), Bangalore, India, 2023
Prema Gawade, Sarang Joshi, “Feature Selection for
Embedded Media in the Context of Personification”,
2020 IEEE Second International Conference on
Inventive Research in Computing Applications
(ICIRCA), 2020
P. Sahane, P. Nalawade, J. Bhamare, S. Vaishnav, U. Jagtap
and A. Bhosale, "Industry - Specific Carbon Emission
Reduction Techniques: A Comprehensive Survey,"
2024 8th International Conference on I-SMAC (IoT in
Social, Mobile, Analytics and Cloud) (I-SMAC),
Kirtipur, Nepal, 2024
Data-Driven Visitor Tracking Analytical Insights and Recommendation System
711
