
An Extreme Gradient Boosting (XGBoost) Trees Approach to Detect and
Identify Unlawful Insider Trading (UIT) Transactions
Krishna Neupane
1 a
and Igor Griva
2 b
1
George Mason University, Department of Computational and Data Science, U.S.A.
2
George Mason University, Department of Mathematical Science, U.S.A.
Keywords:
Unlawful Insider Trading, Ensemble Methods, Decision Trees, Fraudulent Activities, XGBoost.
Abstract:
Corporate insiders have control of material non-public preferential information (MNPI). Occasionally, the
insiders strategically bypass legal and regulatory safeguards to exploit MNPI in their execution of securities
trading. Due to a large volume of transactions a detection of unlawful insider trading becomes an arduous
task for humans to examine and identify underlying patterns from the insider’s behavior. On the other hand,
innovative machine learning architectures have shown promising results for analyzing large-scale and complex
data with hidden patterns. One such popular technique is eXtreme Gradient Boosting (XGBoost), the state-of-
the-arts supervised classifier. We, hence, resort to and apply XGBoost to alleviate challenges of identification
and detection of unlawful activities. The results demonstrate that XGBoost can identify unlawful transactions
with a high accuracy of 97 percent and can provide ranking of the features that play the most important role in
detecting fraudulent activities.
1 INTRODUCTION
Corporate insiders, in their privileged roles, access
material non-public information (MNPI). While the
Securities Exchange Act of 1934, specifically Sec-
tion 10b-5
3
, prohibits utilizing this information for
financial gain, detecting violations is challenging.
Insiders often employ creative strategies to conceal
their trading activities. These unlawful trades often
mimic routine transactions (Cohen et al., 2012), mak-
ing them opaque and difficult to identify using tradi-
tional, manually-engineered approaches. Therefore,
effectively uncovering hidden patterns of such activ-
ity within voluminous transaction data requires inno-
vative methodologies that have demonstrated effec-
tiveness (Mayo and Hand, 2022), (Varol et al., 2017).
Historically, research on detecting unlawful in-
sider trading (UIT) has often been grounded in eco-
nomic theories and legal analysis. Kyle’s 1985 pa-
per provided the first significant theoretical formula-
tion for unlawful insider trading (UIT), applying in-
formation asymmetry—the phenomenon of unequal
information causing market disequilibrium—through
a dynamic model that examines how private infor-
a
https://orcid.org/0000-0003-3911-3988
b
https://orcid.org/0000-0002-2291-233X
mation affects prices, market liquidity, and its value
(Kyle, 1985). Following this foundational work,
other studies analyzing information asymmetry in in-
sider trading include Seyhun’s 1986 study (Seyhun,
1986), which investigated insider and outsider trad-
ing profits and the determinants of insiders’ predictive
ability using a large transaction dataset, discussing
implications for market efficiency. Rozeff and Za-
man’s 1988 paper (Rozeff and Zaman, 1988) exam-
ined whether publicly available insider trading data
allows outsiders to earn abnormal profits, finding the
anomaly persists but is largely explained by size and
earnings/price effects when considering transaction
costs. Lin and Howe’s 1990 paper (Lin and Howe,
1990) examined insider trading profitability in the
OTC/NASDAQ market, finding insiders show timing
ability but high transaction costs preclude outside in-
vestors from earning abnormal profits by mimicking
them, and identifying determinants of insider profits.
Huddart, Hughes, and Levine’s 2007 study (Huddart
and Ke, 2007) investigated the relationship between
insiders’ trades and firms’ information asymmetry,
analyzing whether proxies for information asymme-
try are associated with insider trading patterns as pre-
dicted by informed trading theories. Finally, Arm-
strong, Jagolinzer, and Pagach’s 2012 paper (Arm-
strong et al., 2012) examined the relationship between
Neupane, K., Griva and I.
An Extreme Gradient Boosting (XGBoost) Trees Approach to Detect and Identify Unlawful Insider Trading (UIT) Transactions.
DOI: 10.5220/0013637500003967
In Proceedings of the 14th International Conference on Data Science, Technology and Applications (DATA 2025), pages 171-181
ISBN: 978-989-758-758-0; ISSN: 2184-285X
Copyright © 2025 by Paper published under CC license (CC BY-NC-ND 4.0)
171

corporate governance and firms’ information environ-
ments, finding that state antitakeover laws were as-
sociated with decreased information asymmetry and
increased financial statement informativeness.
Complementing studies on information asymme-
try, scholars have also been motivated by the theory
of liquidity preferences to study unlawful insider trad-
ing. Amihud and Mendelson’s 1987 paper examined
how trading mechanisms affect price behavior and
return patterns, highlighting their impact on market
liquidity (Amihud and Mendelson, 1987). Easley et
al.’s 1996 paper investigated how information-based
trading affects spreads for different stocks, finding it
contributes to observed differences in market liquid-
ity (Easley et al., 1996). Pagano and Steil’s 1996 pa-
per investigated whether greater transparency in trad-
ing systems enhances market liquidity by reducing
trading costs for uninformed participants (Pagano and
R”oell, 1996). More directly linking insider trading
to liquidity, Cao, Chen, and Shen’s 2004 paper tested
the hypothesis that insider trading impairs market liq-
uidity, finding that significant insider trading around
IPO lockup expirations had little negative effect on ef-
fective spreads and improved other liquidity measures
(Cao et al., 2004).
In addition to economic perspectives, legal schol-
ars have debated whether insider trading should be
fully lawful versus unlawful. Bainbridge’s 2022
paper (Bainbridge, 2022) critically examined the
evolving legal standards applied by Delaware courts
to controlling shareholder transactions, contending
that increased skepticism leads to overregulation and
proposing reforms to reduce costs and encourage in-
vestment. Manne’s foundational 1966 work (Manne,
1966) reexamined the debate on insider trading’s role,
arguing that informed trading facilitates the timely
transmission of valuable information to top managers
and large shareholders, thus contributing to market ef-
ficiency.
In contrast to the pro-lawful stance, the opposing
camp argues that insider trading impedes and erodes
investor confidence and increases agency costs, with
research supporting the need for regulation. Gan-
gopadhyay et al.’s 2022 study (Gangopadhyay and
Yook, 2022) found that opportunistic insider trading
profits, particularly from purchases, significantly de-
creased following the enactment of the Dodd-Frank
Act, suggesting regulation impacts strategic insider
behavior. Cumming et al.’s 2011 paper (Cumming
et al., 2011) examined stock exchange trading rules
concerning market manipulation, insider trading, and
broker-agency conflict across countries and over time,
finding that differences in these rules significantly af-
fect market liquidity.
Detection methods derived from these domains
typically rely on explicitly stated functional rela-
tionships and limited sets of covariates (e.g., vol-
ume, prices, returns, book-to-market, influence, senti-
ment, and so on) (Jacobs and Weber, 2015), (Fishman
and Hagerty, 1995), (John and Narayanan, 1997),
(Leamer, 1978). These traditional approaches strug-
gle to capture the interactiveness and non-linearities
inherent in data, leading to potential model misspec-
ifications and limited discovery of complex empiri-
cal irregularities. Furthermore, techniques often em-
ployed, such as time-series forecasting are known for
their lack of scalability with increasing data volumes
and can be prone to over-generalization when evalu-
ated on single train/test splits (Hand, 2009), (Ander-
son, 2007), (Ge and Smyth, 2000), (Hamilton, 1989),
(Rabiner and Juang, 1986), (Box et al., 1972).
Addressing the limitations of traditional meth-
ods and the need for innovative approaches, ma-
chine learning (ML) techniques, particularly classi-
fiers, represent a promising avenue for detecting com-
plex hidden patterns indicative of UIT (Sundarkumar
and Ravi, 2015), (Louzada and Ara, 2012). In the
context of UIT, numerous studies have leveraged var-
ious classification methods to identify potential UIT
based on data from events, news, public information
releases, and transaction patterns (Li et al., 2022),
(Rizvi et al., 2022), (Seth and Chaudhary, 2020), (Is-
lam et al., 2018), (Goldberg et al., 2003).
Among the scalable and data-driven ML tech-
niques successfully applied in this domain are en-
semble methods, such as Random Forest (RF) and
XGBoost. These methods are effective because they
learn and discover empirical regularities directly from
data without requiring pre-defined functional relation-
ships. Both RF and XGBoost have demonstrated suc-
cess in detecting, identifying, and characterizing UIT.
Specific studies illustrate this success. For instance,
Deng et al. (Deng et al., 2021) implemented RF in
the Chinese Securities Market with 26 features, ac-
curately classifying over 75 percent of UIT. Building
upon this, Neupane et al. (Neupane and Griva, 2024)
extended the feature space to 110 features, achieving
over 95 percent accuracy with RF. Related work has
also utilized XGBoost for this purpose, with an effort
by Deng et al. (Deng et al., 2019) reporting 85 percent
accuracy. Drawing on these consistent and promis-
ing results, the current study utilizes XGBoost, lever-
aging its architectural design for parallel computing
and its iterative process of updating parameters to
strengthen weak learners by implicitly engaging ev-
ery feature. This approach fundamentally addresses
the drawbacks of manual feature engineering, such as
mis-specifications and omitted features, by inherently
DATA 2025 - 14th International Conference on Data Science, Technology and Applications
172

handling inter-dependencies, multi-dimensionalities,
and non-linearities in data (Malhotra, 2021), (Hou
et al., 2020), (Iskhakov et al., 2020), (Camerer, 2019),
(Fudenberg and Liang, 2019).
This study makes several contributions. First, the
feature space for XGBoost-based UIT detection is ex-
tended from 26 to 110 features to assess the impact
on accuracy. Second, the analysis is based on a sig-
nificantly larger number of transactions from the US
Securities market compared to previous work. Third,
a simplified parameter search technique is employed
for improved efficiency over external optimization
methods. Fourth, using two ranking techniques, dis-
tinct features that play prominent roles in identifying
unlawful trading within a mixed set of institutional,
trade, and financial features are identified, with results
compared both with and without removing correlation
between features.
The manuscript is organized as follows. Section 2
describes the methodology, outlining the theory be-
hind various used techniques, hyper-parameter tun-
ing, performance measures and feature selection cri-
teria. Section 3 describes the experimental settings.
Section 4 includes data description, classification re-
sults, and feature ranking. Section 5 discusses the
results and provides conclusions and possible future
directions.
2 PROPOSED METHODOLOGY
To detect UIT, the paper implement XGBoost, a
method well-known for its ability to capture complex
nonlinear interactions in the data, which is a basis for
attaining high out-of-sample accuracy. Designed for
speed and efficient memory management, XGBoost
has demonstrated superior performance across di-
verse applications, including credit scoring (Mushava
and Murray, 2022), fraud detection (Zhang et al.,
2020), consumer credit risk evaluation (Wang et al.,
2022a), DNA sequence identification (Sang et al.,
2020), and climate science (Wang et al., 2022b).
Moreover, as an ensemble method, it aligns with tech-
niques considered effective for empirical work in eco-
nomics (Athey, 2019). The approach taken in this
study leverages corporate governance, trade, and fi-
nance data for detecting UIT by extending the ap-
plication of XGBoost to this domain. The method-
ology also integrates Principal Component Analysis
with XGBoost for comparative analysis. For compar-
ison, the results are contrasted with previous studies,
specifically those by (Deng et al., 2021), (Deng et al.,
2019), and (Neupane and Griva, 2024). These repre-
sent the only publicly available comparative studies in
this area.
2.1 eXtreme Gradient Boosting
(XGBoost)
XGBoost was proposed by (Chen and Guestrin,
2016), which is a highly scalable and powerful algo-
rithm belonging to the gradient boosting family. It
implements a distributed gradient tree boosting strat-
egy, training the model by sequentially learning from
multiple weak classifiers and iteratively updates them
to correct errors from preceding steps, while also al-
lowing for efficient memory management. This itera-
tive process combines the updated weak learners into
a powerful ensemble. In summary, XGBoost trains its
model through this iterative boosting process: It starts
with an initial base prediction. Then, in each step, it
calculates the errors (residuals), constructs and fits a
new decision tree to predict these residuals, and adds
the tree to the ensemble to minimize loss. Predictions
are updated, new residuals calculated, and this se-
quence is repeated for a set number of iterations. The
final prediction combines the outputs from all trees.
Formally, consider a training dataset, D = (x
i
,y
i
)
n
i=1
,
where n is the number of instances (rows) and each in-
stance (x
i
∈ R
m
) is a vector of m features (columns),
y
i
∈ R represents the label for the i-th instance (e.g., 1
for unlawful, 0 for lawful). The predicted value, ˆy
i
for
the i-th instance from an ensemble model comprising
K decision trees is given by the sum of the predictions
from each tree as in Equation 1.
ˆy
i
=
K
∑
k=1
f
k
(x
i
), f
k
∈ F, (1)
where f
k
denotes the k-th decision tree and F is
the functional space containing all possible decision
trees. XGBoost aims to minimize a regularized objec-
tive function Ob j to learn the set of trees f
k
K
k=1
. This
objective function combines the training loss and a
regularization term to control model complexity. The
loss function ℓ(y
i
, ˆy
i
) measures the difference between
the actual label (y
i
) and the predicted value ( ˆy
i
) for
a single instance. The total training loss over the
dataset is the sum of individual instance losses given
by Equation 2.
L(y,
ˆ
y) =
n
∑
i=1
ℓ(y
i
, ˆy
i
), (2)
where y and
ˆ
y are the vectors of actual and pre-
dicted labels for all n instances, respectively. The loss
function ℓ can be selected based on the task (e.g.log
loss for classification). During training, XGBoost it-
eratively adds trees, optimizing the objective function
An Extreme Gradient Boosting (XGBoost) Trees Approach to Detect and Identify Unlawful Insider Trading (UIT) Transactions
173

with respect to the parameters of the new tree being
added at each step. The regularization term Ω( f
k
)
for the k-th decision tree f
k
is calculated based on the
tree’s structure and leaf weights given by Equation 3.
Ω( f
k
) = γT
k
+
1
2
λ
T
k
∑
j=1
w
2
k, j
, (3)
where T
k
is the number of leaf nodes in the k-th
tree, w
k, j
is the prediction weight of the j-th leaf in
the k-th tree (with (w
2
k, j
) being its square), (γ) is the
L1 regularization term on the number of leaves, and
(λ) is the L2 regularization term on the leaf weights.
These terms control tree pruning and the magnitude
of leaf weights, respectively. The overall regularized
objective function that XGBoost minimizes is defined
as the sum of the total training loss and a regulariza-
tion term Ω that penalizes the complexity of the trees
given by Equation 4.
Ob j =
n
∑
i=1
ℓ(y
i
, ˆy
i
) +
K
∑
k=1
Ω( f
k
), (4)
2.2 Parameter Tuning
Tuning hyperparameters is crucial for many ML tech-
niques, and XGBoost is no exception; it is essential
for minimizing the objective function and controlling
overfitting. These parameters, which can be catego-
rized into regularization, pruning, and sampling, in-
fluence the overall prediction errors. For Regulariza-
tion, commonly used hyperparameters are Learning
rate (η) and L2 regularization (λ). η controls the step
size (shrinkage) applied to weights at each boosting
iteration. Smaller η values lead to more conservative
models and require more boosting rounds. λ applies
penalty to the leaf weights based on the sum of their
squares. Increasing λ makes the model more con-
servative. For Pruning, the Minimum split improve-
ment (γ) parameter is used. It acts as a regularization
parameter specifying the minimum loss reduction re-
quired to make a split, thereby controlling tree com-
plexity and preventing overfitting. To reduce variance
and improve generalization, Sampling is applied to
data instances or features for each tree or iteration.
In this study, Column sub-sampling and Row sam-
pling are employed. Column sub-sampling refers to
the fraction of features randomly sampled per tree or
per level when building trees, while Row sampling is
the fraction of data instances randomly sampled per
tree or per round.
2.3 Feature Importance
XGBoost’s built-in feature ranking, a key tool for
model interpretation and feature selection, is anal-
ogous to that of RF, as both techniques commonly
use the mean decrease in impurity (Gini Score) dur-
ing training. However, this method is known to
have limitations, such as bias towards correlated and
high-cardinality features, and relies solely on train-
ing data. To provide a more robust ranking, a sec-
ond feature ranking approach was implemented. This
approach involves decorrelating features using hier-
archical clustering and subsequently ranking them
based on permutation importance scores. Permutation
importance is often preferred over MDI as it directly
measures a feature’s impact on model performance on
unseen data and is less susceptible to training-phase
biases. This second approach follows the methodol-
ogy described by (Neupane and Griva, 2024).
2.4 Principal Component Analysis
The analysis in this study employs Principal Com-
ponent Analysis (PCA), a classic unsupervised tech-
nique for data decorrelation and compression. This
method has demonstrated effectiveness in various ap-
plications, notably in studies on UIT (Deng et al.,
2021), (Neupane and Griva, 2024), and the detailed
methodology followed is based on that described by
(Neupane and Griva, 2024).
2.5 Performance Measure
Model performance is evaluated using a 2 × 2 confu-
sion matrix organized by actual and predicted classes,
schematically represented by Table 1. Assuming
‘Lawful’ is the positive class (+) and ‘Unlawful’ is
the negative class (-), the matrix yields four outcomes:
True Positives (TP) for correct positive predictions,
True Negatives (TN) for correct negative predictions,
False Positives (FP) for negative instances incorrectly
predicted as positive, and False Negatives (FN) for
positive instances incorrectly predicted as negative.
From this matrix, metrics like overall accuracy (ACC)
and Precision (PRE) are calculated. ACC measures
the total proportion of correct classifications, and PRE
(for the positive class) is the proportion of predicted
positives that are truly positive.
3 EXPERIMENTAL SETUP
The experimental settings broadly replicate Neupane
et al. (2024). Data originates from SEC Form 4
DATA 2025 - 14th International Conference on Data Science, Technology and Applications
174

Table 1: Organization of the 2 × 2 grid of confusion matrix
used to measure state of lawfulness of insider trading trans-
actions.
Predicted Label (PP+PN)
Actual
Labels
Total
Population
Positive Negative
Lawful -
Positive
True
Lawful
False
Unlawful
Unlawful -
Negative
False
Lawful
True
Unlawful
filings, linked with CRSP and Compustat-CapitalIQ
trade and finance data via personid, cik, and com-
panyid. Comprising 3984 fully labeled transactions
(1992 unlawful) with 110 dimensions per row, the
merged dataset was used alongside a 320-transaction
subset for comparison. Each dataset subset, balanced
(0.5:0.5 ratio) and sub-divided by feature sets (orig-
inal vs. PCA-integrated), was then split deterministi-
cally 80 percent (training): 20 percent (test) for analy-
sis. Numerical features X
i
(i = 1,...,n) were normal-
ized using the z-score method
1
, while categorical fea-
tures were one-hot-encoded. Hyperparameters such
as η, γ, max depth, and sample rate were initialized in
a random search space, with tuning conducted over
5 iterations within 5-fold cross-validation. Feature
rankings were derived from MDI (based on training
data) and permutation importance (applied to train-
ing and test data), with the latter’s flexibility allowing
for the ranking of test data even after feature decor-
relation. Correlation was removed by performing hi-
erarchical clustering based on Spearman rank-order
correlation and selecting a representative feature from
each cluster. The experiment was performed with 100
repetitions using scikit-learn and xgboost libraries,
where each repetition involved randomly sampling
lawful transactions.
4 ANALYSIS AND RESULTS
This section reports and interprets the performance of
the implemented methods based on confusion matrix
metrics, drawing upon the dataset characteristics il-
lustrated in Table 2. Performance metrics, averaged
over 100 experiments (Table 4), are presented. Hyper-
parameter tuning was performed to optimize model
performance, involving 5-fold cross-validation and
100 repetitions, using AUC as the stopping criterion.
This process optimized parameters such as ntrees, η,
max depth, γ, and sample rate: for instance, ntrees
was typically optimized to values around 500 to 520,
1
The z-score transformation standardizes features to
have a mean of 0 and standard deviation of 1, placing pre-
dictors on a common scale (
X
i
−µ
σ
) (Gelman, 2008).
Table 2: Distribution of balanced unlawful and randomly
selected lawful transactions. The right-hand side shows a
random subset of this data matching transaction counts from
Deng et al. (2019). Example referenced from Neupane et
al. (2024).
All Trans. Subset of Trans.
Label Sell Pur. Total Sell Pur. Total
Lawful 405 1587 1992 27 133 160
Unlawful 318 1674 1992 26 134 160
Table 3: Performance evaluation metrics for benchmark
methods applied to UIT detection referenced from Deng et
al. 2021, Deng et al. 2019.
Random Forest* XGBoost†
Label ANN SVM Adaboost No
PCA
With
PCA
Classic GA NSGA
II
ACC 69.57 75.33 74.75 79.01 77.15 77.88 81.77 84.99
FNR 19.21 21.42 26.62 21.97 20.14 22.70 16.43 13.47
FPR 34.07 27.75 24.42 19.57 25.48 21.56 20.10 16.31
TNR 65.93 72.75 75.58 80.43 74.52 78.44 83.69 83.69
TPR 80.79 78.58 73.38 78.03 79.86 77.30 83.57 86.53
PRE - - - - - 78.94 - -
Notes: * (Deng et al., 2019), † (Deng et al., 2021)
max depth often favored values around 16, and η was
right around the default value of 0.03. To compare
the reported metrics, benchmark results from (Deng
et al., 2019) are presented in Table 3.
4.1 Results of Classification of Insider
Trading Transactions
Performance varies with transaction count, feature set
size, and PCA integration. The benchmark method
(XGBoost-NSGAII) achieves an accuracy of 84.99
percent (Table 3). In the implemented settings using
320 transactions, the average ACC is 83.105 (Table
4), closely approaching the benchmark. Performance
with 320 transactions improves significantly to 89.24
percent ACC when PCA is not integrated. Further-
more, utilizing the full 3984 transactions consistently
leads to improved performance across all feature set
sizes and PCA conditions. For instance, using the full
dataset, ACC averages 90.61 percent, surpassing the
benchmark.
Based on the data illustrated in Table 2, the per-
formance of implemented methods is compiled and
Table 4: Average of the performance metrics of 100 exper-
iments in 5-fold cross-validation. The first four columns
are based on 320 random selections from 3984 transactions
matching the count of the previous study.
Subset (n=320) 3984 Trans.
Metric 25 Features 110 Features 25 Features 110 Features
No
PCA
With
PCA
No
PCA
With
PCA
No
PCA
With
PCA
No
PCA
With
PCA
ACC 83.34 78.79 89.24 81.05 98.12 97.43 99.02 97.96
PRE 84.67 79.38 89.59 80.01 98.19 97.01 97.32 97.32
TPR 81.88 78.7 89.3 83.5 98.05 97.87 98.98 98.64
FNR 18.12 21.3 10.7 16.5 1.95 2.13 1.02 1.36
FPR 15.2 21.12 10.82 21.39 1.8 3.01 0.93 2.71
TNR 84.8 78.88 89.18 78.61 98.2 96.99 99.07 97.29
An Extreme Gradient Boosting (XGBoost) Trees Approach to Detect and Identify Unlawful Insider Trading (UIT) Transactions
175

presented in confusion matrix metrics, averaged over
100 experiments and 5-fold cross-validation (Table
4). To compare the results, those from (Deng et al.,
2021) and (Deng et al., 2019) are compiled in Table
3. Among the benchmarks, XGBoost-NSGAII (last
column of Table 3) achieves an accuracy of 84.99 per-
cent, the highest. Comparatively, in Table 4 that uses
320 transactions, the ACC with 25 features is 83.34
(first column of Table 4), a very close result compared
to the benchmark. The performance declines to 78.79
percent when PCA is used in the same setting. But
with the addition of features (110 Features) within the
same settings (320 transactions), the results start ap-
proaching the benchmark’s highest performance. As
the number of transactions is added (3984 transac-
tions), with either limited set of features (25) or addi-
tional (110), the ACC starts improving substantially.
A notable performance increase, averaging 90.61 per-
cent ACC, is observed when using the full 3984 trans-
actions with either 25 or 110 features (with or without
PCA).
Beyond overall accuracy, other key metrics from
the confusion matrix provide further insights into
performance (Table 4). For metrics where higher
values indicate better performance – True Positive
Rate (TPR), True Negative Rate (TNR), and Precision
(PRE) – the implemented method generally demon-
strates competitive or superior results compared to
benchmark methods (Table 3). While the bench-
mark’s best reported TPR, TNR, and PRE are 86.53
percent, 83.69 percent, and 78.94 percent respec-
tively, the implemented method achieves significantly
higher values in several scenarios (Table 4). For in-
stance, using all 3984 transactions, TPR averages ap-
proximately 98.38 percent (reaching a high of 98.98
percent), and TNR averages approximately 97.9 per-
cent (reaching a high of 99.07 percent). Consistent
with ACC, TPR and TNR improve with increased
data size.
Conversely, for metrics where lower values indi-
cate better performance – False Positive Rate (FPR)
and False Negative Rate (FNR) – the implemented
method also shows strong results, particularly with
increased data (Table 4). Compared to benchmark
FPRs which average 16.31 percent (Table 3), the im-
plemented method’s FPR averages 17.13 percent with
320 transactions but drops significantly to approxi-
mately 2.11 percent with 3984 transactions. Simi-
larly, benchmark FNRs range from 13.47 percent to
26.62 percent (Table 3), whereas the implemented
method’s FNR sees a substantial reduction from
16.66 percent with 320 transactions to a remarkable
1.62 percent with 3984 transactions, highlighting few
missed unlawful transactions with more data. The im-
pact of PCA varies; on average, performance metrics
are better when PCA is not integrated.
A direct comparison was made between the
performance metrics of the implemented XGBoost
method (Table 4) and the Random Forest results
from Table 5 of (Neupane and Griva, 2024), who
used the same experimental conditions. Both mod-
els achieved exceptionally high performance when
trained and evaluated on the full set of 3984 trans-
actions, demonstrating strong accuracy and low error
rates across various configurations (25/110 features,
with/without PCA). A detailed comparison highlights
key strengths of the implemented XGBoost method.
XGBoost achieves accuracy exceeding 99 percent in
optimal configurations (Table 4) and demonstrates
remarkably strong control over false negative rates,
reaching a minimum FNR of 1.02 percent, which is
marginally lower than the best Random Forest FNR
(1.07 percent) reported in Table 5 of (Neupane and
Griva, 2024) . This strong performance in minimizing
missed unlawful transactions, alongside high overall
accuracy and robust control over other error rates, po-
sitions XGBoost as a highly effective and potentially
preferred classifier for this task.
4.2 Variable Importance
The strong performance achieved by XGBoost (see
Table 4), which consistently outperformed bench-
mark studies, warrants an investigation into the con-
tributions of individual input features to UIT clas-
sification. Analyzing these contributions enhances
model explainability and interpretability. Therefore,
to address this common limitation of many ML meth-
ods, feature importance ranking was conducted using
XGBoost’s inbuilt Mean Decrease of Impurity (based
on Gini Scores), a training-data-based technique in-
fluenced by correlation, and permutation importance,
a computationally expensive method that can be ap-
plied to training and test data after decorrelation us-
ing hierarchical clustering and representative feature
selection (see Section 2.3 for details).
Figures 1 and 2 are horizontal bar charts illustrat-
ing feature importance rankings, where the length of
each bar indicates the importance score of a specific
feature, with features ordered from most important at
the top to least important at the bottom. A longer bar
signifies higher importance according to the specific
method used. Figure 1 presents features ranked by
MDI scores, while Figure 2 displays the ranking ob-
tained using Permutation Importance before applying
decorrelation. As discussed, MDI-based ranking is
based solely on training data and is known to be par-
ticularly sensitive to highly correlated features, which
DATA 2025 - 14th International Conference on Data Science, Technology and Applications
176
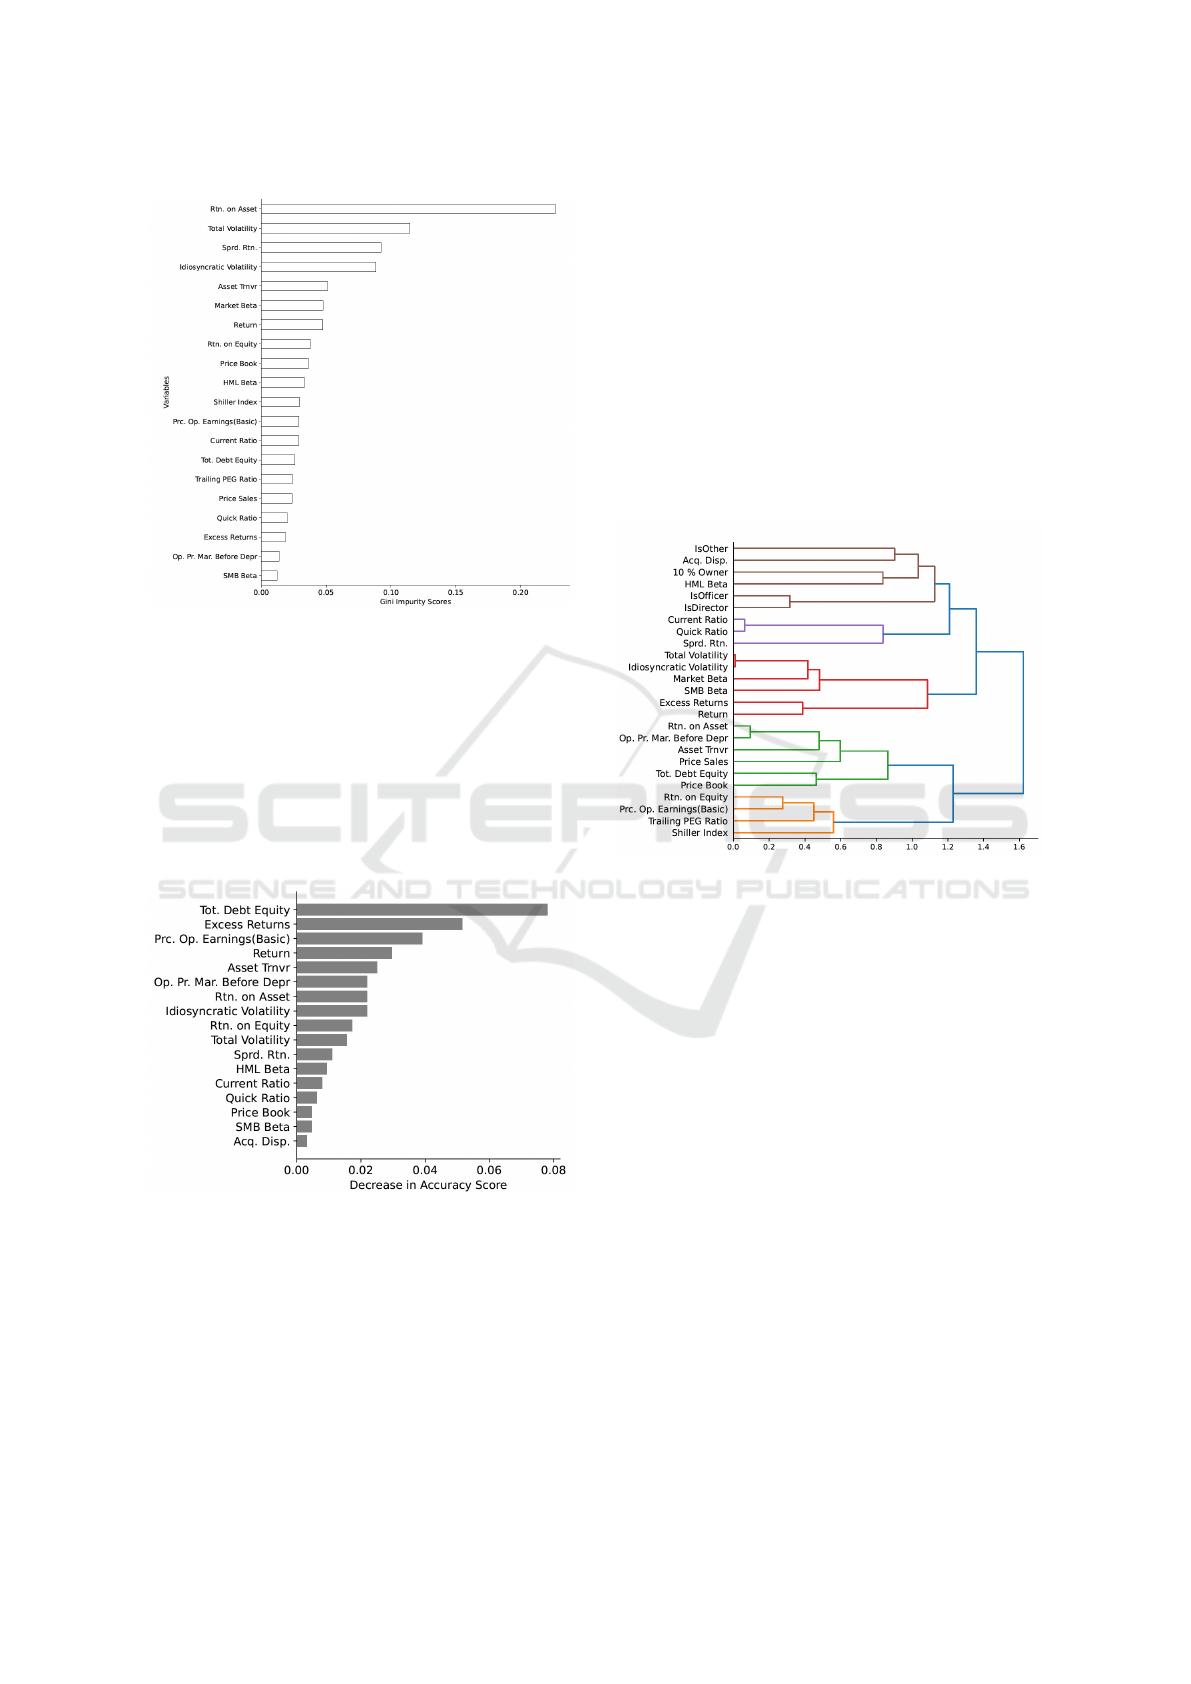
Figure 1: Ranking of the importance of features based on
Mean Decrease in Impurity extracted during training phase
(see (Neupane and Griva, 2024) for details)
are common in financial datasets, potentially not gen-
eralizing well to test samples ((Meinshausen, 2008)).
Permutation importance is employed to address these
shortcomings. This model-agnostic method evalu-
ates feature contribution by measuring the decrease in
model performance when a feature’s values are ran-
domly permuted (Nembrini et al., 2018), and impor-
tantly, can be applied to test data, unlike MDI.
Figure 2: Ranking of the importance of features based on
Permutation Importance (see (Neupane and Griva, 2024) for
details).
However, a visual comparison of Figure 1 and Fig-
ure 2 reveals notable differences in the top-ranked
features and their relative importance. While MDI
tends to rank profitability and volatility-related fea-
tures highly (e.g., Return on Asset, Total Volatility),
Permutation Importance before decorrelation ranks
features such as Total Debt to Equity, Excess Re-
turns, and Price Operating Earnings (Basic) as most
important. This discrepancy, highlights that Permuta-
tion Importance is also significantly affected by cor-
relation when applied to correlated data. In highly
correlated datasets, permuting one feature might not
significantly decrease performance if a highly corre-
lated feature provides redundant information to the
model. Consequently, neither the MDI ranking nor
the Permutation Importance ranking before decorre-
lation provides a fully reliable measure of true feature
importance in this highly correlated financial dataset.
This underscores the importance of applying permu-
tation importance after decorrelation for a more accu-
rate assessment.
Figure 3: Hierarchical clustering of features using Spear-
man rank-order correlations visualized by this dendrogram,
showing the relationships and grouping of features based on
similarity.
To mitigate the impact of correlation on feature
ranking, hierarchical clustering was performed based
on Spearman rank correlation, using Ward’s mini-
mum variance linkage and a distance matrix derived
from the correlation matrix. This process is visual-
ized in Figure 3, which shows the resulting dendro-
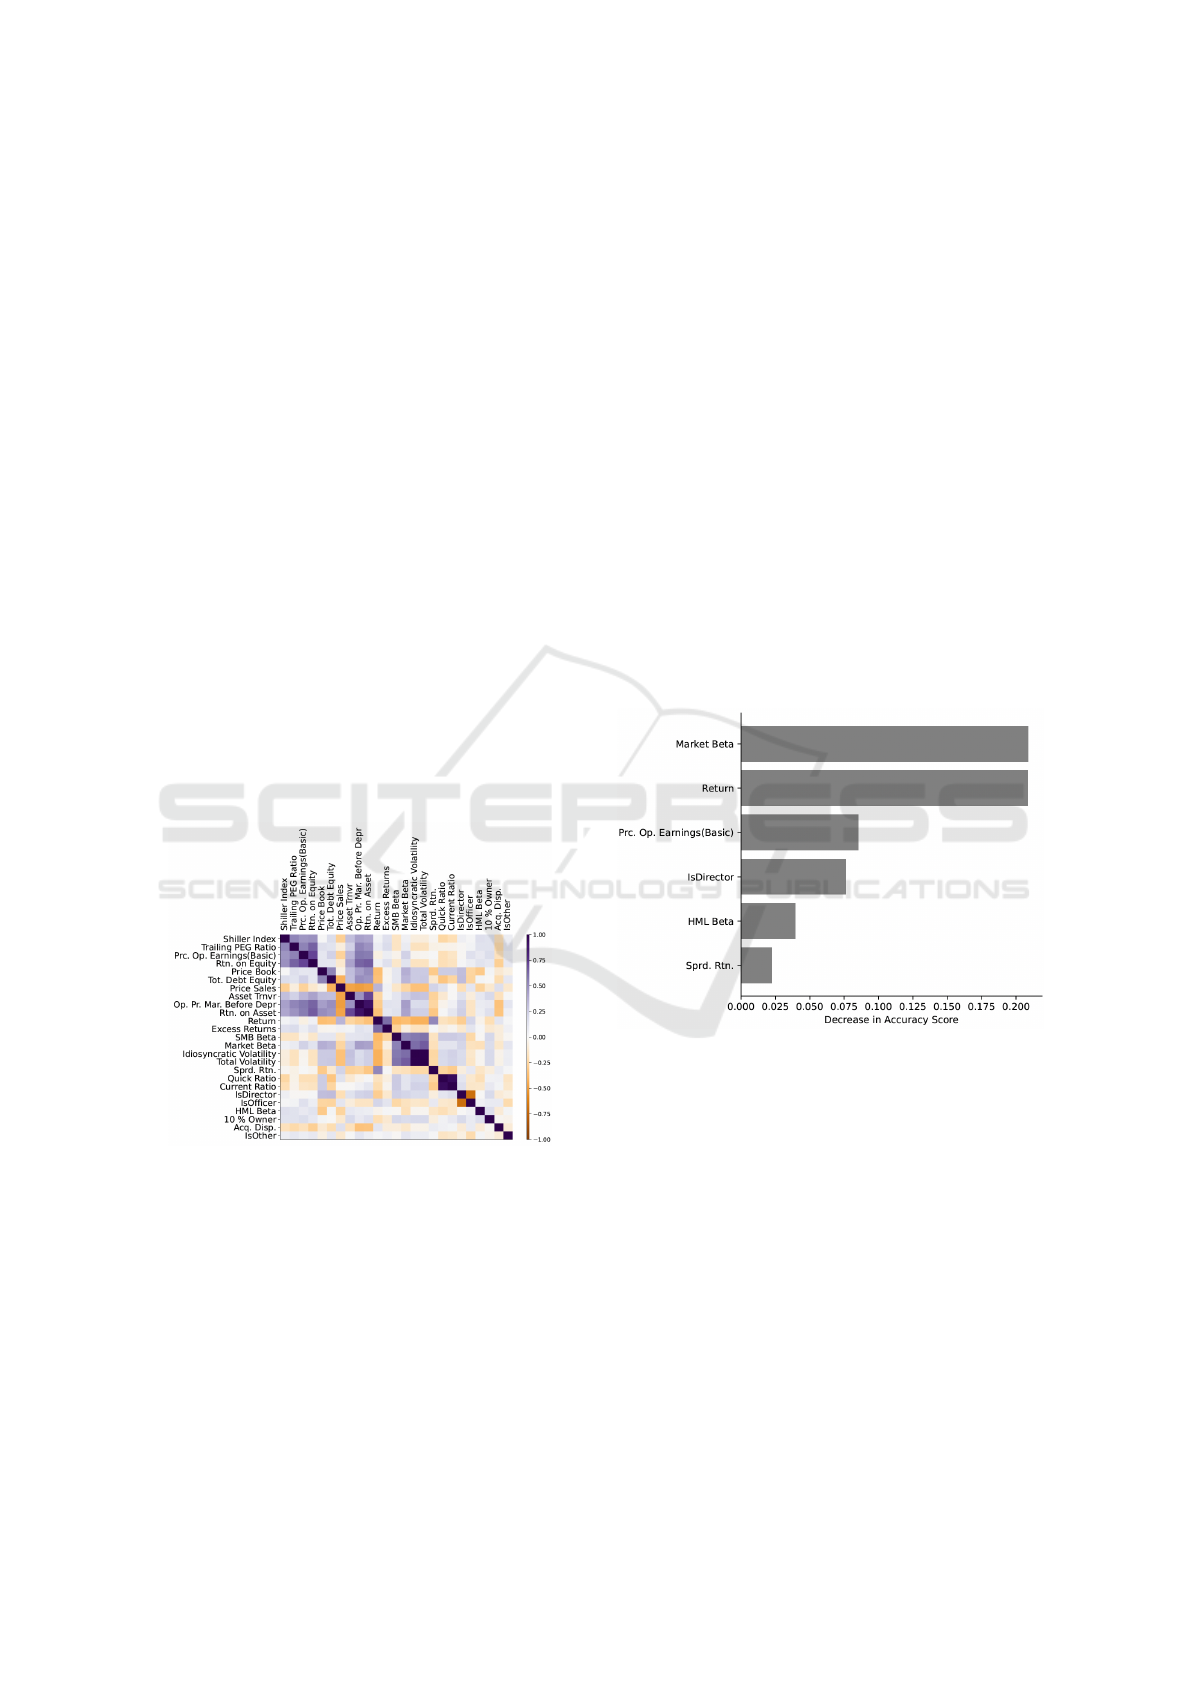
gram and Figure 4, which displays the correlation ma-
trix as a heatmap. In the heatmap (Figure 4), features
are arranged along both axes, and the color intensity
of each cell indicates the strength of the correlation
between the corresponding features, with darker col-
ors representing stronger positive or negative correla-
tions; the diagonal shows perfect correlation of each
feature with itself. The dendrogram (Figure 3) illus-
trates the hierarchical clustering results; the vertical
branches show how features are merged into clus-
ters based on their distance (indicated on the hori-
zontal axis), with shorter branches connecting more
similar features. Features grouped by branches form
clades. For instance, Price Earnings (basic) and Re-
turn on Equity form a clade, connected together with
An Extreme Gradient Boosting (XGBoost) Trees Approach to Detect and Identify Unlawful Insider Trading (UIT) Transactions
177
the Trailing PEG Ratio, forming the leftmost clade.
A representative feature was then selected from each
cluster based on these relationships.
Figure 5 illustrate the impact of correlation re-
moval on feature ranking. Figure 2 shows the ranking
obtained using Permutation Importance before decor-
relation, while Figure 5 displays the ranking after hi-
erarchical clustering and representative feature selec-
tion. The ranking in Figure 5 highlights the promi-
nence of features related to market risk, corporate
governance, and valuation. Prominent features in-
clude Market β, Return, Price Operating Earnings
(Basic), and IsDirector. Compared to the ranking be-
fore decorrelation (Figure 2), the analysis after decor-
relation emphasizes features such as Market β and Is-
Director, which hold higher ranks. Price Operating
Earnings (Basic) also appears more influential after
decorrelation, consistent with its role as an important
gauge for company valuation. The high ranking of
IsDirector indicates the importance of a role on the
company’s board in influencing UIT. The importance
of market β and value premium features (like HML
β) in this decorrelated context aligns with financial
theories, particularly considering the potential insti-
tutional influence of executives on policies (e.g., divi-
dend policy, (Campbell and Shiller, 1988), (Grinblatt
et al., 1984)).
Figure 4: Spearman Rank-Order Correlation Matrix for Se-
lected Features (Illustrative), visualizing pairwise correla-
tions to aid in identifying groups. In the color gradient, dark
purple represents (perfect positive correlation), and dark or-
ange represents (perfect negative correlation).
A comparative assessment of feature importance
rankings from MDI (Figure 1), Permutation Impor-
tance before decorrelation (Figure 2), and Permuta-
tion Importance after decorrelation (Figure 5) reveals
significant differences across the three approaches.
While MDI and Permutation Importance applied be-
fore decorrelation produce differing rankings across
the full feature set, both methods are substantially af-
fected by the presence of highly correlated features
common in financial data, leading to potentially mis-
leading importance scores. In contrast, the Permu-
tation Importance ranking after hierarchical cluster-
ing and representative feature selection (Figure 5)
shows a distinct set of prominent features and gen-
erally higher importance scores for a subset of repre-
sentatives. Following decorrelation, features such as
Market β, Return, Price Operating Earnings (Basic),
and IsDirector emerge as highly influential in Figure
5. Results are consistent with previous studies; the top
features contributing most to the prediction of unlaw-
ful activities are related to ownership, influence, and
market risk, indicating that daily activities in the capi-
tal market play an important role in determining UIT.
The disparity among the three rankings underscores
the profound impact of correlation on feature impor-
tance measures and highlights why the ranking ob-
tained after decorrelation (Figure 5) provides a more
reliable understanding of true feature contributions by
mitigating the masking effects of correlation.
Figure 5: Ranking of feature importance based on permuta-
tion values after removal of correlation due to hierarchical
clustering. The horizontal axis is the scaled value of rela-
tive importance. The vertical axis represents the variables.
The bars are organized in descending order of the relative
importance.
In summary, the overall results of the supervised
classifier, presented in Table 4, demonstrate strong
performance. To note, the classifier demonstrated a
consistent performance with high true positive and
negatives as well as a low false positive rate (fall out
rate). This is crucial, as wrongfully classifying an un-
lawful transaction as lawful is anecdotally equivalent
to a courtroom acquittal. The obtained false positive
rates, as shown in Table 4, compare favorably against
benchmark methods presented in Table 3, showing the
model successfully minimizes false alarms. Further-
more, XGBoost demonstrates a thorough examina-
DATA 2025 - 14th International Conference on Data Science, Technology and Applications
178

tion of information, leading to low false negative rates
(miss rate), as evident in Table 4. Just as an incorrect
incarceration has high stakes, misclassifying a lawful
transaction as unlawful is critical. The results indicate
XGBoost does not disregard or overlook hidden infor-
mation, resulting in low missing rates. In addition to
controlling false classifications, the proposed method
produces strong true positive results, correctly identi-
fying lawful transactions. The high ratio of true nega-
tive to negative further confirms the model’s ability to
correctly identify unlawful transactions as unlawful.
XGBoost effectively handles both lawful and unlaw-
ful transactions across different scenarios, even when
the unlawful transactions are unchanged and lawful
ones are randomly sampled (50 percent). The sim-
ple parameter tuning method proved to be an effec-
tive strategy for achieving high accuracy. Finally, the
analysis indicates that decorrelation is impactful; by
decorrelating, corporate and institutional features like
IsDirector gained prominence in the ranking, appear-
ing alongside key trade and finance features (Sigrist,
2023), (Meinshausen, 2008).
5 CONCLUSIONS AND FUTURE
WORK
In a high-dimensional feature space approach shows
an excellent performance to detect the UIT with ac-
curacy over 97 percent. The reliability of the re-
sults is assured by averaging them from 5-fold cross-
validation. The experiments run 100 times with a new
set of lawful transactions randomly sampled from a
pool of 9.6 millions. Overall, comparing the imple-
mented XGBoost results (Table 4) with Random For-
est results (Table 5 of (Neupane and Griva, 2024)) and
the benchmark methods (Table 3), the implemented
XGBoost method demonstrates high performance for
UIT detection, comparing favorably against the other
methods, notably achieving higher overall accuracy
and remarkably lower false negative rates. Besides,
the results demonstrate that XGBoost provides the
ranking of the features that play the most important
role in identification of the UIT. Those features re-
lated to governance, financial and trading can be ma-
nipulated by the corporate insiders for personal un-
lawful financial gains and naturally contribute to un-
covering fraudulent behaviors. Therefore, the appli-
cation of the advanced supervised machine learning
techniques may have significant practical impact on
automated detection of the UIT.
For the future, the credibility of the detection of
UIT can be improved with the help of causality anal-
ysis. (Athey, 2019) emphasizes decision trees are
the most relevant machine learning techniques to ex-
tract underlying causality. As a domain agnostic, an
effective decision trees method designed to handle
large datasets, XGBoost is a promising candidate for
the future explorations. Exploring XGBoost-causality
nexus therefore may provide a high-stake end-to-end
utility and transparency to the SEC’s overall pro-
cess related to the detection of insider trading. Re-
searchers, further, can contribute by studying the re-
lationship between classification-causality. Besides,
tying features to an economic, a financial and/or an
institutional theory reduces the uncertainty and inex-
plainability of models (Harvey et al., 2016). There-
fore, implementing decision tree methods to explain
the tenets of UIT within the realm of the economic
and/or financial theories that includes features ana-
lyzed in this research (25 or 110) or 447 as proposed
by (Hou et al., 2020) is a valuable future direction.
In addition, during the experiments the random grid-
search of the hyper-parameters with a preset of the
lower and upper-bound was implemented that which
may potentially warrant resource waste with grow-
ing features space. In the future, by exposing and
comparing results from the alternative parameter opti-
mization techniques, such as, Bayesian Optimization,
Grid Search, Evolutionary and so on is another av-
enue to follow. Further, apart from the one-hot en-
coding method applied to encode categorical features,
meaningful insights can be extracted by exploiting the
existing relationships with application of more ad-
vanced methods (e.g, target embedding) (Rodr
´
ıguez
et al., 2018) which remains unexplored in the context
of UIT to the best of current knowledge.
REFERENCES
Amihud, Y. and Mendelson, H. (1987). Trading mecha-
nisms and stock returns: An empirical investigation.
The Journal of Finance, 42.
Anderson, H. M. (2007). New introduction to multiple time
series analysis. Economic Record, 83(260):109–110.
Armstrong, C. S., Balakrishnan, K., and Cohen, D. (2012).
Corporate governance and the information environ-
ment: Evidence from state antitakeover laws. Journal
of Accounting and Economics, 53.
Athey, S. (2019). The Impact of Machine Learning on Eco-
nomics. In The Economics of Artificial Intelligence:
An Agenda. University of Chicago Press.
Bainbridge, S. M. (2022). Manne on insider trading.
Box, G. E. P., Jenkins, G. M., and MacGregor, J. F. (1972).
Some Recent Advances in Forecasting and Control.
Part II.
Camerer, C. F. (2019). Artificial Intelligence and Behav-
ioral Economics. In The Economics of Artificial Intel-
ligence: An Agenda. University of Chicago Press.
An Extreme Gradient Boosting (XGBoost) Trees Approach to Detect and Identify Unlawful Insider Trading (UIT) Transactions
179

Campbell, J. Y. and Shiller, R. J. (1988). The dividend-
price ratio and expectations of future dividends and
discount factors. The Review of financial studies,
1(3):195–228.
Cao, C., Field, L. C., and Hanka, G. (2004). Does insider
trading impair market liquidity? evidence from ipo
lockup expirations. Journal of Financial and Quanti-
tative Analysis, 39(1):25–46.
Chen, T. and Guestrin, C. (2016). Xgboost: A scalable
tree boosting system. In Proceedings of the 22nd acm
sigkdd international conference on knowledge discov-
ery and data mining, pages 785–794.
Cohen, L., Malloy, C., and Pomorski, L. (2012). Decoding
inside information. Journal of Finance, 67.
Cumming, D., Johan, S., and Li, D. (2011). Exchange trad-
ing rules and stock market liquidity. Journal of finan-
cial economics, 99(3):651–671.
Deng, S., Wang, C., Fu, Z., et al. (2021). An intelligent
system for insider trading identification in chinese se-
curity market. Computational economics, 57(2):593–
616.
Deng, S., Wang, C., Li, J., et al. (2019). Identification of
insider trading using extreme gradient boosting and
multi-objective optimization. Information (Basel),
10(12):367–.
Easley, D., Kiefer, N. M., O’Hara, M., et al. (1996). Liquid-
ity, information, and infrequently traded stocks. The
Journal of Finance, 51.
Fishman, M. J. and Hagerty, K. M. (1995). The mandatory
disclosure of trades and market liquidity. The Review
of financial studies, 8(3):637–676.
Fudenberg, D. and Liang, A. (2019). Predicting and under-
standing initial play. The American economic review,
109(12):4112–4141.
Gangopadhyay, P. and Yook, K. (2022). Profits to oppor-
tunistic insider trading before and after the dodd-frank
act of 2010. Journal of Financial Regulation and
Compliance, 30.
Ge, X. and Smyth, P. (2000). Deformable markov model
templates for time-series pattern matching. In Pro-
ceedings of the sixth ACM SIGKDD international con-
ference on knowledge discovery and data mining, Kdd
’00, pages 81–90. Acm.
Gelman, A. (2008). Scaling regression inputs by dividing
by two standard deviations. Statistics in medicine,
27(15):2865–2873.
Goldberg, H. G., Kirkland, J. D., Lee, D., et al. (2003). The
nasd securities observation, new analysis and regula-
tion system (sonar). In Iaai, pages 11–18. Citeseer.
Grinblatt, M. S., Masulis, R. W., and Titman, S. (1984). The
valuation effects of stock splits and stock dividends.
Journal of financial economics, 13(4):461–490.
Hamilton, J. D. (1989). A new approach to the economic
analysis of nonstationary time series and the business
cycle. Econometrica, 57(2):357–384.
Hand, D. J. (2009). Forecasting with exponential smooth-
ing: The state space approach by rob j. hyndman, anne
b. koehler, j. keith ord, ralph d. snyder. International
Statistical Review, 77(2):315–316.
Harvey, C. R., Liu, Y., and Zhu, H. (2016). . . . and the
cross-section of expected returns. The Review of Fi-
nancial Studies, 29(1):5–68.
Hou, K., Xue, C., and Zhang, L. (2020). Replicat-
ing anomalies. The Review of financial studies,
33(5):2019–2133.
Huddart, S. J. and Ke, B. (2007). Information asymmetry
and cross-sectional variation in insider trading. Con-
temporary accounting research, 24(1):195–232.
Iskhakov, F., Rust, J., and Schjerning, B. (2020). Machine
learning and structural econometrics: contrasts and
synergies. The econometrics journal, 23(3):S81–s124.
Islam, S. R., Khaled Ghafoor, S., and Eberle, W. (2018).
Mining illegal insider trading of stocks: A proactive
approach. In 2018 IEEE International Conference on
Big Data (Big Data), pages 1397–1406, Ithaca. Ieee.
Jacobs, H. and Weber, M. (2015). On the determinants of
pairs trading profitability. Journal of financial mar-
kets, 23:75–97.
John, K. and Narayanan, R. (1997). Market manipulation
and the role of insider trading regulations. The Journal
of business (Chicago, Ill.), 70(2):217–247.
Kyle, A. S. (1985). Continuous auctions and insider trading.
Econometrica, 53.
Leamer, E. E. (1978). Specification searches: Ad hoc infer-
ence with nonexperimental data. (No Title).
Li, G., Li, Z., Wang, Z., et al. (2022). Identification of
insider trading in the securities market based on multi-
task deep neural network. Computational intelligence
and neuroscience, 2022:4874516–9.
Lin, J.-C. and Howe, J. S. (1990). Insider trading in the otc
market. Journal of Finance, 45(4):1273–84.
Louzada, F. and Ara, A. (2012). Bagging k-dependence
probabilistic networks: An alternative powerful fraud
detection tool. Expert Systems with Applications,
39(14):11583–11592.
Malhotra, A. (2021). A hybrid econometric–machine learn-
ing approach for relative importance analysis: pri-
oritizing food policy. Eurasian economic review,
11(3):549–581.
Manne, H. G. (1966). Insider trading and the stock market.
Free Press.
Mayo, D. G. and Hand, D. (2022). Statistical significance
and its critics: practicing damaging science, or dam-
aging scientific practice? Synthese, 200(3):220.
Meinshausen, N. (2008). Hierarchical testing of variable
importance. Biometrika, 95(2):265–278.
Mushava, J. and Murray, M. (2022). A novel xgboost exten-
sion for credit scoring class-imbalanced data combin-
ing a generalized extreme value link and a modified
focal loss function. Expert Systems with Applications,
202:117233.
Nembrini, S., K
¨
onig, I. R., and Wright, M. N. (2018).
The revival of the Gini importance? Bioinformatics,
34(21):3711–3718.
Neupane, K. and Griva, I. (2024). A random forest approach
to detect and identify unlawful insider trading. arXiv
preprint arXiv:2411.13564.
DATA 2025 - 14th International Conference on Data Science, Technology and Applications
180

Pagano, M. and R”oell, A. (1996). Transparency and liquid-
ity: a comparison of auction and dealer markets with
informed trading. The Journal of Finance, 51(2):579–
611.
Rabiner, L. and Juang, B. (1986). An introduction to hidden
markov models. IEEE ASSP magazine, 3(1):4–16.
Rizvi, B., Attew, D., and Farid, M. (2022). Unsupervised
manipulation detection scheme for insider trading. In
International Conference on Intelligent Systems De-
sign and Applications, pages 244–257. Springer.
Rodr
´
ıguez, P., Bautista, M. A., Gonzalez, J., and Escalera,
S. (2018). Beyond one-hot encoding: Lower dimen-
sional target embedding. Image and Vision Comput-
ing, 75:21–31.
Rozeff, M. S. and Zaman, M. A. (1988). Market efficiency
and insider trading: New evidence. Journal of Busi-
ness, pages 25–44.
Sang, X., Xiao, W., Zheng, H., Yang, Y., and Liu, T. (2020).
Hmmpred: Accurate prediction of dna-binding pro-
teins based on hmm profiles and xgboost feature se-
lection. Computational and mathematical methods in
medicine, 2020(1):1384749.
Seth, T. and Chaudhary, V. (2020). A predictive analyt-
ics framework for insider trading events. In 2020
IEEE international conference on big data (Big Data),
pages 218–225. Ieee.
Seyhun, H. (1986). Insiders’ profits, costs of trading, and
market efficiency. Journal of financial economics,
16(2):189–212.
Sigrist, F. (2023). A comparison of machine learning meth-
ods for data with high-cardinality categorical vari-
ables. arXiv preprint arXiv:2307.02071.
Sundarkumar, G. G. and Ravi, V. (2015). A novel hybrid un-
dersampling method for mining unbalanced datasets
in banking and insurance. Engineering Applications
of Artificial Intelligence, 37:368–377.
Varol, O., Ferrara, E., Davis, C. A., Menczer, F., and
Flammini, A. (2017). Online human-bot interactions:
Detection, estimation, and characterization. CoRR,
abs/1703.03107.
Wang, K., Li, M., Cheng, J., Zhou, X., and Li, G. (2022a).
Research on personal credit risk evaluation based on
xgboost. Procedia computer science, 199:1128–1135.
Wang, S., Peng, H., Hu, Q., and Jiang, M. (2022b). Anal-
ysis of runoff generation driving factors based on hy-
drological model and interpretable machine learning
method. Journal of Hydrology: Regional Studies,
42:101139.
Zhang, Y., Tong, J., Wang, Z., and Gao, F. (2020). Customer
transaction fraud detection using xgboost model. In
2020 International Conference on Computer Engi-
neering and Application (ICCEA), pages 554–558.
IEEE.
An Extreme Gradient Boosting (XGBoost) Trees Approach to Detect and Identify Unlawful Insider Trading (UIT) Transactions
181
