
Brain Tumor Detection of MRI Images Using CNN Implemented on
VGG16 Based Architecture
Chudaman Sukte, Tarun Tiwari, Gautam Nimase and Sandesh Mahajan
Dept. Information Technology Vishwakarma Institute of Information Technology Pune, India
Keywords: Brain Tumor Detection, MRI, CNNs, VGG16 Architecture, Transfer Learning.
Abstract: From a medical perspective, brain cancer can be considered one of the most lethal diseases due to the damage
to major blood vessels and the increased risk of death. Therefore, early and accurate diagnosis is important
for the best treatment of the disease. In this paper, we describe a new method for automatic problem detection
based on the VGG16 neural network, which recognizes the deep structure and good image distribution. Our
model involves the enhancement of MRI scan images and then the classification of images into tumor and
non-tumor using transformations with VGG16. We build models that achieve satisfactory accuracy,
sensitivity and specificity using large-scale MRI images and their annotations. Our results show that the
VGG16 mathematical model can assist radiologists in brain diagnosis and make brain diagnosis more efficient
and reliable. Additionally, we provide an overview of the possibilities of deep learning in modern medicine
and the prospects for the development of medical imaging.
1 INTRODUCTION
Many patients around the world are going through an
end-of-plan analysis that glaringly affects survival
costs.
Brain tumors are life-threatening and cause
globally unique neurological problems with a high
mortality rate. Early will is critical to convincing
treatment and advanced survival fees. MRI is the
standard non-invasive strategy used to distinguish
brain tumors, advertising and marketing stupid and
crude images of mind tissue. In any case, post-
examination of MRI filters is time-consuming and
prone to human error, especially for large data sets or
subtle abnormalities. Millions of mind tumor
sufferers regularly face delayed willpower due to the
need for assets or radiologists, especially in
underserved areas such as provincial parts of Asia
[(Siar, and Mohammad 2019).
The early end is huge because appropriate
treatment increases overall survival costs and
improves knowledge outcomes. Orientation
examination of the appearance of MRI, which is a
modern general strategy for the detection of brain
tumors, is unfortunately not lengthy, but is also prone
to human error, especially when there is a large
amount of information, or inconspicuous anomalies
that lend themselves to being ignored. This occurs
around a delayed or incorrect examination, which can
extremely affect the quality of care and prognosis
(Siar, and Mohammad 2019), (Deshmukh, and
Bendre 2024).
Our goal is to create a proficient mind tumor
discovery machine utilizing VGG16 deep mastering
reveal to return appropriate determination.
Our proposed framework, built on VGG16
engineering and using business knowledge, considers
handling these challenging situations by mechanizing
the discovery of brain tumors in MRI filters. The
intention of the program is to catch really the smallest
and most inconspicuous tumors and ensure that no
key element is missed. By joint mechanization, we
reduce the burden on radiologists, speed up
demonstrative processing and increase the accuracy
of symptoms. This framework will turn out to be
particularly important in places with limited access to
filling specialists, bridging the hole in healthcare
administration and saving lives with timely and
accurate mind tumors.Utilizing the advanced and
profound tactics that VGG16 encompasses, we point
out the creation of a robotic, remedial, and accessible
framework for mind tumor location. This gadget will
assist healthcare professionals in faster and
remarkably more accurate examinations, ultimately
improving chronic outcomes and taking care of the
Sukte, C., Tiwari, T., Nimase, G. and Mahajan, S.
Brain Tumor Detection of MRI Images Using CNN Implemented on VGG16 Based Architecture.
DOI: 10.5220/0013633900004664
Paper published under CC license (CC BY-NC-ND 4.0)
In Proceedings of the 3rd Inter national Conference on Futuristic Technology (INCOFT 2025) - Volume 3, pages 627-635
ISBN: 978-989-758-763-4
Proceedings Copyright © 2025 by SCITEPRESS – Science and Technology Publications, Lda.
627

global health hole (Ramprakash et al. 2024),
(Rehman, Amjad, et al. 2023).
Our aim is to make brain tumor localization faster,
more robust and manageable for everyone, regardless
of geological or financial constraints, thereby
contributing to higher survival fee and much higher
knowledge outcomes across the sector.
This project will contribute to the research and
society in a remarkable way:
1. Advances in Therapeutic Imaging: By
engineering VGG16 and acquiring
alternative knowledge, it includes expansion
into the evolving framework of deep study
techniques for therapeutic imaging,
particularly brain tumor discovery. It
explores how pre-trained models can be best
tuned for specialized tasks, pushing the
boundaries of existing strategies in radiology
and AI-assisted prognostication.
2. Advances in demonstrative accuracy: Our
images highlight how thorough mastery can
distinguish subtle deviations from the norm
in MRI filters, likely bypassing traditional
guided investigations. This will open up a
modern exploration of approximately paths
in growing larger contemporary models that
could deal with complicated healing photos.
3. Benchmarking and replicability: By sharing
and approximately derived techniques, we
provide a gadget that can help improve fate
analysts, cultivate collaboration and progress
within the subject of automated recovery
diagnostics.
This paper is prepared as follows: phase II affords
the literature overview and associated works in mind
tumor detection using deep learning. segment III
describes the methodology & the VGG16 model
utilized in our study. segment IV discusses the results
received from the experimental assessment, even as
phase V interprets the findings and highlights key
insights. In the end, phase VI concludes the paper
with a precise capability for future paintings (Preetha,
Jasmine et al. 2024).
2 LITERATURE SURVEY
Table 1: Literature survey
Author(
s)
Focus of
the Paper
Key Points
in
Covera
g
e
Methodology(s)
Used
Al-
Ayyoub
et al
Machine
Learning
for Brain
Tumour
Detection
Comparing
the
performanc
e of
different
machine
learning
algorithms
for brain
tumour
detection
using MRI
ima
g
es.
Image
Processing:
Conversion of
RGB images to
greyscale.
Machine
Learning
Algorithms:
ANN, Tree J48,
Naive Bayes,
and LazyIBk.
Hemant
h et al.
Brain
Tumour
Detection
using
Machine
Learning
Proposing
a brain
tumour
detection
system
using
machine
learnin
g
.
The specific
machine
learning
approach used
is not specified.
Shishir
et al
Brain
Tumour
Detection
using
CNN
Using
Convolutio
nal Neural
Networks
(CNN) for
brain
tumour
detection.
Convolutional
Neural
Networks
(CNN)
Nandpu
ru et al
MRI Brain
Cancer
Classificati
on
Classifying
brain
cancers
from MRI
data.
Support Vector
Machine
(SVM)
Chandr
a &
Kolasan
i
Brain
Tumour
Detection
Detecting
brain
tumours.
Genetic
Algorithm
Varuna
Shree
&
T.N.R.
Kuma
Brain
Tumor
MRI
Image
Identificati
on and
Classificati
on
Identifying
and
classifying
brain
tumour
MRI
images
using
feature
extraction.
Discrete
Wavelet
Transform
(DWT)Probabil
istic Neural
Network
Younis
et al
Brain
Tumour
Analysis
Analysing
brain
tumours.
Deep Learning
Irmak Brain
Tumour
MRI
Image
Multi-
classificati
on
Multi-class
classificati
on of brain
tumour
MRI
images.
Deep
Convolutional
Neural Network
Jia &
Chen
Brain
Tumour
Identifying
and
Deep Learning
INCOFT 2025 - International Conference on Futuristic Technology
628

Identificati
on and
Classificati
on
classifying
brain
tumours
from MRI
images.
Byale
et al.
Brain
Tumour
Segmentati
on and
Classificati
on
Automatic
segmentati
on and
classificati
on of brain
tumours.
Machine
Learning
Alquda
h et al
Brain
Tumour
Classificati
on
Technique
s
Comparing
different
brain
tumour
classificati
on
techniques.
Deep Learning
Amin et
al
Brain
Tumour
Detection
and
Classificati
on
Surveying
methods
for brain
tumour
detection
and
classificati
on.
Machine
Learning
The subject of brain tumour detection and
classification using MRI images has benefited greatly
from recent developments in machine learning (ML).
Al-Ayyoub et al. investigate a number of machine
learning techniques, such as Artificial Neural
Networks (ANN), Decision Trees (J48), Naive
Bayes, and LazyIBk. They show that once MRI data
are converted to greyscale format, the performance of
various algorithms can differ for cancer identification
tasks. Despite without naming the exact approach,
Hemanth et al. offer a broad ML-based detection
framework. Shishir et al. demonstrate the efficacy of
deep learning models in managing intricate image-
based tasks by using Convolutional Neural Networks
(CNN) specifically to MRI images for more complex
models Lin, et al. 2023), (Liu, et al. 2024).
3 METHODOLOGY
3.1 Dataset Collection
In our study, we used the brain tumor MRI image
dataset from Kaggle, which contains 3064 MRI
images containing one of the 17 unique features that
define brain tumors. The image is then converted to
224 x 224 pixels, which is required to enter the
VGG16 standard. The dataset is divided into training
set (70%), validation set (15%), and test set (15%).
Figure 1: Methodology
3.2 Data Augmentation
RandomHorizontalFlip(p=0.5):which behaves
the same as above horizontally flipping with 50%
probability i.e., augments model to generalize against
flipped objects also but meantime we wanted our
model to recognize the view irrespective of its
position and hence there was no need of rotation.
RandomVerticalFlip(p=0.5): It will randomly
paste Image vertically with 50% Acknowledgment
and Will help to add more diversity into the dataset
RandomRotation(degrees=15) : Application of
this performs a random rotation to our image with an
angle within 15 degrees which can sometimes be
helpful in minor rotations and real-world distortions
of an image.
ColorJitter(brightness=0.2, contrast=0.2):
randomly change the brightness and contrast of the
image to simulate lighting effects
RandomResizedCrop(size=(224, 224),
scale=(0.8, 1.0)): This will randomly crop image to
the specified dimension then resize it to that size but
keep the whole area from the original image in which
it was cropped at least scaled by 80% and scaled up
to 100%.
ToTensor(): This will convert the image into a
tensor that your model can take as an input.
Normalize(mean=[0.485, 0.456, 0.406],
std=[0.229, 0.224, 0.225]): Normalize an image to
the mean and standard deviation specified by
ImageNet-trained models
This augmentation helps the model to learn more
complex images in order to gain high accuracy for
over 17 classes .
3.3 Model Architecture
The convolutional neural network model originating
from the brain detection VGG16 framework has 5
Brain Tumor Detection of MRI Images Using CNN Implemented on VGG16 Based Architecture
629
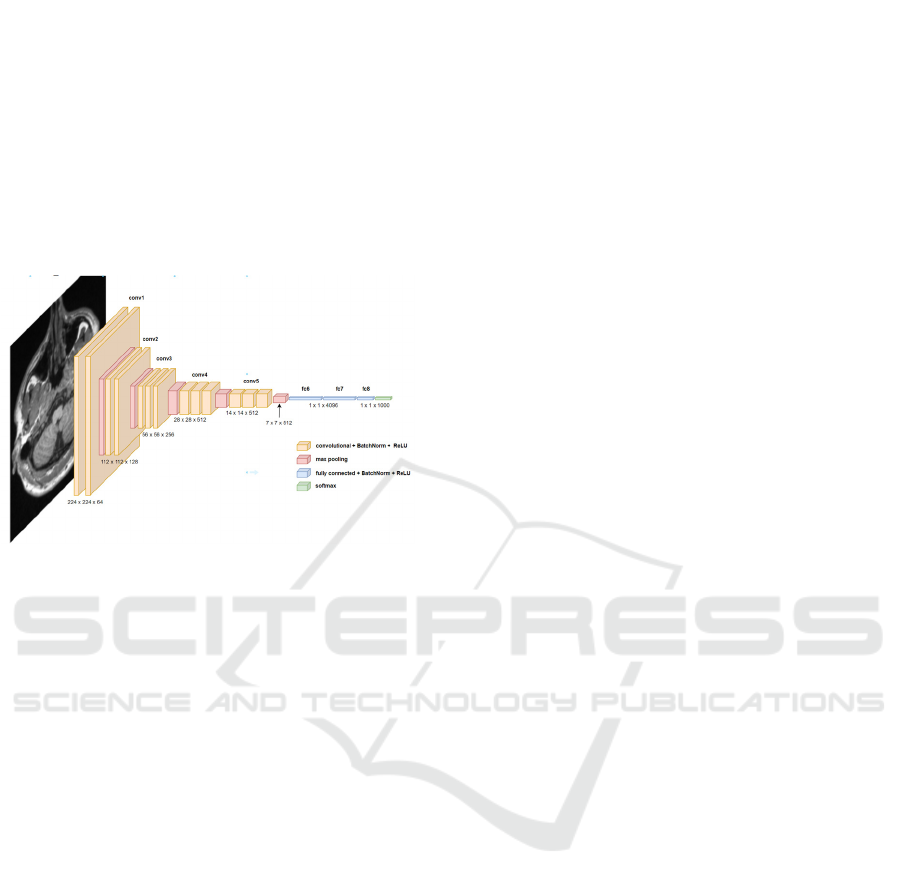
groups, each group has a series of convolutional
processes, and the most common process is used for
subtraction after batch normalization. The number of
filters in the first block is as many as 64, and the filters
in the deep blocks are 512, which can detect low and
high levels. This model is separated by three
connections of all layers, and then RELU activation
and batch recovery. The urine process to distribute the
MRI section as much as possible.
Clearly! The following is an explanation of each
layer in the VGG16-based model and how it fits into
the steps of brain tumor detection and classification;
Figure 2: Model Architecture
3.3.1 Layer descriptions
1.Convolution layer: (feature extraction)
nn.Conv2d layers : The current layer extracts
features from the input image by creating a set of
filters on it. These filters look for specific local
patterns such as edges, textures, and other simple
image elements. As we move through the network,
these filters learn to pick up more sophisticated
patterns, such as features that are specific to tumors.
nn. BatchNorm2d: Normalization for each batch
after convolution. It normalizes its performance so
that the next layer has more stable values, which helps
with faster training and resistance to weight
initialization.
Activation function (F.relu): ReLU is a building
block = applied between each pair of convolutions. It
introduces non-linearity, making the network model
complex functions.
2. Pooling layers (reducing dimensions)
nn. MaxPool2d layers: Max Pool2d layers
reduce the spatial dimensions of feature maps, reduce
computation, and focus on critical features. This
increases performance by making the model
computationally efficient and avoids overfitting and
suppression of less important details.
3.Classification — Fully connected layers:
nn. Flatten Layer : Merges the output of the last
convolution block so that it is fed into fully connected
layers.
nn. Linear layers: These layers are the classifier.
They take the features learned by the convolutional
layers and map them to the output classes, which in
this case, are the different kinds of brain tumor. The
first two fully connected layers, that is, the fc1 and
fc2, help the model learn complex patterns &
combine the different features. Finally, the features
are mapped to the output classes with the last fully
connected layer, fc3.
nn. BatchNorm1d layers: for fully connected
layers that stabilize and accelerate learning with batch
normalization
4. Output layer:
The final output layer (the attention layer) predicts
the label relative to the brain tumor class. Additional
probabilities can be derived based on the outputs by
using them depending on the loss function that was
used during training (e.g. CrossEntropyLoss).
Role Summary:
Feature extraction (Conv2d + ReLU +
BatchNorm2d): Convolutional operations capture a
hierarchy of spatial features starting from edges and
finally capture tumor-centered features.
Dimensional reduction (MaxPool2d):
Maximum pool layers gradually reduce dimensions,
which helps the network to be more compact in terms
of depth, and also helps to keep only the necessary
components.
Classification (Flatten + Linear +
BatchNorm1d): These are computational
components involved in deriving associations
between classes mapped by brain tumors and features
obtained from convolutional layers.
The above feature extraction followed by
classification was constructed for brain tumor
detection and classification using the VGG16 feature
representation(Neamah, Karrar, et al. 2023)
5. Loss and optimizer:
When constructing the display, we don't forget the
truth that CrossEntropyLoss() is the maximum
counseled misfortune work, for the reason that that is
a multi-magnificence classification demonstrated.
This misfortune is precious in deciding how remote
the expected yield is from the real taking a toll, and
this makes a distinction in the widespread mastering
of the version.
The optimizer applied for our show is
Adam(version.Parameters(),lr=zero.001,
weight_decay=1e-4, betas=(0.Nine, zero.999)):
INCOFT 2025 - International Conference on Futuristic Technology
630
lr (learning price=zero.001): Controls the step
measure at each cycle whilst shifting to the least
misfortune paintings. A little esteem like zero.001
makes the gaining knowledge extra solid.
Weight_decay=1e-four: An administrative term
that makes a distinction to avoid overfitting by
penalizing expansive weights.
Betas=(0.9, 0.999): Coefficients applied to
calculate the running midpoints of the slope and its
square:
beta1=zero.9: Rate of decrease for the first of all
moment (normal of gradients).
Beta2=0.999: Decay fee for the instant second
(uncentered fluctuation of gradients).
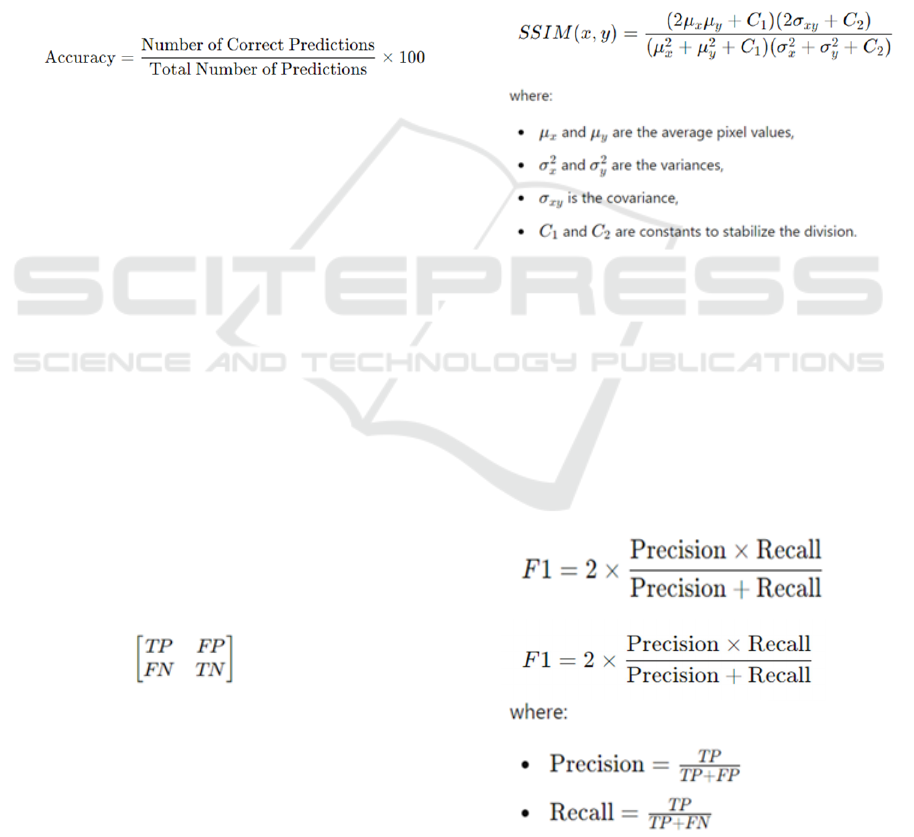
6.Performance Metrics:
Accuracy:
3.3.2 Mathematical definition
Description: Exactness measures the volume of
modified expectations made by means of the display
out of the upload as much as quantity of events. It is
a not unusual diploma of show execution, but may not
be pretty enlightening if the records set is choppy (e.g.
whilst one route is more go to than others) (Liu, Min,
et al. 2024).
3.3.3 Confusion Matrix
Description: The disarray network offers a nitty
gritty breakdown of display expectancies in
comparison to real names, appearing actual positives,
wrong positives, proper negatives, and unfaithful
negatives for each class.
The disarray network permits you to visualize
execution over various instructions of mind tumors,
creating a distinction to determine which sorts are
bewildered by using the exhibit. This can also lead to
changes in information series or exhibit structure
(Liu, et al. 2024).
3.3.4 Mathematical representation
True Positive (TP): Accurately anticipated high-
quality cases.
True Negative (TN): Accurately anticipated
terrible cases.
False fine (FP): Inaccurately expected nice
instances.
False bad (FN): Erroneously expected negative
instances.
3.3.5 Structural Closeness File (SSIM)
Description: SSIM assesses the likeness among
two photographs and offers a picture quality metric.
It takes brightness, differentiate and surface into
account.
SSIM may be applied to assess the exceptional of
the yield images produced by your show, in particular
in case you utilize photograph amplification methods.
It can provide assistance to decide whether or not the
show jam crucial fundamental factors of interest in
the pix.
3.3.6 F1 Score
Description: The F1 rating is a consonant cruel of
exactness and evaluation and gives a adjust among
the two
The F1 rating is in particular treasured in
restorative programs along with mind tumor class,
wherein wrong poor comes about may have proper
outcomes. A tall F1 score implies your show has a
brilliant modification between exactness and
evaluation over numerous instructions.
Brain Tumor Detection of MRI Images Using CNN Implemented on VGG16 Based Architecture
631
3.3.7 Calibration curve
Description: Calibration curves show how well
the predicted probability matches the correct results
and distinguish whether the demonstration is well
calibrated or not.
The calibration curve plots the predicted
probabilities as opposed to the distribution of positive
values (Pattanaik, Sudeshna, et al. 2024).
4 RESULTS AND DISCUSSION
The sequel is going to demonstrate the display design
that has been in the making for a hundred and fifty for
a long time, using the NVIDIA Tesla T4 GPU in the
Google Colab. Robust GPU computing manipulation
with a potential of 64GB/s of reminiscence transfer
and 16GB of VRAM allowed the show to effectively
process a large amount of statistics for more than an
hour and achieve results after a characteristic
execution. Metrics (Preetha, Jasmine et al. 2024).
4.1 Evaluation of performance metrics:
4.1.1 Accuracy
It measures charge as it should be categorized by
occasion, which usually proves to reveal performance
(Rehman, Amjad, et al. 2023).
Figure 3: Accuracy
4.1.2 Specificity
It quantifies the ability of the version to appropriately
discriminate against non-tumor cases, demonstrating
viability in minimizing false positives.
Figure 4: Specificity
4.1.3 F1 score
It combines precision and insight to provide an
adjusted degree of type execution, with high values
showing much better results (Preetha, Jasmine et al.
2024).
Figure 5: F1 Score
INCOFT 2025 - International Conference on Futuristic Technology
632
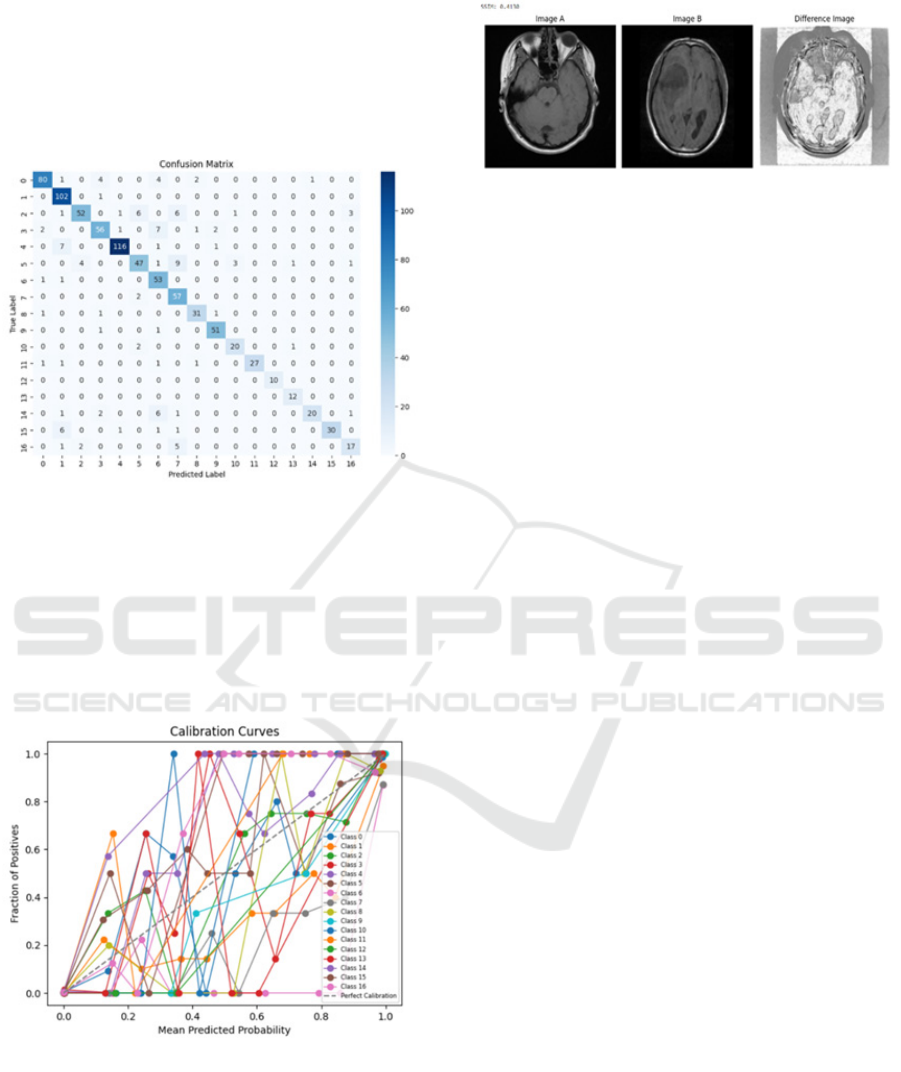
4.1.4 Confusion Matrix
Visualizes true positives, false positives, authentic
negatives and false negatives for each lesson,
differentiates understanding of misclassification
patter(Neamah, Karrar, et al. 2023)
Figure 6: Confusion Matrix
4.1.5 Calibration curve
It evaluates the arrangement of expected probabilities
with actual consequences; focus close to the tilted
exhibit large calibration (Wageh, et al. 2024).
Figure 7: Calibration Curve
4.1.6 Basic Similarity Record (SSIM)
It assesses the similarity between exact and expected
images; higher values indicate advanced preservation
of additional lights.
Figure 8: Similarity Record (SSIM)
4.2 Discussion
4.2.1 Key Findings
Model execution: Highlight the model's ability to
accurately classify brain tumors using CNN
engineering and highlight the high accuracy and
typical fit of your method
Metrics Achievements: Seemingly noteworthy,
achieved with metrics such as accuracy, F1 rating,
SSIM, and calibration bends, providing accurate
reports on model accuracy and unwaveringly
exceptional in real global programs.
Optimization Strategy: Explore the impact of
using optimizers like Adam with properly tuned
hyperparameters (gain knowledge of charge, mass,
beta) for incremental merging and overall
performance.
Computing Prowess: Be aware that it is part of
using a GPU (NVIDIA Tesla T4) to speed up
preparation and boost successful large-scale
recording preparation.
4.2.2 Model performance
Strengths:
1. High preparation accuracy (ninety-
five.06%): The display learned to effectively
understand the designs within the preparation
facts, showing that the design is properly
perfect for the task and data set. This high
accuracy reflects excellent study skills.
2. Strong class performance: F1 scores for
several classes are greater than 0.90 (e.g. class
zero: 0.9040, class 1: zero.9107, course four:
0.9508), indicating the adjusted accuracy and
ranking for these classes. Publish behaves quite
correctly when looking ahead to these classes.
3. Balanced F1 scores in most classes: Classes
that include nine (0.9444) and 11 (0.9310)
appear to be reliable and stable performers,
illustrating the version's potential to generalize
well across categories (Neamah, Karrar, et al.
2023)
Brain Tumor Detection of MRI Images Using CNN Implemented on VGG16 Based Architecture
633

weaknesses:
1. Testing Accuracy (86.46%): The difference
between preparation and testing accuracy
(approximately 9%) suggests reassembly. The
show probably learned to draft stats by rote,
causing it to underperform on subtle control
information.
2. Characteristic Biased Class: Lower F1 scores
in instructions that contain 16 (zero.7234) and 5
(0.7642) may be the end result of lesson
imbalance or insufficient statistical tests for
these categories, causing the display to struggle
with accurate predictions.
3. Higher trial calamity (0.404): The comparison
of prepared calamity (-0.153) and reported
calamity seems to be trying to generalize. A
high calamity harbinger regularly focuses on
issues with shouting or hazing in connection
with an impending calamity (Lin, et al. 2023),
(Pattanaik, Sudeshna, et al. 2024).
Possible reasons:
1. Training Time and Complexity: The sample
took 2 hours to compile over a hundred and fifty
on an Nvidia Tesla T4 GPU. The delayed setup
time suggests that the show may be complicated
and more tuning (e.g. regularization techniques)
may also relieve overfitting.
2. Imbalanced information: A few lessons are
likely underrepresented in the dataset, causing
the display to behave worse than the views
considered in the F1 score, and distort grid
inconsistencies.
4.2.3 Challenges They Face
Over the course of my show, I've done a few
challenges that I've won through inspection and
specialized upgrades.
Low accuracy without augmentation:
• Initial preparation without expanding the
records introduced in about lousy accuracy.
• The display tried to generalize due to the
limited variability of the data set.
• Information dissemination methods
explored and updated, with advances
showing robustness.
Extended preparation time:
• Exercising on a nearby machine has turned
into a waste and a waste of time.
• It used an NVIDIA Tesla T4 GPU from
Google Colab, which reduced preparation
time to honesty by hours.
Insufficient ranking metric:
• The initial performance evaluation required
accurate evaluation metrics.
• Explore advanced metrics (eg SSIM, F1
score, specificity, calibration curve) for
comprehensive performance evaluation.
• The implementation of these measurements
made it possible to correctly recognize the
qualities and shortcomings of the program
(Liu, et al. 2024), (Pattanaik, Sudeshna, et
al. 2024).
5 CONCLUSIONS
In this paper, we faced many challenges in building a
strong classification sample. Initially, our show
struggled with execution due to missing information
that occurred with moo accuracy when using raw
information without augmentation. After viewing
several investigative documents, we created a flood
of information that overall moved forward and
showed generalization and accuracy. The long
preparation time was another challenge that we
overcame by using the Google Colab GPU (NVIDIA
Tesla T4), reducing the total preparation time to 2
hours (Liu, et al. 2024).
Moreover, despite the fact that the initial
demonstration yielded great accuracy, the need for in-
depth implementation measurements limited the
investigation. To address this, we unified measures
such as F1 score, approach record (SSIM),
specificity, and calibration bend, driven by a paper
reference query, to gain a more comprehensive
experience of the model's qualities and shortcomings.
These extraordinary measurements revealed areas
where the demonstration exceeded expectations and
where progress could be made, such as the tendency
for over-fitting and course imbalance (Rehman,
Amjad, et al. 2023).
We also tested with the VGG16 design, including
unused features that contributed to significant
improvements in highlighting extractions and general
classification performance. By combining advanced
evaluation metrics and combining well-known deep
learning with enhancements, this reasoning lays the
groundwork for future optimization and progress in
image classification matching (Liu, et al. 2024),
(Pattanaik, Sudeshna, et al. 2024).
INCOFT 2025 - International Conference on Futuristic Technology
634

REFERENCES
Siar, Masoumeh, and Mohammad Teshnehlab. "Brain
tumor detection using deep neural network and machine
learning algorithm." 2019 9th international conference
on computer and knowledge engineering (ICCKE).
IEEE, 2019.
Deshmukh, Aishwarya V., and M. R. Bendre. "Multiclass
Brain Tumor Detection using Deep Transfer Learning."
2024 MIT Art, Design and Technology School of
Computing International Conference
(MITADTSoCiCon). IEEE, 2024
Ramprakash, B., et al. "Comparative Analysis of Deep
Learning and Machine Learning for Detection and
Classification of Brain Tumors at Multiple Stages."
2024 Second International Conference on Emerging
Trends in Information Technology and Engineering
(ICETITE). IEEE, 2024..
Rehman, Amjad, et al. "Detection of Lungs Tumors in CT
Scan Images Using Convolutional Neural Networks."
IEEE/ACM Transactions on Computational Biology
and Bioinformatics 21.4 (2023): 769-777
Preetha, R., M. Jasmine Pemeena Priyadarsini, and J. S.
Nisha. "Automated Brain Tumor Detection from
Magnetic Resonance Images Using Fine-Tuned
EfficientNet-B4 Convolutional Neural Network." IEEE
Access (2024).
Wageh, Mohamed, et al. "Brain Tumor Detection Based on
Deep Features Concatenation and Machine Learning
Classifiers With Genetic Selection." IEEE Access
(2024).
Lin, Xiaoyi, et al. "Improving tumor classification by
reusing self-predicted segmentation of medical images
as guiding knowledge." IEEE Journal of Biomedical
and Health Informatics (2023)
Liu, Huabing, et al. "Multimodal Brain Tumor
Segmentation Boosted by Monomodal Normal Brain
Images." IEEE Transactions on Image Processing
(2024).
Neamah, Karrar, et al. "Brain Tumor Classification and
Detection Based DL Models: A Systematic Review."
IEEE Access (2023).
Asiri, Abdullah A., et al. "Optimized Brain Tumor
Detection: A Dual-Module Approach for MRI Image
Enhancement and Tumor Classification." IEEE Access
12 (2024): 42868-42887.
Liu, Min, et al. "Brain Image Segmentation for Ultrascale
Neuron Reconstruction via an Adaptive Dual-Task
Learning Network." IEEE transactions on medical
imaging (2024).
Pattanaik, Sudeshna, et al. "A MIoT Framework of
Consumer Technology for Medical Diseases
Prediction." IEEE Transactions on Consumer
Electronics (2024)
Brain Tumor Detection of MRI Images Using CNN Implemented on VGG16 Based Architecture
635
