
Step Length Measurement Through Signal Power Analysis and
Accelerometer Device: A Laboratory Comparison
Christopher S. Ramon
1 a
, Santiago R. Coronel
1 b
, Jostin L. Ruiz-Zambrano
1 c
,
Ra
´
ul I. Villalta-Encalada
1 d
, Julio C. Chuqui-Calle
2 e
, Luis J. Serpa-Andrade
1 f
,
Freddy L. Bueno-Palomeque
1 g
and Pa
´
ul A. Chasi-Pes
´
antez
1 h
1
GIHEA - Grupo de Investigaci
´
on en Hardware Embebido Aplicado, Universidad Polit
´
ecnica Salesiana, Cuenca, Ecuador
2
Grupo de Investigaci
´
on en Ciencias de la Actividad F
´
ısica, Universidad Polit
´
ecnica Salesiana, Cuenca, Ecuador
Keywords:
Step Length Measurement, Race Walking, Received Signal Strength Indicator, Signal Power, Inertial Sensor,
Accelerometer.
Abstract:
The monitoring and analysis of kinetic and kinematic parameters integrated into sports disciplines such as race
walking can provide valuable information for developing personalized training programs and evaluating tech-
nique execution. In this study, we developed two systems for measuring step length based on microcontrollers
ESP32. The first system is based on measuring the received signal strength between two antennas, while the
second relies on inertial sensors (MPU-9250). Both systems were tested in a laboratory setting using a tread-
mill and video recording to assess their accuracy. The results showed that the system based on signal strength
measurement exhibited low precision at distances within a range of a few centimetres. On the other hand, the
inertial sensor-based system demonstrated higher accuracy when compared to video recordings. Although the
measurements differed statistically between these two methods (p-value = 0.001), the proposed inertial system
recorded a step length of 65 (61-69) cm, while the video recordings measured 67 (64-70) cm. The error dis-
tribution analysis showed that 39% of measurements had an error of 3.2 cm, 32% had an error of 7.5 cm, and
29% had an error not exceeding 12 cm. The proposed system shows potential for step length quantification
using the MPU-9250 sensor; however, further testing is required to reduce the measurement errors.
1 INTRODUCTION
Race walking is a sport discipline that combines as-
pects of normal walking with specialized biomechan-
ical techniques, characterized by the absence of a
flight phase and the need for continuous contact of
at least one of the lower limbs with the ground (Ca-
poraso et al., 2020). Stride length and various factors,
such as height, muscle strength, flexibility, time flight,
and technique, converge and their analysis enables
the identification of movement patterns, biomechan-
ical alterations, and optimization of athletes’ walking
a
https://orcid.org/0009-0009-9244-9238
b
https://orcid.org/0009-0005-7083-2392
c
https://orcid.org/0009-0009-1887-7752
d
https://orcid.org/0009-0000-5905-3770
e
https://orcid.org/0009-0003-2150-2173
f
https://orcid.org/0000-0003-1338-7868
g
https://orcid.org/0000-0003-1626-0272
h
https://orcid.org/0000-0002-4364-7483
technique (Pavei et al., 2019; Barreto-Andrade et al.,
2016).
The aforementioned parameters require that the
technique necessitates rigorous monitoring and con-
trol, both in training stages and in field competitions,
to optimize performance and prevent injuries. How-
ever, in addition to their complexity, the current tools
available for measuring and analysing these biome-
chanical parameters are limited in accessibility, mak-
ing their use in amateur training groups challenging
(Taborri et al., 2019).
Studies involving kinematic analysis using high-
speed cameras or force platforms face practical chal-
lenges in outdoor environments, mainly due to their
high complexity in acquisition and setup. Although
precise, these technologies are less accessible for real-
world applications outside controlled laboratory envi-
ronments due to their reliance on stable setups and de-
tailed calibrations to ensure data accuracy. In (Bernar-
dina et al., 2024), the feasibility of using action sports
cameras for 3D motion reconstruction of swimmers
Ramon, C. S., Coronel, S. R., Ruiz-Zambrano, J. L., Villalta-Encalada, R. I., Chuqui-Calle, J. C., Serpa-Andrade, L. J., Bueno-Palomeque, F. L. and Chasi-Pesántez, P. A.
Step Length Measurement Through Signal Power Analysis and Accelerometer Device: A Laboratory Comparison.
DOI: 10.5220/0013619100003988
Paper published under CC license (CC BY-NC-ND 4.0)
In Proceedings of the 13th International Conference on Sport Sciences Research and Technology Support (icSPORTS 2025), pages 119-125
ISBN: 978-989-758-771-9; ISSN: 2184-3201
Proceedings Copyright © 2025 by SCITEPRESS – Science and Technology Publications, Lda.
119
both in air and underwater was explored, highlighting
a more economical and flexible alternative to tradi-
tional motion capture systems.
From the perspective of portable solutions, the re-
search conducted in (Zrenner et al., 2018) has demon-
strated that using inertial sensors to measure running
speed and stride length can be a practical and portable
tool, such as RunScribe and Garmin Running Dynam-
ics Pod that utilize accelerometers for data collec-
tion. RunScribe offers a device equipped with the
InvenSense MPU-9255 motion sensor, which inte-
grates a gyroscope, accelerometer, and magnetometer
in a three-axis system. The inclusion of these tech-
nologies allows for the measurement of biomechan-
ical variables such as ground reaction force (Lewin
et al., 2022). Similarly, the Garmin Running Dynam-
ics Pod uses an accelerometer to capture torso move-
ment and measure key metrics like cadence, stride
length, ground contact time, and vertical ratio (Drob-
nic et al., 2023). The rapid advancement of sen-
sors and the reduction in manufacturing costs have
driven the increasingly widespread use of technology
in sports, encouraging its development and adaptation
to specific training needs (Campoverde-G
´
arate et al.,
2022; Flores-Morales et al., 2016; Cho, 2017; Mali
and Dey, 2020).
Building on the difficulties exposed, this project
assesses the viability of developing solutions for mea-
suring stride length in race walking by comparing the
use of inertial measurement sensors with the data pro-
vided by their accelerometers, and the measurement
of power using the received signal strength indicator
(RSSI) parameter through WiFi communication be-
tween two ESP32 microcontrollers.
Previous works proposes the use of RSSI for lo-
calization in both indoor and outdoor sports sys-
tems. In (Pricone and Caracas, 2014), they use RSSI
to estimate distance through trilateration, adapting a
path loss model with shadowing to adjust the signal
strength received based on distance, which is essen-
tial for real-time tracking applications. In the study
presented by (Ruiz Zambrano and Villalta Encalada,
2024), power measurement was evaluated as a tool to
relate it to step length. However, the results indicated
that the system was not suitable for short distances.
Based on these results, we hypothesized that stabiliz-
ing the transmission power and improving temporal
synchronization of transmitted values of power data
between transmitter and receiver will provide more
accurate results when measuring short distances.
The use of the MPU-9250, which integrates ac-
celerometers and gyroscopes, enables gesture detec-
tion in various sports disciplines such as running,
weightlifting, or race walking. (C
´
ardenas-Rodr
´
ıguez
et al., 2023; Mali and Dey, 2020; Flores-Morales
et al., 2016).
Our study proposes to compare two methods for
measuring step length: the method based on measur-
ing the transmitted power between the emitter and re-
ceiver and the accelerometer-based method. Our ob-
jective was to evaluate both methods with the inten-
tion of developing, in the future, a system for moni-
toring step length in race walking as a tool for training
monitoring in sports.
2 MATERIALS AND METHODS
2.1 Measurement Based on Power
Transmission (RDU)
To conduct this research, a distance measurement
system based on RSSI was first developed (RDU -
RSSI Distance Unit), based in the measurement of
the power level of a received signal, useful for dis-
tance estimation (Vikas et al., 2016). For distance
calculation we used two ESP-WROOM-32 develop-
ment board. For communication, the integrated IEEE
802.11 b/g/n WiFi module operates at 2.4 GHz, set-
ting up the two ESP32 microcontrollers as an access
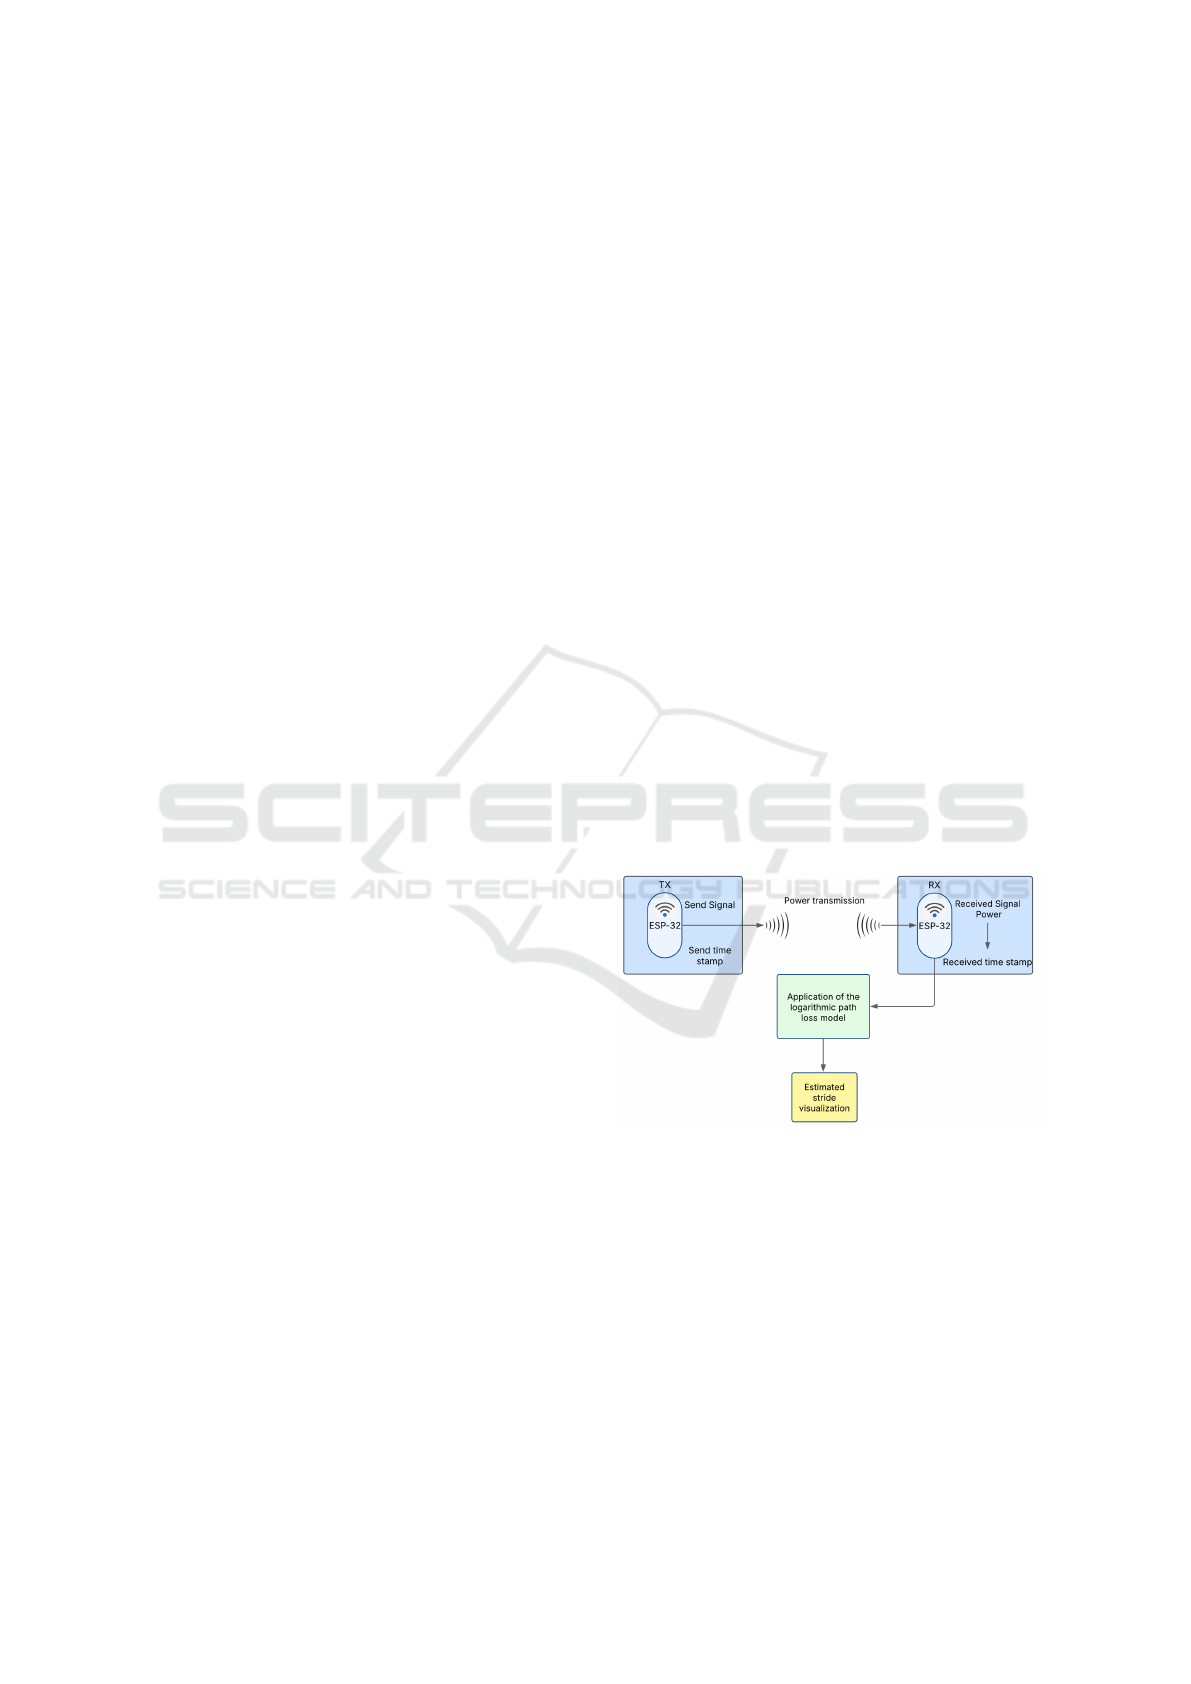
point and a client as shown in Fig. 1 where the system
operation is generally explained.
Figure 1: Diagram for communication between microcon-
trollers in the step length estimation system through trans-
mission power measurement.
The microcontroller configuration process is de-
tailed below:
• Terminal TX Configuration: An ESP32 micro-
controller was configured as an access point, it
creates a WiFi network with a predefined SSID
(Service Set Identifier) and password to estab-
lish a secure communication link. It continuously
transmits a preconfigured message with a times-
tamp corresponding to the moment the message
icSPORTS 2025 - 13th International Conference on Sport Sciences Research and Technology Support
120
is sent, ensuring a constant flow of data between
devices.
• Terminal RX Configuration: A second ESP32 mi-
crocontroller was configured as a device that con-
nects directly to the first microcontroller TX act-
ing as a host using the assigned credentials to re-
ceive and process the messages. Its main func-
tions include decoding the received message, ex-
tracting, and logging the RSSI value associated
with the message.
• Communication: To enable communication, the
client receives the message from the access point.
This process ensures that the transmission time
and transmission losses are recorded using the
RSSI parameter for each instance of communica-
tion. The time interval between transmitted mes-
sages was set to 75 ms and the initial transmission
power was set at -19 dBm as the upper limit to
ensure a stable connection.
The distance estimation through the RDU system is
based on the logarithmic relationship between signal
intensity and distance (Wu et al., 2015; Moya Ve-
lasco, 2019). This model describes signal loss as a
logarithmic function of distance with Equation 1:
P
l
(d) = P
l
(d
0
) + 10nlog
10
d
d
0
+ X
σ
, (1)
where n is a path loss factor, typically between 2 and
5, depending on the environment, X
σ
is a random vari-
able with a normal distribution, and d
0
is the reference
distance, usually 1m. This model is suitable for out-
door applications due to its low cost and acceptable
accuracy (Cao and Li, 2013).
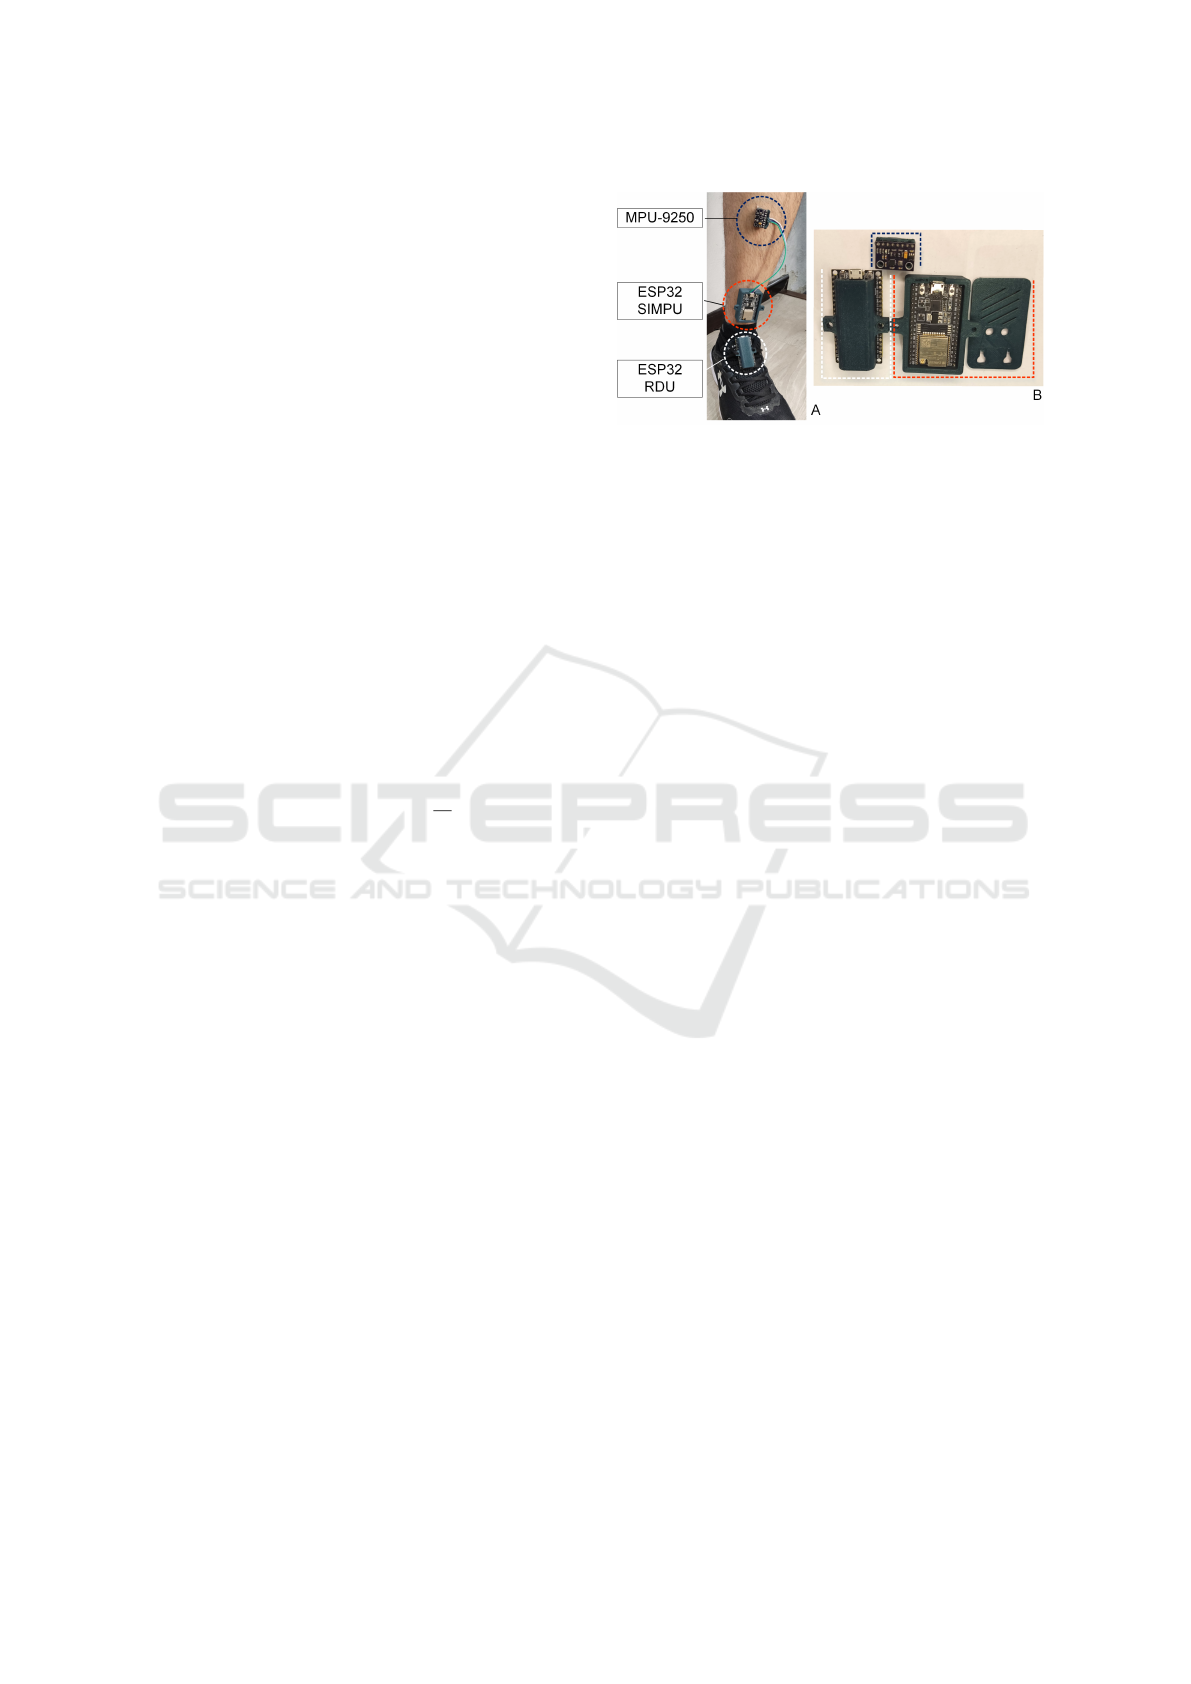
To capture the data, measurement devices were
placed on the subject’s body (see Fig. 2). The RDU
system was positioned at the front part of each shoe.
Building upon the work presented in (Ruiz Zambrano
and Villalta Encalada, 2024), we implemented in soft-
ware a temporal synchronization stage to manage
transmission of the measured power data. Synchro-
nization was achieved by sending two parameters in
an array: a timestamp and the corresponding RSSI
value. Path loss was then determined by calculat-
ing the difference between transmitted and received
power for each recorded value across the predefined
time intervals.
Both of the systems (RDU and SIMPU) used a
push-button placed at the bottom of the shoe, which
helped synchronize data collection since the push-
button is responsible for initiating the systems to col-
lect data in a coordinated manner.
Figure 2: A: Positioning of the SIMPU (red dotted line)
and RDU (white dotted line) systems mounted on one leg
of the subject for treadmill testing. B: Image focused on the
inertial sensor (blue dotted line) and microcontrollers for
data management.
2.2 Measurement Based on
Accelerometer (SIMPU)
At this stage of the project, we designed a system
based on the MPU-9250 inertial sensor (SIMPU),
which measures acceleration in three axes, allowing
for distance estimation using the Attitude and Head-
ing Reference System (AHRS) algorithm. Addition-
ally, we included a Kalman filter to enhance the accu-
racy of these angles through data fusion and Bayesian
estimation, considering both system and observation
noise (Chunyang et al., 2015; Ter
´
an Pineda, 2017).
This filter predicts the system state and then corrects
it based on the observed measurements (Ter
´
an Pineda,
2017; Krishnaveni et al., 2022). The prediction equa-
tion is:
P
k
= (I − K
k
H)P
−
k
(2)
Where P
k
is the estimation error covariance after
correction, I is the identity matrix, K
k
is the Kalman
gain, H is the observation matrix, and P
−
k
is the pre-
dicted estimation error covariance.
The AHRS algorithm processes the corrected data
from the MPU-9250 sensor to continuously estimate
the device’s orientation in real-time. This orientation
is represented by Euler angles: roll (θ), pitch (φ), and
yaw (ψ), which describe how the athlete’s foot tilts
and rotates during race walking (Wang et al., 2014;
Madgwick, 2014), as seen in Fig. 3.
The MPU-9250 obtains these orientations from
the integration of angular velocities provided by its
gyroscope, as expressed in the following equation:
Rotation Angle =
Z
angular velocitydt (3)
However, due to the accumulation of drift errors in
the integration process, the AHRS algorithm applies
sensor fusion techniques, combining data from the ac-
celerometer and gyroscope. This approach, optimized
Step Length Measurement Through Signal Power Analysis and Accelerometer Device: A Laboratory Comparison
121

Figure 3: Block diagram of distance estimation based on
accelerometer readings.
by Madgwick (Madgwick, 2014), corrects cumulative
deviations, ensuring more accurate and stable orienta-
tion estimates, even during dynamic movements. The
SIMPU system was affixed to the mid-part of the tibia
to minimize possible tilts that could introduce dis-
turbances into the inertial measurement system (see
Fig. 2).
2.3 Laboratory Tests
Given the exploratory nature of this laboratory study,
the assessments were conducted with a single par-
ticipant (27-year old, height=1.81 m, and mass=105
kg). The subject was in good health, had no suf-
fered recent injuries, and was fully informed about
the scope of the project from the beginning and vol-
untarily agreed to participate. The subject was sub-
jected to a race walking session on a treadmill in
the Effort Laboratory of the Universidad Polit
´
ecnica
Salesiana, Cuenca Campus. For video recording, an
smartphone camera was used (108-megapixels and 30
fps) and positioned parallel to the subject’s plane of
movement on the treadmill. For comparative eval-
uation, Kinovea software (v1.2, open-source, avail-
able at http://www.kinovea.org) was used, which al-
lowed for an analysis of measurements in real time
against video captures. Data from the RDU system,
SIMPU, and video images were recorded, enabling
cross-validation of the obtained results.
The RDU and SIMPU systems operate indepen-
dently. For the RDU setup, the system is placed on
the right ankle, as shown in Fig. 2, while a micro-
controller is attached to the left ankle to record the
received signal strength. For the SIMPU system, a
single unit is positioned on the right ankle. Once the
systems are in place, the subject walks on the tread-
mill, and when the target speed is reached, an exter-
nal trigger is applied via a push button to synchronize
both systems with the video recording.
The laboratory tests were divided into two stages.
In the first stage, three sessions were conducted (one
minute each one). The subject wore visible markers
(white tape) on the key areas where devices were in-
stalled, which facilitated the correct identification of
each system during analysis in the reference software.
As a metric reference, a 1.5 m tape measure was used
to calibrate the reference in Kinovea software. To
avoid inconsistencies in comparing results, both sys-
tems (RDU and SIMPU) were evaluated simultane-
ously, ensuring that the measurements obtained reflect
the same experimental context and allowing a direct
and unbiased comparison.
In the second stage of testing, we discarded the
system that exhibited the highest error and repeated
the tests using only the remaining system. For
the statistical analysis we used the Wilcoxon rank
sum test to compare the medians of the registered
data, after assessing data normality using the Kol-
mogorov–Smirnov test. This non-parametric test does
not assume normality of the recorded step length mea-
surements. The hypothesis test was based on the
null hypothesis (H
0
), which stated that the measure-
ments obtained with our system were comparable to
those recorded by video. A significant result (p-
value≤0.05) would indicate a difference between the
two sets of measurements.
3 RESULTS
During the first stage of testing, a total of 133 steps
were recorded, and the results analysis in this section
was based on this data. The measurements recorded
with both systems and the Kinovea software can be
observed in Fig. 4A. Additionally, a description of
these results is presented in Table 1, which includes
the p-value obtained by comparing the results of the
two proposed systems with those of the Kinovea soft-
ware. In the comparative evaluation, we can observe
that the measurements with the SIMPU system show
a high level of similarity with the Kinovea records (p-
value=0.350). On the other hand, the measurements
taken with the REDU system are statistically different
(p-value<0.001).
The measurements of each system were compared
with the Kinovea record, and the absolute error is cal-
culated for each measurement. Fig. 5 shows the er-
ror distribution for the SIMPU and RDU systems. It
can be observed that the SIMPU system exhibits a
more concentrated error distribution with less disper-
sion around zero, indicating greater precision and less
variability in its measurements. In contrast, the RDU
system shows a wider distribution, with scattered er-
rors and a higher frequency of elevated values, sug-
gesting lower accuracy and greater variability in data
icSPORTS 2025 - 13th International Conference on Sport Sciences Research and Technology Support
122
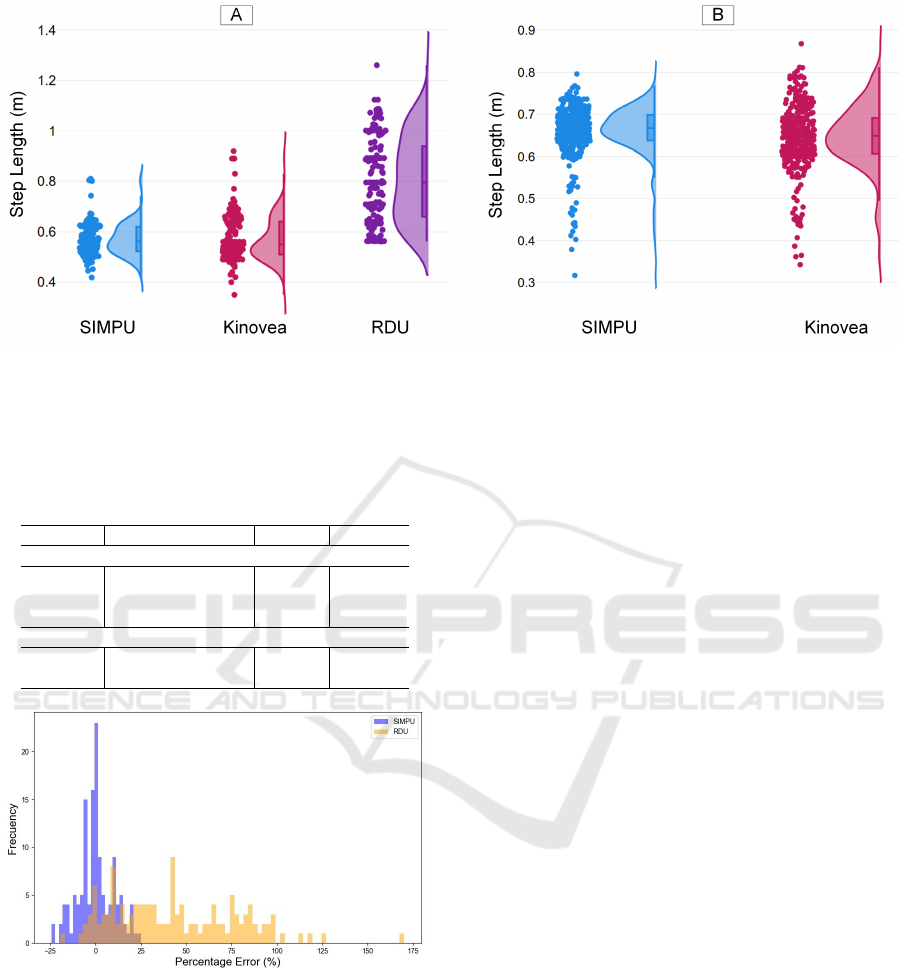
Figure 4: A: Box plot comparing the distribution of step length measurements between SIMPU, RDU, and Kinovea software
in tests stage 1. B: Comparison of step length measurements between SIMPU and Kinovea in the test stage 2.
Table 1: Description of the data obtained by the SIMPU
and RDU systems in meters (m). The median value and in-
terquartile range are presented. The RMSE and the p-value
shown was calculated by comparing the results of each sys-
tem with those obtained from Kinovea.
System Step Length RMSE p-value
First test
Kinovea 0.56 (0.52 - 0.62) - -
SIMPU 0.55 (0.51 - 0.64) 0.057 0.350
RDU 0.80 (0.66 - 0.94) 0.299 <0.001
Second test
Kinovea 0.67 (0.64 - 0.70) - -
SIMPU 0.65 (0.61 - 0.69) 0.045 0.001
Figure 5: Calculation of the absolute error of the measure-
ments with the proposed systems compared to the Kinovea
measurements.
measurement.
The data obtained, which contrast the readings of
the systems with the reference measurements from
Kinovea software, indicate that the SIMPU system
exhibited statistically similar, as evidenced in Fig. 4A.
The values for the SIMPU system remain within a
narrower and more predictable range compared to
those of the RDU system, which shows considerable
variability and a lack of a clear pattern of behavior.
The more centred median and narrower range in the
SIMPU data compared to the RDU data (see Table 1)
reinforce the idea that SIMPU is more stable and re-
liable for these measurements. The RMSE value be-
tween SIMPU and Kinovea was 0.057 m, indicating a
small average error between the measurements.
For the second stage of testing (304 steps
recorded), measurements were conducted exclusively
with the SIMPU system in the same laboratory and
under identical test conditions. The step length results
were incorporated into Fig. 4B. for comparison, while
the median and interquartile range results were added
into the lower section of Table 1. The results show
an maximum error of 20%, similar to that obtained in
the first stage of testing. However, when statistically
comparing the results, we observe a p-value=0.001,
indicating that the results are statistically different,
while the small RMSE value (0.045 m) reflects a low
average deviation.
4 CONCLUSIONS
The work carried out in this research contrasts two
systems developed for the quantification of step
length in race walking. The mentioned sport has been
the inspiration for this study; however, the scope of
the tests conducted for this document has remained
within the laboratory. This project has been directed
toward the development of a system for monitoring
step length in race walking, focusing on training and
monitoring based on easily accessible and highly re-
liable technologies (Mali and Dey, 2020). The re-
sults presented in this work were obtained from a sin-
gle participant; therefore, they are not generalizable.
Step Length Measurement Through Signal Power Analysis and Accelerometer Device: A Laboratory Comparison
123

Nevertheless, they provide preliminary evidence re-
garding the behaviour of the systems developed in our
laboratory for the future evaluation of stride length.
The instability of the RDU complicates the possi-
bility of establishing effective corrections to minimize
errors, whereas the consistency of the SIMPU sug-
gests greater viability for its implementation in step
length measurement systems in sports and biome-
chanical applications. Consequently, the analysis
concludes that the use of SIMPU as a measurement
system is the less imprecise option in step length mea-
surement, highlighting its potential as a low-cost tool
with promising prospects for reducing measurement
error, which are fundamental for the development and
validation of human movement models.
Based on the results obtained from the absolute
error comparison, with -0.01% and 43.77% being the
average error for SIMPU and RDU respectively, it is
concluded that the power-based measurement method
presents problems of readjustment. This is due to the
Wi-Fi communication protocol attempting to main-
tain a stable connection by dynamically adjusting the
transmission power. However, this behavior affects
the transmission value, making it difficult to obtain
consistent measurements.
Additionally, the Wi-Fi protocol parameter of
ESP32 is a partially closed system that does not al-
low the modification in a customized manner to opti-
mize power usage. Consequently, in situations where
the distance between devices changes, significant er-
rors in signal transmission are generated, as observed
in the obtained results. This demonstrates the limita-
tions of the RDU for accurate measurements in sce-
narios where connection conditions vary.
Regarding the SIMPU system, the data obtained
demonstrates superior performance when using this
device for measurements. As a more controlled sys-
tem, it is easier to make adjustments in the capture of
acceleration and position data, thanks to the integra-
tion of its accelerometer and gyroscope.
In the second stage of testing between SIMPU and
Kinovea, we can statistically observe that the mea-
surements are different (p-value=0.001), indicating a
difference in their distribution due to their significant
disparity. Based on the recorded measurements, there
is a 39% probability that the measurement has an ab-
solute error of less than 5%, a 32% probability that it
falls within the range 5% < absolute error < 10%, and
a 29% probability that it exceeds 10% (up to approx-
imately 20%, which is the maximum recorded error).
Considering a median value of 0.65 m, an absolute er-
ror of 5%, 10%, and 20% corresponds to a step length
reading error of 3.2 cm, 6.5 cm, and 12 cm, respec-
tively.
While it does not achieve the precision necessary
to conform to the metrics established in the mea-
surement of step length in race walking, its results
are significantly better than those obtained with the
RDU system. The maximum error recorded is ap-
proximately 25%, positioning it as the better option
among the two systems evaluated. As future work, it
is proposed to develop an embedded system with the
SIMPU system and conduct field tests with athletes.
ACKNOWLEDGEMENTS
This work was supported by project “RWA+ Race
Walking Analytics” (Resolution No. 005-001-
2024-01-18) from Universidad Polit
´
ecnica Salesiana,
Cuenca, Ecuador.
REFERENCES
Barreto-Andrade, J., Villarroya-Aparicio, A., Contreras-
Calle, T., Brito-V
´
asquez, V., and Loaiza-D
´
avila, E.
(2016). Biomec
´
anica de la marcha atl
´
etica. an
´
alisis de
las presiones plantares durante su desarrollo, revisi
´
on
actualizada. Lecturas: educaci
´
on f
´
ısica y deportes,
21(217):1–9.
Bernardina, G. R. D., Andrade, A. G. P. d., Monnet, T.,
Cerveri, P., and Silvatti, A. P. (2024). Simultaneous
in-air and underwater 3d kinematic analysis of swim-
mers: Feasibility and reliability of action sport cam-
eras. Journal of Biomechanics, 168(112078).
Campoverde-G
´
arate, J. P., Chuqui-Calle, J. C., Serpa-
Andrade, L. J., and Bueno-Palomeque, F. L. (2022).
Detection of flight phase in race walking based on
pressure sensors. In 2022 IEEE 40th Central Amer-
ica and Panama Convention (CONCAPAN), pages 1–
5. IEEE.
Cao, Z. and Li, D. (2013). Exploration of parameter factor
in the rssi model. Applied Mechanics and Materials,
268-270:1822–1831.
Caporaso, T., Grazioso, S., Gironimo, G. D., and Lan-
zotti, A. (2020). Biomechanical indices represented
on radar chart for assessment of performance and in-
fringements in elite race-walkers. Sports Engineering,
23:4.
C
´
ardenas-Rodr
´
ıguez, M. F., Paute-Tigre, C. G., and Bueno-
Palomeque, F. L. (2023). In-field recording of six
biaxial angles and plantar pressures in weightlifting
through a wearable system. Journal of Medical Sig-
nals & Sensors, 13(4):290–299.
Cho, H. (2017). Design and implementation of a
lightweight smart insole for gait analysis. In 2017
IEEE Trustcom/BigDataSE/ICESS, pages 792–797.
IEEE.
Chunyang, L., Fan, C., Xin, S., Hongtao, C., Junling,
X., and Yujun, X. (2015). Gesture detection and
icSPORTS 2025 - 13th International Conference on Sport Sciences Research and Technology Support
124

data fusion based on mpu9250 sensor. pages 1612–
1615. 12th IEEE International Conference on Elec-
tronic Measurement and Instruments (ICEMI), Qing-
dao, PEOPLES R CHINA, JUL 16-18, 2015.
Drobnic, M., Verdel, N., Holmberg, H.-C., and Supej, M.
(2023). The validity of a three-dimensional motion
capture system and the garmin running dynamics pod
in connection with an assessment of ground contact
time while running in place. SENSORS, 23(16).
Flores-Morales, V. H., Contreras-Bermeo, B. G., Bueno-
Palomeque, F. L., and Serpa-Andrade, L. J. (2016).
Analysis of a mobile system to register the kinematic
parameters in ankle, knee, and hip based in inertial
sensors. In International Congress on Sport Sciences
Research and Technology Support, volume 2, pages
29–33. SCITEPRESS.
Krishnaveni, B. V., Reddy, K. S., and Reddy, P. R. (2022).
Indoor tracking by adding imu and uwb using un-
scented kalman filter. Wireless Personal Communi-
cations, 123(4):3575–3596.
Lewin, M., Price, C., and Nester, C. (2022). Validation
of the runscribe inertial measurement unit for walking
gait measurement. PLOS ONE, 17(8).
Madgwick, S. O. H. (2014). Ahrs algorithms and calibration
solutions to facilitate new applications using low-cost
mems.
Mali, N. P. and Dey, S. (2020). Modern technology and
sports performance: An overview. International Jour-
nal of Physiology, 5(1):212–216.
Moya Velasco, W. P. (2019). Implementaci
´
on de un al-
goritmo de localizaci
´
on en interiores para resolver el
problema de ubicaci
´
on de objetos usando tecnolog
´
ıa
bluetooth low energy. B.S. thesis, Quito, 2019.
Pavei, G., Cazzola, D., Torre, A. L., and Minetti, A. E.
(2019). Race walking ground reaction forces at in-
creasing speeds: A comparison withwalking and run-
ning. Symmetry, 11.
Pricone, M. and Caracas, A. (2014). A heterogeneous
rssi-based localization system for indoor and outdoor
sports activities. In Proceedings of the IEEE Con-
ference on Local Computer Networks, Milano, Italy.
IEEE.
Ruiz Zambrano, J. L. and Villalta Encalada, R. I. (2024).
Dise
˜
no de prototipo de medici
´
on de zancada en mar-
cha ol
´
ımpica. B.S. thesis.
Taborri, J., Palermo, E., and Rossi, S. (2019). Automatic
detection of faults in race walking: A comparative
analysis of machine-learning algorithms fed with in-
ertial sensor data. Sensors 2019, Vol. 19, Page 1461,
19:1461.
Ter
´
an Pineda, D. F. (2017). Dise
˜
no e implementaci
´
on
de un sistema para visualizar la marcha humana
biomec
´
anica en la afectaci
´
on de rodilla ante una go-
nartrosis.
Vikas, C. M., Rajendran, S., Pattar, A., Jamadagni, H. S.,
and Budihal, R. (2016). Wifi rssi and inertial sen-
sor based indoor localisation system: a simplified hy-
brid approach. 2016 INTERNATIONAL CONFER-
ENCE ON SIGNAL AND INFORMATION PROCESS-
ING (ICONSIP).
Wang, Y., Li, N., Chen, X., and Liu, M. (2014). Design
and implementation of an ahrs based on mems sensors
and complementary filtering. Advances in Mechanical
Engineering, 2014:Article ID 214726.
Wu, F., Xing, J., and Dong, B. (2015). An indoor local-
ization method based on rssi of adjustable power wifi
router. Fifth International Conference on Instrumen-
tation & Measurement, pages 1481–1487.
Zrenner, M., Gradl, S., Jensen, U., Ullrich, M., and Es-
kofier, B. M. (2018). Comparison of different algo-
rithms for calculating velocity and stride length in
running using inertial measurement units. Sensors,
18(12):4194.
Step Length Measurement Through Signal Power Analysis and Accelerometer Device: A Laboratory Comparison
125
