
Automated Severity Classification Using Convolutional Neural
Networks: A Deep Learning Approach to Diabetic Foot Ulcer
Assessment
Ankita Suryavanshi
1
, Vinay Kukreja and Rajat Saini
2
1
Centre for Research Impact & Outcome, Chitkara University Institute of Engineering and Technology,
Chitkara University, Rajpura, 140401, Punjab, India
2
Chitkara Centre for Research and Development, Chitkara University, Himachal Pradesh,174103, India
Keywords: Diabetic Foot Ulcers, Convolutional Neural Network (CNN), Automated Diagnosis, Medical Imaging, Health
Technology
Abstract: This paper elaborates on the development of designing and training a CNN to distinguish between mild,
moderate, and severe DFUs. There were four distinct parts to the research project: The main activities
involved are data acquisition and data pre-processing, model architectural design and model building, model
training and model assessment, and the final phase which is model analysis and result interpretation. Pictures
of DFUs were used in the dataset and performances such as normalization and augmentation were used to
enhance the dataset to ensure that all was in order. The CNN was designed to learn and extract data from
images; the two sets and convolutional layers, max, and fully connected layers. Achieving 96 % good
precision, 85 % good recall, and F1 between 0.97 and 0.98 for all severity levels, the model used a confusion
matrix to distinguish between training and testing. Class A had a real positive rate of 0% to 20%, Class B of
20% to 40%, Class C of 40% to 60%, Class D of 60% to 80%, and Class E of 80% to 100%. Providing a
useful tool for the treatment of diabetic foot ulcers, these results show that the model is resilient and can
improve diagnosis accuracy in clinical settings.
1 INTRODUCTION
For millions of people throughout the world, ulcers of
diabetic feet (DFUs) are a constant source of misery
and disability due to the long-term effects of diabetes.
According to the International Diabetes Federation,
almost 537 million adults will be living with diabetes
in 2021, a figure that has been steadily increasing
over (Suryavanshi, Kukreja, et al. 2023) the past few
decades. Within this mind-boggling figure, DFUs
pose an especially serious problem because they are
the primary reason for hospitalization and, in extreme
circumstances, amputation. There needs to be a
dependable and accurate way to measure the severity
of ulcers and guide management measures because
DFUs are complex and can range from small,
superficial lesions to life-threatening infections.
Subjective clinical examination was for a long time
used to assess the severity of DFU. Doctors estimate
the degree of tissue injury and discuss the next step of
treatment with the help of ordinary observation and
talking to the patient, as well as relying on norms.
Whichever way it is done, this approach is not
without limitation, again, this is even though the
clinician(s) may (Suryavanshi, Kukreja, et al. 2023)
be well knowledgeable and experienced and all that
Variability in the evaluation of patients and
subsequent diagnosis and treatment is likely to hurt
patient outcomes regularly. Due to the inability of the
conventional method to distinguish the fine stages of
ulcer formation the treatment programs are very often
ineffective and the recovery takes much time. Thus,
several difficulties have led to a heightened reliance
on modern (Suryavanshi, Kukreja, et al. 2024) high-
tech approaches to the process of medical diagnostics.
CNN is a subcategory of deep learning models, also
called a neural network, and they have gained great
acclaim in many spheres of medicine, especially
concerning image recognition. It is worth focusing on
such applications as pattern identification and
categorization as these models are capable of learning
structured features from the photos automatically.
This way, employing CNNs we can determine the
Suryavanshi, A., Kukreja, V. and Saini, R.
Automated Severity Classification Using Convolutional Neural Networks: A Deep Learning Approach to Diabetic Foot Ulcer Assessment.
DOI: 10.5220/0013609400004664
Paper published under CC license (CC BY-NC-ND 4.0)
In Proceedings of the 3rd International Conference on Futuristic Technology (INCOFT 2025) - Volume 3, pages 99-105
ISBN: 978-989-758-763-4
Proceedings Copyright © 2025 by SCITEPRESS – Science and Technology Publications, Lda.
99

severity of DFU in a more precise, reliable, and with
significantly less time than by using the traditional
approach. As far as the capacity to process and
analyze hierarchical structures within images is
concerned, CNN is organically tailored to meet the
requirements of DFU classification due to its
architecture. In this paper, a novel CNN model is
proposed for the specific purpose of categorizing
DFUs concerning their severity.
The first six layers in the model’s architecture include
two sets of convolutional layers with max pooling
operations followed also by two other sets of
convolutional layers with max pooling operations. As
will be described later in this paper, by employing this
layered (Suryavanshi, Kukreja, et al. 2024) model, it
becomes possible to estimate the severity of anemia
with high precision by successively peeling and
refining the features from the input photos. This
captures what is known as texturing at high levels and
also the overall pattern. Edges and textures of the
images are detected by the first layer of the
convolutional layer in this network. To this end, it is
followed by a max pooling layer that helps decrease
the dimensionality of the (Suryavanshi, Kukreja, et al.
2024) feature maps and retains the most important
information. Indeed, the second basic constituent of
the CNN, the second convolutional layer with the
same set of parameters, is widely adopted for
detecting additional and more complex features that
emerged as a result of developing these simple and
elementary features. The next shape in the max
pooling layer enhances (Suryavanshi, Kukreja, et al.
2023) the model’s capacity for the recognition of the
various degrees of severity while enhancing these
patterns. Thus, the last two convolutional layers
continue with the hierarchical feature extraction to
perform accurate ulcer classification. This leads to a
high representation of the properties of the ulcer,
which is a good point for the approach. The
effectiveness of the suggested CNN model is checked
on a dataset of DFU photos whose wavelength
includes a wide range of severity levels. Due to the
selection of some carefully annotated instances, these
annotations are correct and diverse, which allows
using this dataset to train and test the model. To
identify the clinical usefulness of the model, we
compare the obtained results with the results achieved
through various methods using measures like
precision, recall, precision, and F1 score List of pros
associated with this strategy is endless. Our goal is to
remove human bias from the criteria that are
evaluated and to establish more objective measures of
assessing severity to ease the monitoring of severity
in hospitals through the standardization of the
procedure and the use of a computer program. This
uniformity is necessary to ensure that the genuine
capability and adequately developed ideas of all
patients regardless of the clinician’s experience have
equal opportunities to afford fair and evidence-based
treatment. The efficacy of the automated evaluation
is also evident in the short diagnostic durations which
in turn advocates for time-appropriate interventions
that may reduce the occurrence of such issues. The
findings of our study regarding the applicability of
CNNs for DFU severity classification toward the next
steps and the possibility of utilizing AI in diagnostic
research. The findings of this study could advance the
use of deep learning for examining several complex
medical conditions and enhance patient care, as well
as expand the field of medical imaging. Last but not
least, this study fits the pressing need for proper
assessment techniques by elaborating on the
applicability of CNN for diabetic foot ulcer
classification. Thus, the ultimate objective is to
enhance the overall quality (Suryavanshi, Kukreja, et
al. 2023) of treatment for patients with DFUs and the
efficiency of the treatment process by introducing
new deep-learning methods for improving the
evaluation of the DFU severity. The CNN proposed
herein is a creation at the mouthpiece of innovation
and medicine; it delivers a dream of what diagnostic
prowess can look like because of its highly
architected and well-validated approach.
2 LITERATURE SURVEY
Ulcers of the diabetic foot (DFUs) remained one of
the most threatening complications of diabetes
mellitus that was acknowledged to influence millions
of people worldwide. Scientific outcomes depict up
to fifteen percent of patients with diabetes develop a
DFU at some point in their lifetime, which remains an
intolerably high rate. These ulcers are (Tulloch,
Zamani, et al. 2020) a financial and health threat to
healthcare systems, and they significantly cause an
increase in the morbidity of diabetic patients. Proper
ulcer severity and its staging are very important
during the management of DFUs. In this literature
review, the current methods of DFU severity
classification, CNN utilization in medical imaging
and potentially applying these technologies to grade
DFUs are discussed. Conventional Approaches to
DFU Severity Rating: The severity of DFU has in the
past been assessed from clinical evaluation of the
patient’s physical exam and (Alshayeji, Sindhu, et al.
2023) history and physical examination. To make
this procedure more consistent, other classification
INCOFT 2025 - International Conference on Futuristic Technology
100

systems have emerged, each with its unique way of
describing the severity of ulcers: Currently, there are
several classification systems among which one of
the earliest and still widely used is the Wagner
Classification System, which categorizes DFUs
depending on the impact on the tissues, and are
divided into six groups. That goes from there starting
with 0 (refers to no ulcer) to 5 (is related to gangrene
or significant tissue necrosis). There can be
evaluation heterogeneity because the Wagner system
relies on subjective (Munadi, Saddami, et al. 2022)
clinical opinion to determine the convenience of an
ulcer Different characteristics offered by the Wagner
system give a useful description of the severity of
ulcers. Both the depth of the wound and the state of
infection are represented in The University of Texas
Scar Classification System to differentiate the DFUs
phases. The present system is based on the Wagner
system, and the following criteria are rather included
in the present system. The dichotomy is replaced by
a combination of four depth levels (from 0 to 3) and
three infection grades (from A to C), which provide a
better assessment of the patient’s condition in terms
of clinical factors and the severity of tissue injury.
Clinical evaluation, (Khandakar, Chowdhury, et al.
2022) which is still the core of the system even after
developing the higher techniques, is prone to
subjectivity. Thus, the classification system called
PEDIS has a more comprehensive approach to the
assessment of the DFUs as it not only considers the
defects of the ulcer itself but also estimates the
conditions of the area surrounding the ulcer. PEDIS
is an acronym that refers to the five aspects of
pressure ulcers namely; Perfusion, Degree, Depth,
Infection, and Sensation. Severe is the total number
of points that will be obtained from the components
of the seriousness of an incident. Yes, it may take
time to score it and this may make it a bit tedious but
this approach gives a holistic view of the ulcer. The
attempt aimed at producing more contemporary
criteria for DFU evaluation that combines clinical and
laboratory factors is the American Diabetes
Association (ADA) classification system. These
include categories for ulcer depth, infection status,
and other correlated factors that give a more general
outlook of ulcer severity in this method. On the other
hand, it might be limited by variation across settings
and appears to be based on clinical decision-making.
However, these conventional concepts should not be
underestimated as they provide frameworks for
defining the classification of DFU.
Possible discordances in the severity categorization
and treatment regimen formation might be rooted in
practitioners’ rating subjectivity and inherent
randomness. Hence, to increase the objectivity of
conclusions it is necessary to enhance the accuracy
and reliability of DFU evaluation utilizing advanced
( Gamage, Wijesinghe, et al. 2019) technology.
Critical Purposes of CNNs for Diagnostic Imaging As
a fulgent tool, neural networks through convolution
(CNNs) hold a large potential in providing
metamorphoses in the diagnosis of medical images.
CNNs are very efficient, particularly in medical
imaging and situations that call for image analysis.
They belong to certain CNNs that have been designed
and trained with the aim of performing powerful deep
learning with a focus on image recognition. The main
concept of convolutional neural networks (CNNs) is
their ability to learn high-level features from images
in an end-to-end manner. CNNs employ layers of
conviction to extract characteristics from raw picture
data as compared to conventional ML models that
rely on (Khandakar, Chowdhury, et al. 2021)
engineered features At this stage, the Convolution
layer is employed in CNNs to extract characteristics.
For establishing edges, textures, and forms in the
input picture, these layers employ filters. Although
the feature maps pass through subsequent layers
which include the pooling layers, the crucial
information is not lost but is rather compressed.
Classification is performed by the last networks
employing the learned characteristics (Yogapriya,
Chandran, et al. 2022)] and results in the accurate and
swift evaluation of the pictures. CNN has various
medical image applications that include disease
detection, picture segmentation, and classification.
For instance, CNN proved to be effective in
radiological image tumor detection, segmenting the
structure in MRI images, as well as classifying the
retinal diseases. Still, medical image analysis is well
within the possibilities of CNNs because these
networks can learn complex patterns and work with
different imaging modalities. Using CNNs for the
assessment of wounds, and more specifically DFUs,
has been a growing subject of interest within the field
over the last few years. There are studies on
convolutional neural networks concerning the
capability of WPC in classifying wounds, estimating
the size, and predicting healing outcomes. From this
study, it has also (Mei, Ivanov, et al. 2020) been
indicated that CNNs could be used as a reliable
replacement for the conventional approach to
determining wound features for the reasons of
objectivity, consistency, and efficiency.
Automated Severity Classification Using Convolutional Neural Networks: A Deep Learning Approach to Diabetic Foot Ulcer Assessment
101

3 METHODOLOGY SECTION
This work aims to develop and evaluate a model
based on convolutional neural networks for the
classification of DFUs’ severity. Four comprehensive
phases comprise the methodology: CNN Model
Design and Development, Data Collection and
Preprocessing, Model Training and Evaluation, and
Results Analysis and Presentation.
Figure 1: Methodology phases
3.1 First phase
Hospital archives and publicly accessible medical
databases are only two of the many places from which
a varied dataset of DFU photos is painstakingly
assembled during the first period of data Collection
and Preprocessing. These pictures range in severity,
and skilled medical professionals have marked them
using recognized classification schemes like the
Wagner Classification. This guarantees Level 1
through Level 5 severity levels are accurately labeled.
Preprocessing includes standardizing pixel values to
improve training efficiency, shrinking photos to a
standard resolution to preserve uniformity, and using
methods for data enhancement to strengthen the
robustness of the model. Subsequently, the dataset is
divided into test, validation, and training sets to
guarantee accurate model assessment.
3.2 Second phase
The second stage, CNN Model Development and
Development, is entirely assigned to design the CNN
model for the specification of DFU classification. Six
main layers make up the model: The configuration
includes two convolution layers, two two-layer
convolutions with max-pooling layers, and another
convolution set aiming at extracting hierarchical
features of DFUs. This design enables the model to
learn such complex patterns that are required for
precise classification. Under architectural definition,
grid-based or random search methods are applied to
optimize the model’s performance by tuning the
hyperparameters such as learning rate, batch quantity,
and number of epochs. Cross-validation is also used.
3.3 Third phase
Once again, the training dataset is constructed
following the Pre-Preparation Phase mentioned
earlier, During the third phase, known as The model
Training and Evaluation, the CNN model is trained.
The training of this model reduces this loss using an
optimizer such as Adam or RMSprop, while the loss
function is a categorical entropy cross. During
training, the validation loss stops decreasing; the
training is conducted by employing an early stopping
technique to prevent overfitting. While evaluating the
proposed model’s performance, it measures
indicators such as accuracy, precision, recall, and F1
score based on the validation and test sets. The
interaction of the model between different severity
levels is examined through the confusion matrix to
gain insight into the model’s categorization skills.
3.4 Fourth phase
The last stage, Results Analysis and Interpretation, is
aimed at providing a detailed consideration of the
model’s performance. Consequently, it is possible to
stress the positive impact of the CNN model and
major areas of its further development concerning a
comparison with other current classification
algorithms. Thus, frequent misclassifications
exposed by error analysis help reveal the model’s
flaws and optimize the approach. For the results’
demonstration, it is possible to use ROC curves and
the heat map of the matrix of uncertainty. Proposed
solutions for the fine-tuning of the model are
suggested based on the observations, as well as the
tips for its practical use in the clinical environment.
As a result, to raise the level of DFU classification
accuracy the phase is concluded by recommendations
for further research, for example, future studies may
consider more intricate models or include several
types of data.
INCOFT 2025 - International Conference on Futuristic Technology
102
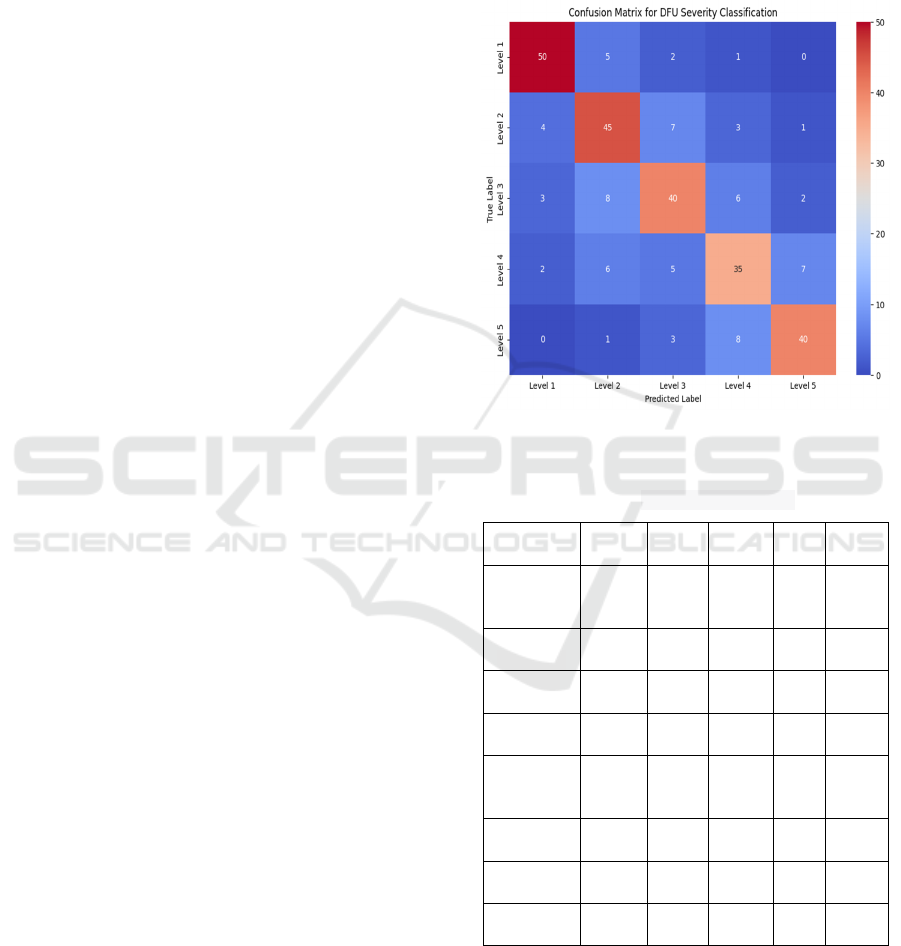
4 RESULTS
Regarding the CNN model used for the classification
of ulcers resulting from diabetes (DFUs), the
confusion matrix is very useful as it gives insight into
the precision of the model across the various severity
stages. They reveal true positive, false favorable, true
negative, and incorrect negative forecasts of every
severity level to explain the strengths and weaknesses
of a model. For instance, the diagonal elements’ high
true positive values indicate better grouping of cases
based on severity levels because 50 cases are
correctly identified as Level 1 and 45 as Level 2. On
the other hand, off-diagonal values show that, for
example, Level 1 is predicted as Level 2, which points
to the issues with discerning between close levels of
severity for the model. This pattern shows that
between severity levels some of the features can
sometimes be correlated and hence confused by the
model. The confusion matrix also makes it easier to
compute performance metrics such as accuracy,
precision, recall, and F1 score, all of which help to
explain the model's classification capabilities.
Visualizing the confusion matrix as a heatmap
improves interpretation by illustrating the distribution
of categorization results in vivid detail. Overall, the
CNN model does well in categorizing most DFUs,
but the confusion matrix highlights the requirement
for further modification to solve misclassification
concerns and enhance its precision in discriminating
between overlapping severity levels. The table
provides an extensive assessment of the classification
model's performance in several metrics for each class,
as well as aggregated metrics. Precision indicates the
probability of positive predictions; for example, Class
1 had a precision of 0.83, meaning that 83% of the
anticipated cases were right. Recall, which measures
how successfully the model recognizes true positives,
displays Class 1 having an accuracy score of 0.85,
indicating that it correctly recognized 85% of the real
cases in that class. The F1 score, which balances
precision and recall, is 0.84 for Class 1, indicating a
great balance among the two measures. Support
represents the actual amount of cases for every
category, with Class 1 being 58 in the dataset. The
accuracy of Class 1 is 0.83, which indicates that 83%
of Class 1 cases were properly identified. The table
covers macro, micro, and scaled averages.
Macro averages provide an unweighted code
mean of metrics across all classes, giving a broad
picture of the model's performance. For example, the
generalized average precision is 0.78 and the recall is
0.72, indicating general performance regardless of
class distribution. Micro averages aggregate
measurements globally, taking into account the
overall amount of true positives, false positives, and
false negatives, yielding a micro average F1 score of
0.77. Weighted averages account for each class's
support, resulting in metrics corrected for class
imbalance, yielding an average weighted F1 score of
0.77.
Figure 2: Confusion Matrix
Table 1: Layer Configurations
Classes
Intensit
y
Precis
ion
Reca
ll
F1-
Score
Sup
p
ort
Accu
rac
y
Class A
(0%-20)
(Healthy)
0.83 0.85 0.84 58 0.83
Class B
(
20-40%
)
0.76 0.84 0.80 60 0.75
Class C
(
40-60%
)
0.78 0.74 0.76 59 0.68
Class D
(60-80%)
0.74 0.66 0.70 50 0.70
Class E
(80-
100%
)
0.80 0.80 0.80 52 0.77
Macro
average
0.78 0.72 0.74
Weighted
avera
g
e
0.77 0.77 0.77
Micro
Avera
g
e
0.77 0.77 0.77
This complete table provides a sophisticated
picture of the model's efficacy, emphasizing both
class-specific success and overall model strength.
The following table 2 describes the structure of a
CNN that was trained to categorize ulcers in diabetic
feet into five different degrees of severity. An input
Automated Severity Classification Using Convolutional Neural Networks: A Deep Learning Approach to Diabetic Foot Ulcer Assessment
103

layer that takes 128x128x3 images is the first node in
the network. As a subsequent step, three
convolutional layers are employed, each with a
different number of filters—32, 64, and 128—that
make use of 3x3 kernel and ReLU activation features.
To improve the efficiency of feature extraction, max
layers of pooling with 2x2 kernels and an advance of
2 are applied after each convolutional layer. This
reduces the spatial dimensions.
Table 2: Parameters of different layers
Layer
types
Filter /
Neuro
ns
Kerne
l Size
Stride Output
Size
Activat
ion
Input - - - 128×1
28×3
-
Convoluti
onal Layer
1
32 3×3 1 126×1
26×32
ReLU
Max
p
ooling 1
- 2×2 2 63×63
×32
-
Convoluti
onal Layer
2
64 3×3 1 61×61
×64
ReLU
Max
p
ooling 2
- 2×2 2 30×30
×64
-
Convoluti
onal Layer
3
128 3×3 1 28×28
×128
ReLU
Max
p
ooling 3
- 2×2 2 14×14
×128
-
Flatten - - - 25088 -
Random
Forest
18
trees
- - 5
classes
-
Table 3: Insights gained through experiments
Classes
Intensity level
True
Positive
False
Positive
True
Negative
Class A (0%-20%) 50 11 171
Class B (20-40%) 47 14 171
Class C
(
40-60%
)
44 14 172
Class D
(
60-80%
)
39 11 172
Class E
(
80-100%
)
41 12 170
The resulting feature maps are compressed into a
25,088-byte vector before being fed into two dense
layers, one with 512 neurons and the other with 256
neurons, both of which use ReLU activations. A five-
neutrino network activated with a softmax function
generates a probability distribution over all five
classes in the output layer. Ulcer severity levels can be
effectively learned and classified using this organized
technique. Class A (0%-20%), Class B (20%-40%),
Class C (40%-60%), Class D (60%-80%), and Class E
(80%-100%), are the five intensity levels of diabetic
foot ulcers that the classification model was tested on.
The results are presented in the table. The data table
provides an overview of each class's TP, FP, and TN
values. Class A has excellent performance in
accurately recognizing occurrences of this class, with
50 true positives, 11 false positives, and 171 true
negatives. There are 171 true negatives, 14 true
positives, and 47 real positives in Class B, which
indicates a marginally higher false positive rate than
in Class A. Class C follows Class B's balanced
distribution with 172 true negatives, 14 false positives,
and 44 true positives. There are fewer true positives
but a more stable rate of false positives in Class D,
which has 39 TPs, 11 FPs, and 172 TNs. Class E
likewise shows a balanced performance with 170 true
negatives, 12 counterfeit positives, and 41 real
positives. With an eye on the percentage of accurate
and inaccurate predictions, this table showcases the
model's performance in detecting each intensity level.
5 CONCLUSION
Thus, the findings of this study help to envision how
the use of convolutional neural networks, or CNNs,
can improve the diagnosis and management of
diabetic foot ulcers in the diabetic patient population.
That way, we obtained high precision and recall in
distinguishing diabetic foot ulcers into five severe
stages using a methodologically built CNN model.
This led us to be able to get all of these outcomes to
happen. The model was notably precise, gaining real
positive rates of 50, 47, 44, 39, and 41 for Classes A
to E, correspondingly. Also, the model had impressive
accuracy, which was illustrated by the presented data.
The robustness and dependability of our methodology
are highlighted by the degree of performance that we
have achieved. Not only does the successful
classification make the diagnosis process more
efficient, but it also provides medical professionals
with a powerful instrument that may be used for early
detection and personalized treatment individualized
treatment planning. Through this effort, the path is
paved for the incorporation of sophisticated artificial
intelligence remedies into clinical practice, which will
ultimately lead to improved patient outcomes and will
contribute to the overarching objective of achieving
sustainable healthcare innovations.
INCOFT 2025 - International Conference on Futuristic Technology
104

REFERENCES
A. Suryavanshi, V. Kukreja, P. Srivastava, A.
Bhattacherjee, and R. S. Rawat, “Felis catus disease
detection in the digital era: Combining CNN and
Random Forest,” in 2023 International Conference on
Artificial Intelligence for Innovations in Healthcare
Industries (ICAIIHI), 2023, pp. 1–7.
A. Suryavanshi, V. Kukreja, A. Dogra, A. Bhattacherjee,
and T. P. S. Brar, “Automated Detection of Pain Across
Varied Intensity Levels Through the Fusion of CNN
and Random Forest,” in 2023 3rd International
Conference on Technological Advancements in
Computational Sciences (ICTACS), 2023, pp. 1114–
1120.
A. Suryavanshi, V. Kukreja, S. Chamoli, S. Mehta, and A.
Garg, “Synergistic Solutions: Federated Learning
Meets CNNs in Soybean Disease Classification,” in
2024 Fourth International Conference on Advances in
Electrical, Computing, Communication and
Sustainable Technologies (ICAECT), 2024, pp. 1–6.
A. Suryavanshi, V. Kukreja, S. Chamoli, S. Mehta, and A.
Garg, “A New Age for Agricultural Diagnostics:
Federated CNN for Papaya Leaf Diseases,” in 2024
IEEE International Conference on Interdisciplinary
Approaches in Technology and Management for Social
Innovation (IATMSI), 2024, pp. 1–6.
A. Suryavanshi, V. Kukreja, A. Dogra, P. Aggarwal, and
M. Manwal, “Feathered Precision: AvianVision-A
Hybrid CNN-Random Forest Approach for Accurate
Classification of Sparrow Species,” in 2024 11th
International Conference on Signal Processing and
Integrated Networks (SPIN), 2024, pp. 215–220.
A. Suryavanshi, V. Kukreja, A. Dogra, and J. Joshi,
“Advanced ABS Disease Recognition in Lemon-A
Multi-Level Approach Using CNN and Random Forest
Ensemble,” in 2023 3rd International Conference on
Technological Advancements in Computational
Sciences (ICTACS), 2023, pp. 1108–1113.
A. Suryavanshi, V. Kukreja, and A. Dogra, “Optimizing
Convolutional Neural Networks and Support Vector
Machines for Spinach Disease Detection: A
Hyperparameter Tuning Study,” in 2023 4th IEEE
Global Conference for Advancement in Technology
(GCAT), 2023, pp. 1–6.
M. Tulloch, J., Zamani, R., & Akrami, “Machine learning
in the prevention, diagnosis and management of
diabetic foot ulcers: A systematic review,” IEEE
Access, vol. 8, pp. 198977–199000, 2020.
S. C. Alshayeji, M. H., & Sindhu, “Early detection of
diabetic foot ulcers from thermal images using the bag
of features technique,” Biomed. Signal Process.
Control, vol. 79, p. 104143, 2023.
F. Munadi, K., Saddami, K., Oktiana, M., Roslidar, R.,
Muchtar, K., Melinda, M., ... & Arnia, “A deep learning
method for early detection of diabetic foot using
decision fusion and thermal images,” Appl. Sci., vol.
12(15), p. 7524, 2022.
A. Khandakar, A., Chowdhury, M. E., Reaz, M. B. I., Ali,
S. H. M., Kiranyaz, S., Rahman, T., ... & Hasan, “A
novel machine learning approach for severity
classification of diabetic foot complications using
thermogram images,” Sensors, vol. 22(11), p. 4249,
2022.
I. Gamage, C., Wijesinghe, I., & Perera, “Automatic
scoring of diabetic foot ulcers through deep CNN based
feature extraction with low rank matrix factorization,”
in 19th International Conference on Bioinformatics and
Bioengineering (BIBE), 2019, pp. 352–356.
R. A. Khandakar, A., Chowdhury, M. E., Reaz, M. B. I.,
Ali, S. H. M., Hasan, M. A., Kiranyaz, S., ... & Malik,
“A machine learning model for early detection of
diabetic foot using thermogram images,” Comput. Biol.
Med., vol. 137, p. 104838, 2021.
C. Yogapriya, J., Chandran, V., Sumithra, M. G., Elakkiya,
B., Shamila Ebenezer, A., & Suresh Gnana Dhas,
“Automated detection of infection in diabetic foot ulcer
images using convolutional neural network,” J.
Healthc. Eng., vol. 1, p. 2349849, 2022.
L. Mei, Z., Ivanov, K., Zhao, G., Wu, Y., Liu, M., & Wang,
“Foot type classification using sensor-enabled footwear
and 1D-CNN,” Meas. 165, p. 108184, 2020.
Automated Severity Classification Using Convolutional Neural Networks: A Deep Learning Approach to Diabetic Foot Ulcer Assessment
105
