
Avian Species Population Forecaster Using Machine Learning
Likhitha Morampudi
1
, Ramya Rajanala
1
and Pothuri Surendra Varma
2
1
Department of Artificial Intelligence and Data Science, Velagapudi Ramakrishna Siddhartha Engineering College,
Andhra Pradesh, India
2
Department of Computer Science and Engineering, Velagapudi Ramakrishna Siddhartha Engineering College,
Andhra Pradesh, India
Keywords: Ecosystem Dynamics, SARIMA Model, Temporal Patterns, Historical Data Analysis
Abstract: Birds help to link various ecosystems. Ecosystems like farmland, woodland, water and wetlands, wildfowl.
Migration patterns link biodiversity by facilitating gene flow, spreading seeds, transferring nutrients, and
maintaining ecological balance across different ecosystems. This research analyzed historical data of birds
from 1960 to 2015, and forecasted the future bird's population. and focused on predicting the bird's
population in various ecosystems. We employed the Seasonal Autoregressive Integrated Moving Average
(SARIMA) model is used to achieve accurate forecasting. bird population trends by integrating seasonal
and temporal patterns, thereby enhancing predictive precision for ecological monitoring and conservation
planning.
1 INTRODUCTION
Birds play a crucial role in maintaining ecological
balance by helping with pollination, spreading seeds,
controlling pests, and cycling nutrients through eco
systems. As ecological indicators, bird populations
reflect environmental health and alert us to
challenges such as climate change, habitat
destruction, and ecosystem disruptions. Accurate
forecasting of bird populations is critical for
conservation, as failure to predict declines could
lead to species extinction and ecological imbalances.
This research focuses on developing an avian
species population forecaster using the Seasonal
Autoregressive Integrated Moving Average
(SARIMA) model. With its ability to account for
both seasonality and trends in time-series data,
SARIMA is employed to predict bird populations
and provide insights for conservation strategies. This
approach aims to safeguard both biodiversity and the
ecosystem services essential to agriculture and
ecological stability.
1.1 Contribution
Development of a Bird Population Forecaster:
Introduced a SARIMA-based forecasting model
designed to capture both seasonal and long-term
trends in bird populations.
Time-Series Analysis of Bird Data: Applied
historical data to accurately predict bird population
dynamics across different habitats.
Identification of Key Environmental Stressors:
Provided insights into how climate change and
habitat loss are influencing bird populations,
enabling proactive conservation measures.
Support for Agricultural Practices: Highlighted
the importance of avian species in agriculture by
predicting the consequences of population declines
on pest control and seed dispersal. Conservation
Policy Implications: Offered actionable insights for
policymakers and conservationists to maintain
ecological balance and promote sustainable
ecosystems.
1.2 Motivation
Birds are important to ecological balance through
pollination, pest control, seed dispersal and nutrient
cycling. As ecological indicators, changes in bird
populations serve as warning signals for
environmental disruptions, including climate
change, habitat destruction, and pollution. If
conservationists fail to predict these population
changes, critical species could face extinction,
leading to cascading effects across ecosystems.
Morampudi, L., Rajanala, R. and Varma, P. S.
Avian Species Population Forecaster Using Machine Learning.
DOI: 10.5220/0013607700004664
Paper published under CC license (CC BY-NC-ND 4.0)
In Proceedings of the 3rd International Conference on Futuristic Technology (INCOFT 2025) - Volume 2, pages 929-935
ISBN: 978-989-758-763-4
Proceedings Copyright © 2025 by SCITEPRESS – Science and Technology Publications, Lda.
929

Furthermore, bird population declines could
negatively affect agriculture by increasing pests and
reducing crop yields, impacting both biodiversity
and economic stability. Therefore, timely and
accurate forecasting of bird populations is
essential
for devising proactive conservation strategies
and ensuring sustainable ecosystems.
1.3 Objectives
• Forecast Bird Populations: Develop a
model to predict future bird populations
for effective conservation planning.
• Incorporate Seasonality and Trends:
Leverage seasonal and non-seasonal
patterns in historical data to improve
prediction accuracy. • Identify
Environmental Impacts: Use forecasting to
assess how factors like climate change and
habitat loss impact different bird species.
• Support Agricultural Sustainability:
Highlight the importance of bird species in
pest control and seed dispersal to inform
agricultural strategies.
• Inform Conservation Policy: Provide
insights to environmentalists and
policymakers to develop targeted actions
for preserving bird populations and
maintaining ecosystem health.
2 RELATED WORK
2.1 Review
Christiaan Both et al. (Both, Bouwhuis, et al. , 2006)
embedded about |Population trends of Dutch pied
flycatcher populations. They proposed climate-
change-induced badly timed leads to population
declines in a migratory songbird, used linear
regression and correlation tests. In result Spearman
rank correlation was used to relate the trends in
population decline with the timing of the caterpillar
food peak, calculated the annual median laying date
from 1980–2002.
Birgit Erni et al. (Erni, Liechti, et al. , 2003)
embedded about Simulations of individual bird
migration paths across a grid-based environment,
considering fuel loads, stopovers, flight costs, and
directions. Vector Summation. The combination of
spatial modeling, vector summation (Navigation
Algorithm) constant endogenous direction,
evolutionary algorithms, and energy cost functions.
Spatially Explicit Individual-Based Model, which is
a simulation algorithm and a Directional Adaptation
Algorithm.
James A. Smith et al. (Smith, Deppe, et al. ,
2007) embedded about individual-based modeling to
predict how environmental changes might impact
migratory birds and maximum entropy model. The
focus is on predicting migration patterns by
integrating environmental data, bird physiology, and
energetics and also modeled the spring migration of
the Pectoral Sandpiper (Calidris melanotos) in North
America and observed how environmental
conditions and stopover habitat quality affect the
success of migration.
Hiromi Kobori et al. (Kobori, Kamamoto, et al. ,
2012) Using 23 years of citizen-scientist
observations, they analyzed the first arrival and final
departure dates of birds at a wintering site in
Yokohama and correlated these dates with
temperature changes. In their observations on
average, birds are arriving 9 days later and departing
21 days earlier than in the past, shortening their stay
by about one month. These changes are linked to
rising temperatures. Their study is limited to one
location in Japan, making it difficult to generalize
findings to other regions without additional data. But
our data covers whole Europe continent. During data
collection process they have used manual power
rather than using Weather Radars and Dedicated
Avian Radars. Speed Conscious Recurrent Neural
Network (Varma, Anand, et al. , 2022) and federated
KNN (Varma, Anand, et al. , 2024) also propose
efficient machine learning algorithms.
Anders P. Tøttrup1 et al. (Tøttrup, Thorup, et al.
, 2008) Utilized NDVI as a proxy for ecological
conditions, such as food availability. NDVI was
calculated for both African wintering areas and
European stopover sites to assess how vegetation
growth impacted the timing of migration. linear
mixed models to analyze the relationship between
NDVI, timing of migration, and migration duration
across different latitudes and migratory phases (first
5%, 50%, and 95% of the migrating
population).Their study divides migration into three
phases based on when portions of the population
migrate (early, mid, late) and examines the impact of
environmental conditions on these phases .It also
asserted the complexity of migration systems and
the need for further studies to distinguish between
phenotypic plasticity and evolutionary changes.
Bidirectional LSTM was proposed in (Sowmya;,
Pothuri, et al. , 2024).
Advaith S Pillai et al. (Pillai, Sathvik, et al. ,
2024) demonstrated the potential of integrating IoT
INCOFT 2025 - International Conference on Futuristic Technology
930

and ML techniques in wildlife conservation, helping
address challenges like habitat loss and urbanization
that make traditional bird monitoring difficult.
Researchers mainly considered bird species like
Eurasian Curlew, Blue-tailed Bee-eater, and others
found in Kerala, India. Mel-Frequency Cepstral
Coefficients (MFCCs) for extracting features from
bird calls. Additional feature extraction techniques
include Δ and ΔΔ MFCCs, which are derived from
MFCCs to capture changes in frequency over time.
ANN architecture consists of 4 dense sequential
layers and is used for multi-class classification of
bird sounds. The CNN architecture includes three
2D convolutional layers with different filter sizes to
detect bird images for classification. They have
utilized some IOT devices like Raspberry Pi, to
collect and process data from sensors (cameras and
microphones), transmitting it to the cloud for further
research. Microphones capture bird calls, and
cameras capture images of birds for classification.
Standard Scaling to normalize feature data for the
ML model. Applied Principal Component Analysis
(PCA) to reduce the dimensionality of the feature
space before feeding it into the ML model. Aspired
to involve, integration of Long Short-Term Memory
(LSTM) with the Recursive Neural Network (RNN)
to treat bird calls as time-series data, which can
improve classification accuracy and combining both
image (CNN) and audio (ANN) classification results
is suggested to further enhance the performance of
the system.
A semi centralized architecture is proposed in
(Varma, Anand, et al. , 2023) for efficient prediction
using machine learning. Multivariate regression is
used in (Varma, Anand, et al. , 2023). Some of the
interrupting issues are Noise Interference, Multiple
Bird Calls, Lighting Conditions which affects the
quality of the images captured. Movement of Birds
(high frame rates and image resolution are needed,
which adds complexity to the system design). Power
consumption of microphones, cameras, and
processing units can be a challenge, especially for
long-term deployments.
Jianxi Zhang et al. (Zhang, Shao, et al. , 2018) in
their research Density-Based Spatial Clustering of
Applications with Noise (DBSCAN) algorithm,
focuses on identifying spatial patterns of bird
habitats and uncovering clusters of bird presence
from geospatial data, improving the understanding
of bird distribution. It detects clusters based on
proximity and density. Parameter Tuning, to
optimize the DBSCAN algorithm, careful selection
of parameters like ε (radius) and MinPts (minimum
points). One of the key strengths of DBSCAN is its
ability to identify noise or outliers and works well
with large datasets, which is an advantage when
dealing with extensive geospatial data. But it may
not accurate on Handling High-Dimensional Data,
Parameter Sensitivity, Less Quality Data.
3 METHODOLOGY
In this study, we employed the SARIMA (Seasonal
Auto Regressive Integrated Moving Average) model
for predicting bird population trends based on
historical data. The dataset, stored in a CSV file,
consisted of a Date column representing the timeline
and a Value column indicating bird population
counts. During data preprocessing, missing values
were handled using mean imputation to ensure
consistency, and the dataset was cleaned to align
with the model’s requirements. The SARIMA model
was chosen for its capability to capture both
seasonal variations and long-term trends, making it
suitable for time series forecasting. We used the
Akaike Information Criterion (AIC) and Bayesian
Information Criterion (BIC) to optimize the non-
seasonal (p,d,q) and seasonal parameters (P,D,Q,m)
with minimal error of the forecast. Model training
was performed using the statsmodels library in
Python, leveraging data from 1970 to 2015 to build
the model. Monthly forecasts were generated for 12
months of 2016, allowing the model to capture
short-term seasonal fluctuations.These forecasts
were aggregated to obtain the annual predicted
population value by averaging the individual
monthly forecasts. Visualizations comparing
forecasted values with actual data were created using
matplotlib to identify trends, patterns, and
discrepancies. Additionally, a flowchart depicting
the entire process from data collection to forecast
generation was included to enhance clarity. The
methodology was designed to be replicable, with all
steps, libraries, and tools—such as Python, pandas,
statsmodels, and matplotlib—documented. Also,
evaluation metrics like MAE — Mean Absolute
Error and RMSE — Root Mean Squared Error were
regarded to evaluate model effectiveness and verify
forecasts accurateness. A flowchart illustrating the
SARIMA model is provided in Fig 1.
Avian Species Population Forecaster Using Machine Learning
931
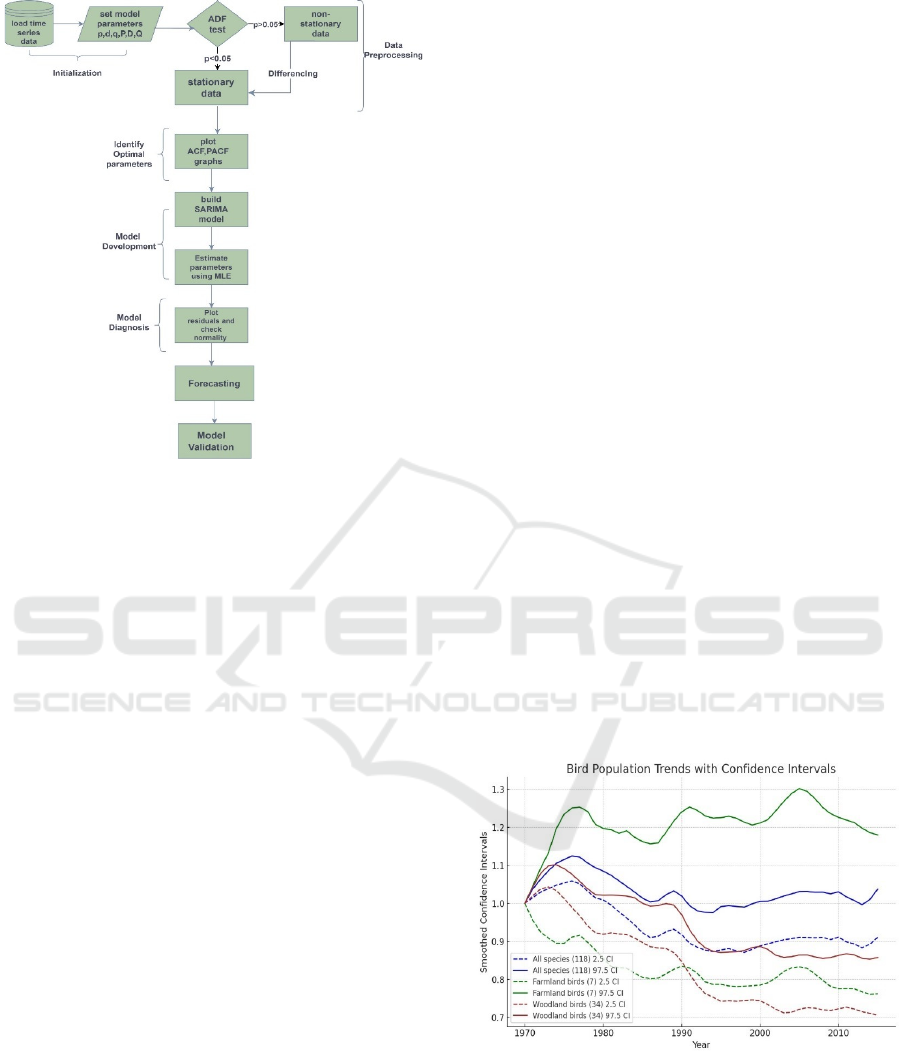
Figure.1: Flowchart of SARIMA Algorithm
3.1 Dataset details
The dataset used in model for predicting the birds
population using time series forecasting contains the
yearly data across various habitats like woodland,
farmland, water and wetland. The data was taken
from (European Environment Agency, 2024)
contains the data from year 1970 to 2015. The
values in this dataset are normalized such that the
initial population for each habitat is set to 1, and
subsequent values are represented as ratios relative
to this initial population. The dataset contains three
main variables year, habitat, and population count.
The dataset contains bird population counts
expressed as ratios, with the initial value for each
habitat type set as 1.
This approach allows for straightforward
comparative analysis, enabling us to track relative
changes in population over time across different
habitats. By using this normalized data, we can more
effectively assess the impacts of various ecological
factors on bird populations.
This study utilizes a comprehensive dataset that
includes bird population records from 1970 to 2015.
In total, there are 368 records encompassing various
categories of birds. These categories include all
species, woodland birds (which are further divided
into all, specialist, and generalist), farmland birds
(comprising all and generalist), wetland birds, and
wildfowl. It is important to note that the dataset
contains missing values for water and wetland
habitats, as well as wildfowl habitats. To address
this issue, missing values have been replaced with
mean values, ensuring continuity in the analysis.
This approach allows for consistent comparison of
trends across different habitats.
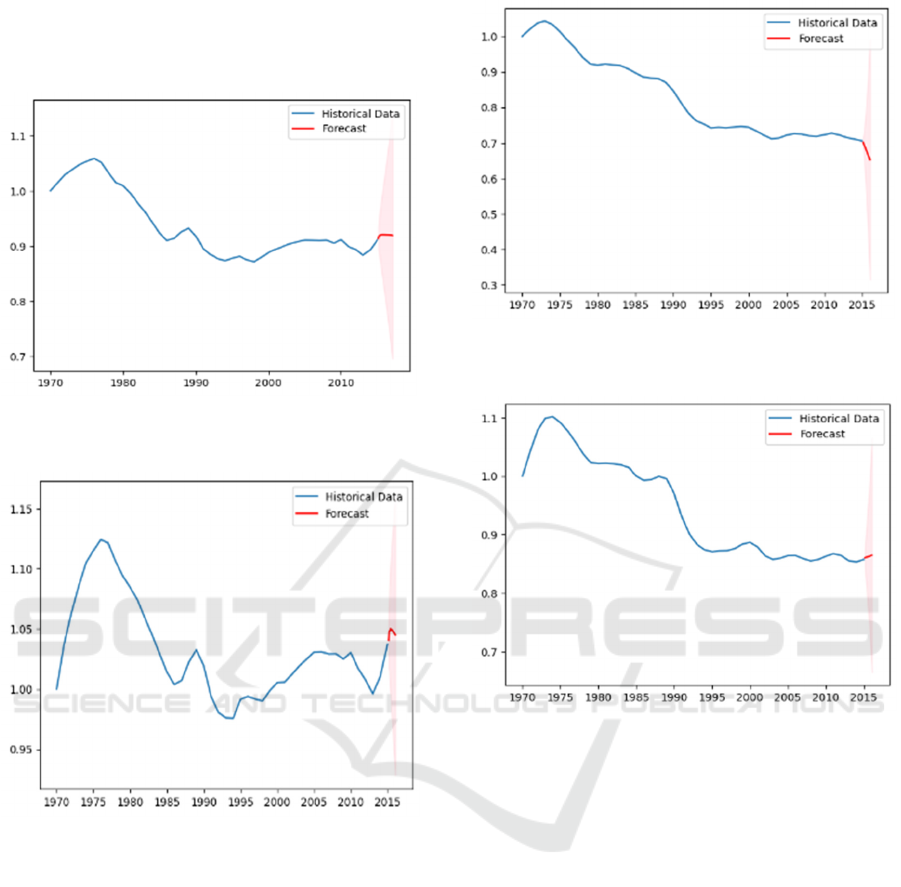
In this study, we leveraged both the smoothed
2.5 confidence interval (CI) and the smoothed 97.5
CI derived from our dataset to enhance the accuracy
and reliability of our predictions regarding bird
populations. bound for our predictions, indicating
the maximum expected population. This information
is valuable for understanding the best-case scenarios
and planning for optimal conservation strategies. By
incorporating both the lower and upper confidence
intervals, we aimed to capture a comprehensive
range of uncertainty in our forecasts. To train our
predictive model, The smoothed 2.5 CI served as a
critical lower bound, allowing us to identify the
potential minimum expected population, which is
essential for assessing risks related to population
decline. This interval highlights scenarios where
intervention may be necessary to prevent further
decreases in species numbers. Conversely, the
smoothed 97.5 CI provided an upper we included
both the 2.5 CI and 97.5 CI as features, alongside
the smoothed population estimates.
This approach allowed us to account for the
variability in the data and provided a more nuanced
understanding of potential outcomes. The model’s
predictions, enriched by these confidence intervals,
facilitate informed decision making in conservation
efforts, enabling us to allocate resources effectively
and develop strategies that address both risks and
opportunities in bird population management.
Figure.2:Bird population trends with Confidence Intervals
4 RESULT ANALYSIS
We present the findings from our SARIMA model
analysis, which predicted monthly bird populations
across different habitats—farmland, woodland, and
INCOFT 2025 - International Conference on Futuristic Technology
932
wetland. The model effectively captured population
dynamics, as illustrated in Figures 3-8, where we
observe notable trends and fluctuations supported by
confidence interval.
Figure 3: Forecasted Values and Confidence Intervals for
All Birds: 2.5% range
Figure 4: Forecasted Values and Confidence Intervals for
All Birds: 97.5% range
The forecasting results from the SARIMA model
for the "all birds" column in the dataset indicate a
range of values defined by the 2.5% and 97.5%
confidence intervals (CIs). The lower bound (2.5%
CI) shows a stable trend, with values ranging from
0.9135 in the first month to 0.9198 by the twelfth
month, resulting in an average of approximately
0.9195. In contrast, the upper bound (97.5% CI)
exhibits a slight decline, starting at 1.0406 and
decreasing to 1.0451, yielding an average of about
1.0475. This analysis underscores the relative
stability in the "all birds" data, with the upper and
lower bounds illustrating the inherent uncertainty in
forecasting process.
Figure 5: Forecasted Values and Confidence Intervals for
Woodland Column: 2.5% range
Figure 6: Forecasted Values and Confidence Intervals for
Woodland Column: 97.5% range
The forecasting results from the SARIMA model
for the woodland column in the dataset indicate a
range of values represented by the 2.5% and 97.5%
confidence intervals (CIs). The lower bound (2.5%
CI) shows a declining trend, with values decreasing
from 0.7017 in the first month to 0.6528 by the
twelfth month, averaging approximately 0.6784. In
contrast, the upper bound (97.5% CI) exhibits a
slight increase, ranging from 0.8603 to 0.8646, with
an average of about 0.8621. This analysis highlights
the notable variation in the woodland data, with the
confidence intervals reflecting the inherent
uncertainty in the forecasting process.
Avian Species Population Forecaster Using Machine Learning
933
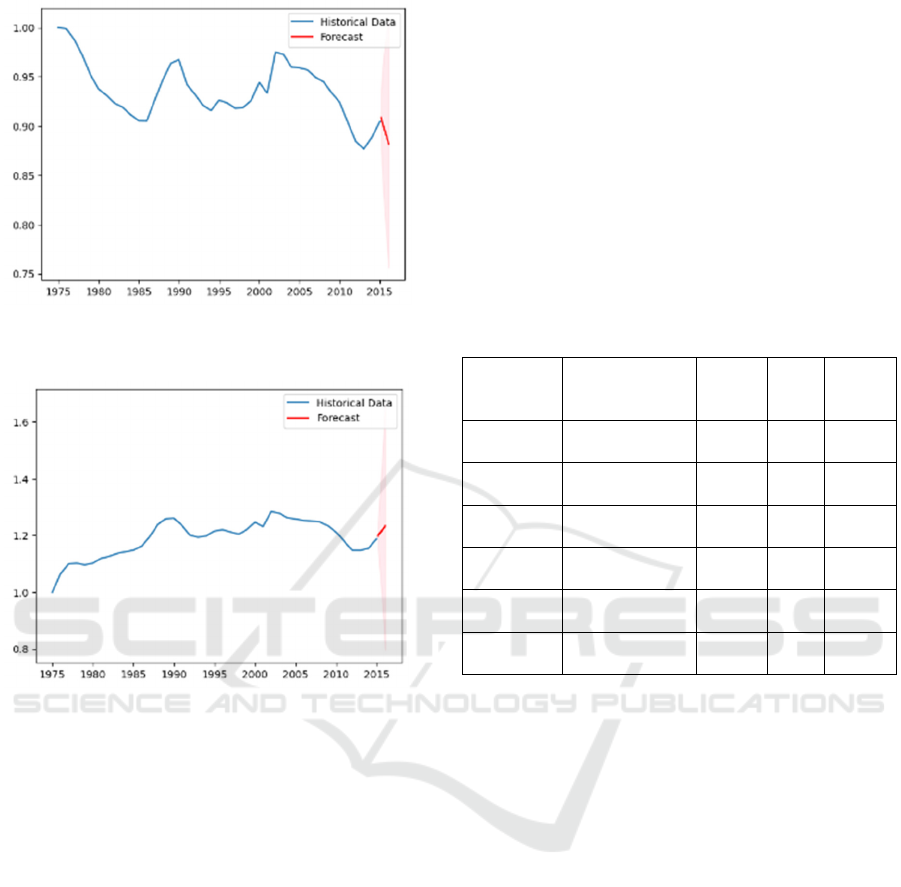
Figure 7: Forecasted Values and Confidence Intervals for
Water and Wetland Column: 2.5%
Figure 8: Forecasted Values and Confidence Intervals for
Water and Wetland Column: 97.5%
The forecasting results from the SARIMA model
for the woodland column in the dataset indicate a
range of values represented by the 2.5% and 97.5%
confidence intervals (CIs). The lower bound (2.5%
CI) shows a declining trend, with values decreasing
from 0.7017 in the first month to 0.6528 by the
twelfth month, averaging approximately 0.6784. In
contrast, the upper bound (97.5% CI) exhibits a
slight increase, ranging from 0.8603 to 0.8646, with
an average of about 0.8621. This analysis highlights
the notable variation in the woodland data, with the
confidence intervals reflecting the inherent
uncertainty in the forecasting process.
5 CONCLUSIONS
This study successfully utilized the SARIMA model
to forecast bird population trends across diverse
ecosystems, analyzing historical data from 1960 to
2015. The results, supported by various validation
metrics, underscore the model's effectiveness in
capturing seasonal and temporal patterns, thereby
enhancing predictive accuracy for avian populations.
Despite the insights gained, challenges remain,
including the need for more comprehensive datasets
and the integration of real-time environmental
factors. Future research should address these gaps to
further refine forecasting methods and improve
conservation strategies. The inclusion of a metrics
table in this study highlights the model's
performance and provides a foundation for
comparing future methodologies in bird population
forecasting.
Table 1
HABITA
T
CONFIDENC
E
INTERVAL
MAE
RS
ME
MAPE
All
S
p
ecies
2.5 CI
0.029
7
0.03
46
3.3112
All
Species
97.5 CI 0.041
0.04
78
4.0423
Wood
Lan
d
2.5 CI
0.008
0.00
89
1.0994
Wood
Lan
d
97.5 CI 0.004
7
0.00
59
0.5509
Water
Wetlan
d
2.5 CI 0.011
4
0.01
41
1.2662
Water
Wetlan
d
97.5 CI 0.019
7
0.02
21
1.6577
REFERENCES
C. Both, S. Bouwhuis, C. Lessells, and others, "Climate
change and population declines in a long-distance
migratory bird," Nature, vol. 441, pp. 81–83, 2006.
[Online]. Available:
https://doi.org/10.1038/nature04539.
B. Erni, F. Liechti, and B. Bruderer, "How does a first
year passerine migrant find its way? Simulating
migration mechanisms and behavioural adaptations,"
OIKOS, vol. 103, pp. 333–340, 2003.
https://doi.org/10.1034/j.1600-0706.2003.12176.x.
J. A. Smith and J. L. Deppe, "Simulating bird migration
using satellites and biophysics," in Proc. IASTED
Symposium on Environmental Modeling and
Simulation, vol. 509, pp. 6–11, Aug. 2007.
H. Kobori, T. Kamamoto, H. Nomura, and others, "The
effects of climate change on the phenology of winter
birds in Yokohama, Japan," Ecological Research, vol.
27, pp. 173–180, 2012.
https://doi.org/10.1007/s11284-011-0891-7.
Varma, P.S., Anand, V., ”Fault-Tolerant indoor
localization based on speed conscious recurrent neural
network using Kullback– Leibler divergence”, Peer-
INCOFT 2025 - International Conference on Futuristic Technology
934

to-Peer Netw. Appl. 15, 1370–1384. 2022.
https://doi.org/10.1007/s12083-022-01301-y.
P. Surendra Varma, V. Anand and P. K. Donta, ”Federated
KNNBased Privacy-Preserving Position
Recommendation for Indoor Consumer Applications,”
in IEEE Transactions on Consumer Electronics, vol.
70, no. 1, pp. 2738-2745, 2024.
doi:10.1109/TCE.2023.3329391.
A. P. Tøttrup, K. Thorup, K. Rainio, R. Yosef, E.
Lehikoinen, and C. Rahbek, "Avian migrants adjust
migration in response to environmental conditions en
route," Biology Letters, vol. 4, no. 6, pp. 685–688,
Dec. 2008. https://doi.org/10.1098/rsbl.2008.0290.
Markapudi Sowmya; Pothuri, Surendra Varma; Katarapu
Deepika. “Emotion recognition from EEG signal data
of the brain using bidirectional long short-term
memory”, International Journal of Advanced
Technology and Engineering Exploration, Vol. 11, Iss.
115, pp. 930-942, 2024.
DOI:10.19101/IJATEE.2023.10102441.
A. S. Pillai, S. U. Ajay Sathvik, N. B. Sai Shibu, and A.
Remanidevi Devidas, "Monitoring urban wetland bird
migrations using IoT and ML techniques," in 2024
IEEE 9th International Conference for Convergence in
Technology (I2CT), Pune, India, 2024, pp. 1–7. doi:
10.1109/I2CT61223.2024.10543277
Varma, P.S., Anand, V. ”Intelligent scanning period
dilation based Wi-Fi fingerprinting for energy efficient
indoor positioning in IoT applications”. J
Supercomput 79, 7736–7761. 2023.
https://doi.org/10.1007/s11227-022-04980-9
Varma, P.S., Anand, V. ”ReMAPP: reverse multilateration
based access point positioning using multivariate
regression for indoor localization in smart buildings”.
Telecommun Syst 83, 303–322. 2023.
https://doi.org/10.1007/s11235-023-01021-5
J. Zhang and Z. Shao, "Research on bird habitat discovery
based on DBSCAN algorithm," in 2018 Eighth
International Conference on Instrumentation &
Measurement, Computer, Communication and Control
(IMCCC), Harbin, China, 2018, pp. 746–750. doi:
10.1109/IMCCC.2018.00161.
S. R. Archer, "Regulation of ecosystem structure and
function: climatic versus non-climatic factors," in
*Meteorology*, J. F. Griffiths Ed., Oxford, U.K.:
Oxford University Press, 1994, pp. 245-255.
K. Balevičius, *Red Data Book of Lithuania*. Vilnius,
Lithuania: Environmental Protection Department of
the Republic of Lithuania, 1992, p. 368.
R. G. B. Brown, "Marine birds and climatic warming in
the northwest Atlantic," in Studies of High-Latitude
Seabirds. 1. Behavioural, Energetic, and
Oceanographic Aspects of Seabird Feeding Ecology,
W. A. Montevecchi and A. J. Gaston, Eds., Occasional
Paper no. 68. Ottawa, Canada: Canadian Wildlife
Service, 1991, pp. 49–54.
G. Rheinwald, "Population counts in the White Stork
Ciconia ciconia," in Bird Numbers 1992. Distribution,
Monitoring and Ecological Aspects, E. J. M.
Hagemeijer and T. J. Verstrael, Eds. Beek-Ubbergen,
Netherlands: SOVON, 1994, pp. 163–168.
L. V. Sokolov and V. A. Payevsky, "Spring temperatures
influence year-to-year variations in the breeding
phenology of passerines on the Courish Spit, eastern
Baltic," Avian Ecology and Behaviour, vol. 1, pp. 22–
36, 1998.
Žalakevičius, M. (1999). Global Climate Change Impact
on Bird Numbers, Population State and Distribution
Areas. Acta Zoologica Lituanica, 9(1), 78–89.
https://doi.org/10.1080/13921657.1999.10512266
M. Zalakevicius and R. Zalakeviciute, "Global climate
change impact on birds: A review of research in
Lithuania," Folia Zoologica, vol. 50, no. 1, pp. 1–17,
2001.
S. K. Skagen, "Migration stopovers and the conservation
of Arctic-breeding Calidridine sandpipers," The Auk,
vol. 123, no. 2, pp. 313–322, Apr. 2006. [Online].
Available: https://doi.org/10.1093/auk/123.2.313.
European Environment Agency, Wild Bird Populations in
England [Data set], European Union Open Data Portal,
2024. Available:
https://data.europa.eu/data/datasets/wild_bird_populati
ons_in_england/embed?locale=en
Avian Species Population Forecaster Using Machine Learning
935
