
Cauliflower Disease Identification Using Deep Learning Techniques
Abhijeet Rachagoudar, Ashutosh Gebise, Lalitkumar Solapure, Prasanna Shirahatti and Veena Badiger
Department of Computer Science and Engineering, KLE Technological University’s Dr. M. S. Sheshgiri Campus, Belagavi,
India
Keywords:
Deep Learning, CNN, Cauliflower Diseases, Precision Agriculture, Image Classification, Machine Learning.
Abstract:
This paper presents a machine learning-based approach for the identification of diseases in cauliflower plants
using deep learning techniques. The model, based on a CNN architecture, achieves high accuracy in classify-
ing cauliflower diseases into four categories: Bacterial Spot Rot, Black Rot, Downy Mildew, and No Disease.
The preprocessing is very comprehensive, including image resizing, normalization, and data augmentation,
which enhances the model’s ability to generalize. F1-score, precision, and recall are some of the evaluation
metrics to ensure a proper assessment of the model’s performance. The proposed solution will be helpful for
farmers in early disease detection, thereby ensuring effective crop management and agricultural productivity.
In addition, the study explores patterns and provides insights into potential enhancements through advanced
architectures and dataset expansion. The results have proved that the model has an accuracy of 96.96%, thus it
can be very useful in its practical world applications. Future work involves real-time monitoring systems and
incorporation of domain-specific knowledge for robust disease diagnosis. Findings therefore stress the impor-
tance of automated solutions in the precision agriculture area, holding potential for large-scale deployment
in agricultural sectors. This study would lay the ground for further studies on the usage of AI-based tools in
sustainable agriculture.
1 INTRODUCTION
Cauliflower diseases are a severe threat to agricultural
productivity, thus resulting in significant economic
loss and negatively impacting food security. Not only
does it reduce the yield of crops, but its quality also
goes down, thus becoming unsuitable for consump-
tion or market sale. Timely and accurate identifica-
tion of symptoms is the most important criterion for
effective management of these diseases to implement
specific treatment and control infection spread. How-
ever, disease detection through conventional methods
is carried out mainly through manual inspection by
experts, a labor-intensive, time-consuming procedure
prone to human errors. Besides, the dearth of enough
expertise and facilities in rural and remote farming ar-
eas makes the matter worse, so that farmers fail to
cope with outbreaks.
Artificial intelligence (AI) and machine learn-
ing (ML) have opened various frontiers for solving
complex problems across multiple domains, includ-
ing agriculture. Deep learning comes in particu-
larly promising due to its potential for high volumes
of complex image data and extracting patterns out
of them. The success in image classification, ob-
ject detection, and segmentation using deep learn-
ing techniques, particularly convolutional neural net-
works (CNNs), makes it highly applicable to plant
disease identification. CNNs can detect fine-grained
visual features from images of plants and identify dif-
ferent diseases or even subtle symptom variations.
Despite the great strides in AI-driven plant dis-
ease detection, several challenges persist. Existing
approaches usually have difficulties in establishing
generalizability across different environmental condi-
tions, including lighting and plant morphology vari-
abilities. Additionally, imbalanced datasets and the
insignificant difference between symptoms from dis-
eases further make them complicated for models
to differentiate with high sensitivity and specificity.
Thus, these challenges call for effective preprocess-
ing techniques, state-of-the-art architectures, and ex-
tensive evaluation metrics to achieve real-world per-
formance. Moreover, the scarcity of large-scale, pub-
licly available datasets severely limits the capability
of the models to learn rich patterns and generalize to
a variety of settings. Overcoming these limitations is
imperative to make a transition from experimental se-
tups to scalable solutions deployable in the fields of
agriculture.
Rachagoudar, A., Gebise, A., Solapure, L., Shirahatti, P. and Badiger, V.
Cauliflower Disease Identification Using Deep Learning Techniques.
DOI: 10.5220/0013603300004664
Paper published under CC license (CC BY-NC-ND 4.0)
In Proceedings of the 3rd International Conference on Futuristic Technology (INCOFT 2025) - Volume 2, pages 827-833
ISBN: 978-989-758-763-4
Proceedings Copyright © 2025 by SCITEPRESS – Science and Technology Publications, Lda.
827

This paper provides a CNN-based method for au-
tomated classification of four categories of diseases:
Bacterial Spot Rot, Black Rot, Downy Mildew, and
No Disease on cauliflower. Advanced preprocess-
ing techniques have been used for handling the dif-
ficulties presented by the imbalanced dataset and the
diversity of the environment. CNN architecture is
used to achieve high classification accuracy, and the
evaluation metrics like F1-score, precision, and re-
call provide a detailed assessment of the model’s per-
formance. The proposed approach aims to minimize
manual intervention by automating the disease detec-
tion process, reducing the time required for diagno-
sis, and assisting farmers in taking timely action to
manage crop health effectively. This study has also
contributed toward the growing library of research
pertaining to AI use in precision agriculture, provid-
ing clues for further augmentation through advanced
models and larger sets of data.
The paper is organized as follows. Section II pro-
vides a brief review of the literature survey on recent
works. Section III suggests the proposed methodol-
ogy and implementation, detailing the approach and
techniques employed. Section IV discusses the re-
sults and their analysis. Finally, the paper concludes
in Section V, summarizing the findings and future di-
rections.
2 LITERATURE SURVEY
Several studies have explored machine learning and
deep learning approaches for plant disease detection.
Recent advancements include:
(Kumar et al.(2024)) presented a paper using a
modified YOLOv8 model for the detection and local-
ization of diseases in cauliflower. The approach had
a high precision of 93.2% and mAP of 91.1% with
segmentation and classification of the disease region.
However, it needs high-quality annotated datasets that
restrict its scalability to various conditions.
(Gupta et al.(2023)) introduced EfficientNetB1 for
the detection of cauliflower diseases at early stages.
The transfer learning-based approach tested a few
deep learning models, which was validated at 99.90%.
However, the method is highly computationally in-
tensive and requires significant resources to deploy in
real-time.
(Raj et al.(2021)) implemented Random Forest,
SVM, and k-NN algorithms for automatic disease
identification of cauliflower leaves. Random For-
est achieved 90% accuracy, demonstrating flexibility.
However, the methodology required extensive prepro-
cessing of the dataset and was computationally expen-
sive.
(Banerjee and Rath(2021)) proposed a method
using digital image processing techniques to diag-
nose cauliflower leaf diseases. While the system
performed well in controlled environments, it strug-
gled to generalize due to the variability in real-world
datasets.
(Desai et al.(2021)) compared various classifiers,
namely Random Forest and SVM, for cauliflower dis-
ease detection. Random Forest achieved 89% accu-
racy and proved efficient. However, its performance
was weaker than deep learning models, as it relied en-
tirely on handcrafted features.
(Bhargava et al.(2024)) applied a fine-tuned CNN
architecture incorporating ResNet and VGG for the
classification of cauliflower diseases. These ap-
proaches achieved over 92% classification accuracy
but required a GPU for efficient training and deploy-
ment.
(Kumar et al.(2023)) conducted a study on various
deep learning approaches for cauliflower disease de-
tection, evaluating architectures such as ResNet and
EfficientNet. However, the study lacked experimental
validation despite offering valuable insights.
(Das et al.(2023)) introduced a graph neural net-
work (GNN) approach that leveraged spatial relation-
ship information for cauliflower disease prediction.
This improved prediction accuracy by incorporating
spatial dependencies but increased model complexity
and required extensive preprocessing.
(Roy et al.(2022)) applied transfer learning us-
ing a CNN for classifying surface defects in fresh-
cut cauliflower. The approach demonstrated high ac-
curacy in defect classification and reduced wastage.
However, it was limited to detecting surface defects
and did not address other disease types.
(Chaudhary et al.(2020)) combined image pro-
cessing techniques with machine learning algorithms
for cauliflower disease detection. The methodology
relied on robust image preprocessing to achieve
competitive accuracy. However, inconsistent prepro-
cessing quality affected the results.
The reviewed studies demonstrate significant
progress in leveraging advanced computational mod-
els for cauliflower disease classification. However,
the need for better datasets and optimized models re-
mains unattended, paving the way for further research
to improve accuracy and scalability in real-world ap-
plications.
INCOFT 2025 - International Conference on Futuristic Technology
828

Table 1: A Comprehensive Literature Survey of Publications on disease detection
Paper. No. Dataset Size Accuracy Model Used Limitations
(Kumar
et al.(2024))
4500 labeled im-
ages for train-
ing, validation,
and testing
YOLOv8
Precision
= 93.2%,
mAP =
91.1%
YOLOv8 Requires high-quality annotated datasets and is
computationally expensive.
(Gupta
et al.(2023))
2000 images
of diseased and
healthy plants
Validation
Accuracy
= 99.90%
EfficientNetB1 High computational resources required for de-
ployment.
(Raj
et al.(2021))
1000 images
with 4 disease
categories
Random
Forest =
∼90%
Random Forest,
SVM, k-NN
Extensive data preprocessing and computa-
tional intensity.
(Banerjee
and
Rath(2021))
800 leaf images
of diseased
cauliflower
∼88% in
controlled
environ-
ments
Digital Image
Processing
Techniques
Struggles with generalization in real-world
datasets due to variability.
(Desai
et al.(2021))
1500 images
split across 3
disease types
Random
Forest =
∼89%
Random Forest,
SVM
Lower performance than deep learning models
and dependency on handcrafted features.
(Bhargava
et al.(2024))
5000 images of
healthy and dis-
eased plants
ResNet
= 92.4%,
VGG =
91.7%
ResNet, VGG Requires GPUs for efficient training and de-
ployment.
(Kumar
et al.(2023))
Survey paper
with no dataset
experimentation
Insights
into deep
learning
accuracy
trends
ResNet, Effi-
cientNet
Lacks experimental validation for specific
cases.
(Das
et al.(2023))
1200 images
with spatial
annotations
Enhanced
accu-
racy with
spatial re-
lationships
Graph Neu-
ral Networks
(GNN)
Complex implementation and significant pre-
processing effort required.
(Roy
et al.(2022))
1000 images of
cauliflower with
surface defects
High accu-
racy in de-
fect detec-
tion
Transfer Learn-
ing with CNN
Focused solely on surface defects, ignoring
other disease types.
(Chaudhary
et al.(2020))
800 images
of cauliflower
plants
∼85%
accuracy
with image
prepro-
cessing
Image Pro-
cessing with
Machine Learn-
ing
Inconsistent preprocessing quality affects re-
sults.
3 PROPOSED METHODOLOGY
This study will approach disease identification for
cauliflower with a multi-stage process that can facil-
itate proper and efficient identification. Data acqui-
sition forms the basis of the study as it involves us-
ing a well-prepared dataset consisting of 656 high-
resolution images. Images used in this research are
classified into four classes, including Bacterial Spot
Rot, Black Rot, Downy Mildew, and No Disease. Pre-
processing of the dataset to ensure uniformity is car-
ried out, and data augmentation with the goal of class
balancing and simulation of variability in real condi-
tions is applied. The architecture and design of the
CNN are optimized so that features learned from such
data would be robust for classification across envi-
ronmental variations. The entire process is analyzed
stringently using metrics such as accuracy, precision,
and recall to ensure the applicability of the model.
Figure 1 presents sample images related to four
different classes of diseased cauliflowers. These in-
clude the images of diseases such as Bacterial Spot
Rot, Black Rot, Downy Mildew, and No Disease.
These pictures also show how much diversity exists
in the data set for the training of CNN.
The source of this study’s dataset comes from
agricultural fields and research institutions; hence, the
leaf health, growth stages, and environments change.
Cauliflower Disease Identification Using Deep Learning Techniques
829

Figure 1: Examples of Cauliflower Diseases: Bacterial Spot
Rot, Black Rot, Downy Mildew, and No Disease.
Images in bright, overcast, as well as shaded light-
ing conditions have been taken to simulate farming
conditions. The dataset requires proper labeling by
discrimination of disease symptoms, which appear
nearly alike, such as Black Rot and Bacterial Spot
Rot. Thus, expert annotation is required.
Figure 2: Proposed CNN Architecture for Cauliflower Dis-
ease Classification.
Images were preprocessed for the CNN model by
resizing to 75 × 75 pixels for uniformity and disease
detail preservation. Normalization scaled pixel values
to [0, 1], aiding efficient training and avoiding gradi-
ent issues. Rotation, flipping, zooming, and bright-
ness adjustment were used to increase the size and
variability of the dataset so that the model could gen-
eralize well across conditions.
Fig. 2 presents the proposed CNN architecture for
cauliflower disease classification. It consists of con-
volutional layers for feature extraction and fully con-
nected layers for classification. The design is aimed
to balance efficiency with accuracy while emphasiz-
ing the features related to diseases.
A custom CNN architecture was proposed with
convolutional layers that employ kernels of size 3 × 3
for hierarchical feature extraction. Activation func-
tions, in the form of ReLU, introduced non-linearity
into the model, so it could learn complex relation-
ships between data. Training stability was obtained
through batch normalization, which normalizes inputs
into each layer. Max pooling reduces spatial dimen-
sions to retain important features while lowering the
computational cost of the model. Dropout regular-
ization helped avoid overfitting, allowing the model
to generalize well for unseen data. The fully con-
nected layers aggregated the features extracted by the
convolutional layers, and the final output layer used
softmax activation for multi-class classification. Op-
timizing the model with the Adam optimizer ensures
the advantages of adaptive learning rates and momen-
tum converge to optimize the weights. The categor-
ical cross-entropy loss function measures the differ-
ence between the predicted labels and actual labels
that suits the multi-class problem.
All of these-accuracy, precision, recall, and loss-
represent the critical metrics measuring the perfor-
mance of the model at unseen test data. Accuracy
measures overall correctness, and precision and recall
measure the capacity of the model to classify relevant
instances correctly and avoid false negatives. Loss is
typically understood as a measure of error existing be-
tween predictions and actual values. All these metrics
ensure that the model generalizes robustly and thus
can be relied upon to function consistently in real-
world applications while pointing out areas for im-
provement.
Feature map visualizations are shown to improve
the interpretability by showing where the model fo-
cuses when making a classification. The map does
confirm that the model is indeed focused on the
disease-relevant areas, and this validation adds more
confidence to the predictions made by the model.
The validation further enhances the practicality of the
model in an agricultural setting because its outputs
correspond to real-world needs and add insight for
further refinements to enhance accuracy and reliabil-
ity.
The training and evaluation processes were de-
signed to maximize the performance of the model
with robustness and minimal overfitting. The Adam
optimizer was used with an initial learning rate of
while categorical cross-entropy loss was used as it
was the most suitable loss function for handling
multi-class classification tasks. Early stopping was
used to stop the training process when the valida-
tion loss didn’t improve for 10 epochs consecutively,
hence helping in generalization. The data was split
90% for training and 10% for testing, so that enough
data was available for reliable testing. More than one
performance measure was considered to analyze the
overall performance of the model. Accuracy indicated
INCOFT 2025 - International Conference on Futuristic Technology
830

the percentage of correctly classified samples while
precision indicated the percentage of true positives
over the total number of positive predictions made.
The Recall evaluated true positive identified percent
as well as F1 score because the former one is calcu-
lated from the harmony of precision, recall. Due to
this proper measurement, true evaluation was reached
without any further efforts.
4 RESULTS AND DISCUSSION
The model demonstrated robust performance across
various metrics, as shown in Table 2.
Table 2: Performance Metrics
Metric Accuracy Loss Precision Recall
Value 96.96% 0.180 95.8% 95.8%
From Fig. 3, accuracy graph showcases the
model’s excellent learning ability over time, with
both training and validation accuracies improving
steadily. The training accuracy rapidly reaches
near-perfect values, and the validation accuracy also
follows a stable upward trend with an impressive
range of approximately 85% to 90%. The overall
high accuracy indicates that the model is generalizing
well to unseen data, making it highly effective for
classification tasks.
From Fig. 4, it is observed that the graph indicates
a significant reduction in both training and validation
loss as the model learns over epochs. The training
loss decreases steadily, reflecting the model’s im-
proved prediction accuracy on the training data. The
stable validation loss shows that the model maintains
good generalization without overfitting, making it
reliable for real-world applications.
From Fig. 5, the graph illustrates the model’s abil-
ity to make accurate positive predictions. The train-
ing precision reaches very high values, while the vali-
dation precision improves steadily and stabilizes over
time.
This indicates that the model successfully mini-
mizes false positives, which is critical in applications
requiring high prediction accuracy.
From Fig. 6, we can infer about the model’s
capability to identify relevant instances accurately.
The training recall quickly reaches high values,
and the validation recall follows a steady upward
trend. The model’s strong recall performance ensures
Figure 3: Accuracy vs Epochs curve
that most positive samples are correctly identified,
making it suitable for tasks where minimizing false
negatives is essential.
The prediction results in TABLE 4 demonstrate
the model’s ability to accurately classify plant dis-
eases across diverse scenarios. In prediction1 and pre-
diction5, bacterial spot rot is correctly identified with
high probabilities of 0.99, showcasing the model’s
consistency in detecting specific diseases. For pre-
diction2, the model successfully predicts a healthy
(no disease) sample with 0.99 confidence, reflecting
its reliability in distinguishing diseased and healthy
crops.
In prediction3, black rot is detected with a
confidence of 0.91, even in the presence of minor
visual noise, which highlights the model’s robustness
and resilience to challenging inputs. Similarly,
prediction4 and prediction6 illustrate its precision in
identifying downy mildew, with probabilities of 0.99
and 1.0, respectively. These results underline the
model’s strong generalization performance, as it han-
dles various disease types effectively. Additionally,
the high-confidence predictions across all samples
suggest that the model can confidently minimize both
false positives and false negatives, ensuring reliable
outcomes in critical scenarios. This high accuracy
and precision make the model highly suitable for
real-world agricultural applications, where early and
accurate disease identification is critical for timely
intervention and improved crop management. By
leveraging this model, farmers can achieve better
disease control, reduce crop losses, and improve
overall agricultural productivity.
Cauliflower Disease Identification Using Deep Learning Techniques
831
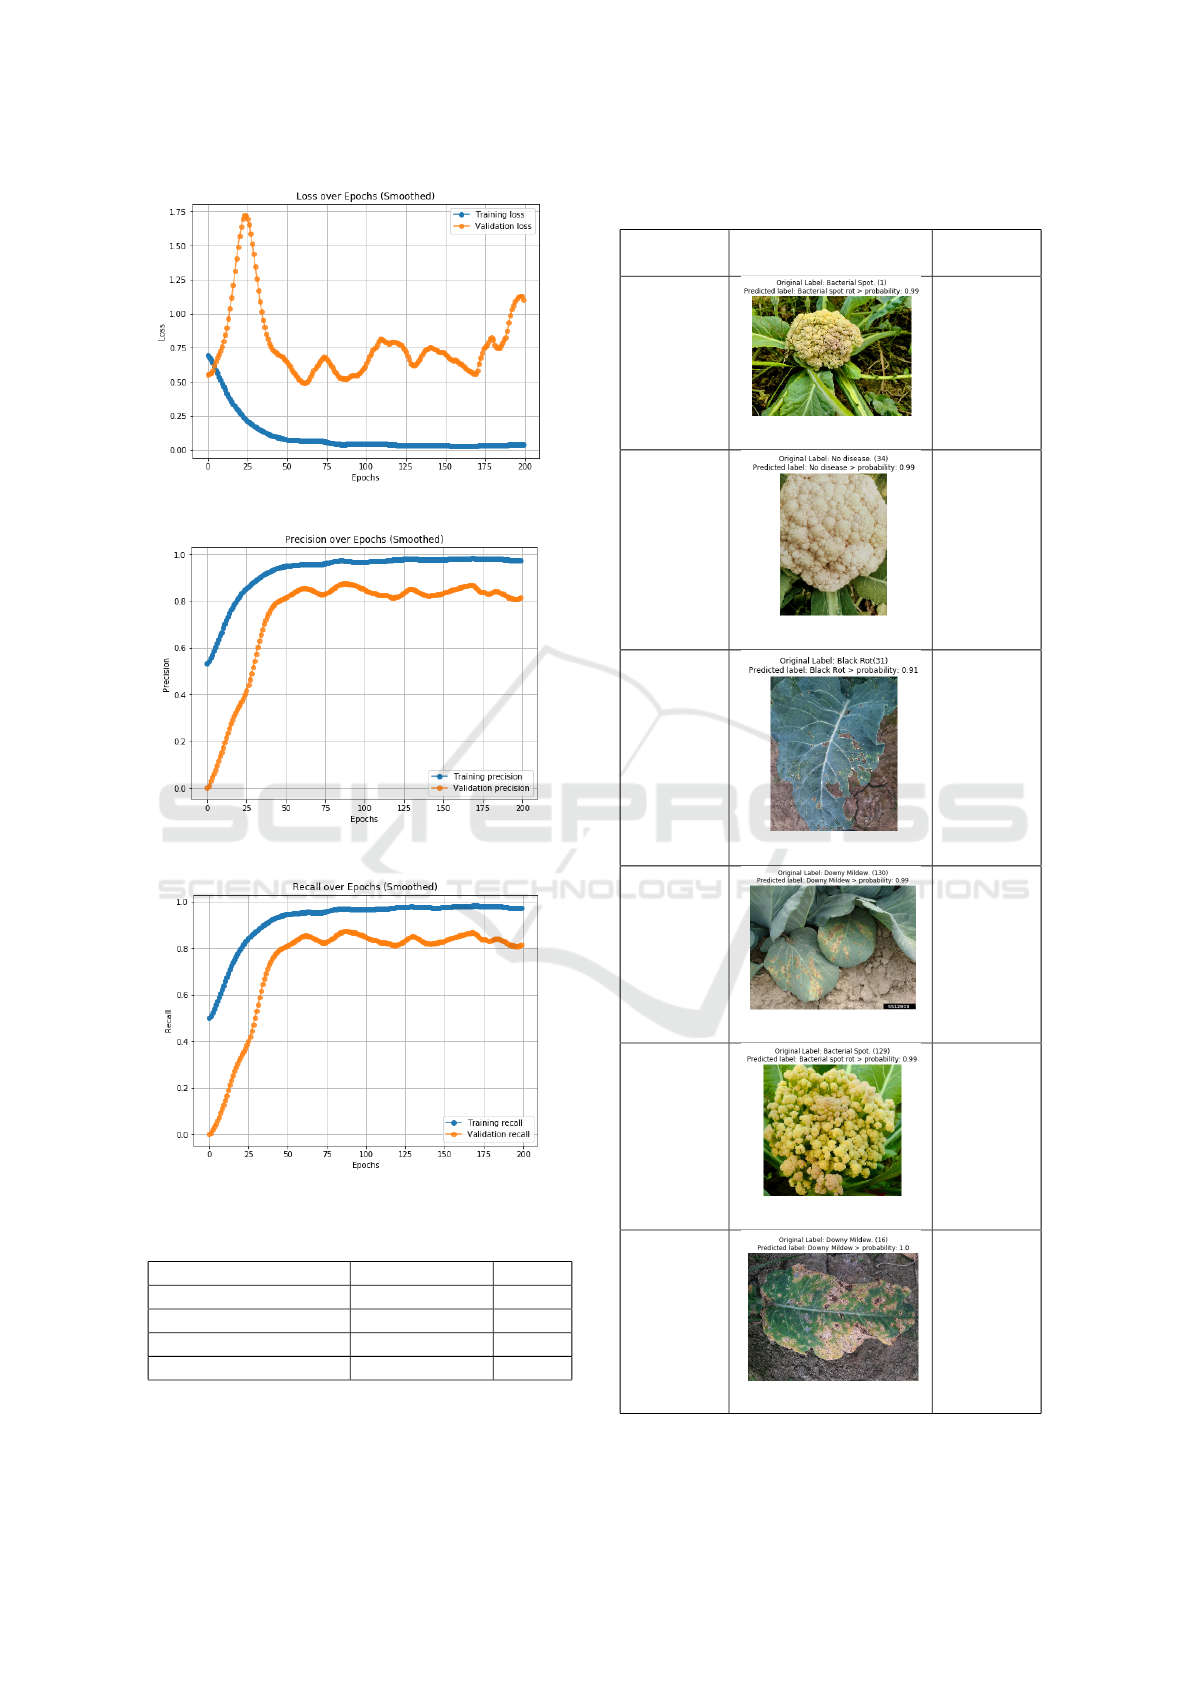
Figure 4: Loss vs Epochs curve
Figure 5: Precision vs Epochs curve
Figure 6: Recall vs Epochs curve
Table 3: Comparison of the Proposed Model with Other
Models
Model Accuracy (%) Loss
Proposed CNN Model 96.96 0.1805
Inception 86.36 0.7115
VGG16 75.00 0.5600
ResNet50 80.30 0.6712
Table 4: Prediction Examples: Visualization of model out-
puts along with their original and predicted labels.
Actual
Disease
Image Predicted
Disease
1.Bacterial
Spot Rot
1.Bacterial
Spot Rot
2.No dis-
ease
2.No dis-
ease
3.Black
Rot
3.Black
Rot
4.Downy
Mildew
4.Downy
Mildew
5.Bacterial
Spot Rot
5.Bacterial
Spot Rot
6.Downy
Mildew
6.Downy
Mildew
INCOFT 2025 - International Conference on Futuristic Technology
832

5 CONCLUSION
This study highlights the possibility of a CNN-based
approach in the identification of cauliflower diseases
with a notable accuracy of 96.96%. Advanced data
pre-processing, augmentation techniques, and an op-
timized deep learning model architecture make the
proposed methodology robust in addressing the com-
plexities of agricultural disease detection. These re-
sults show the feasibility of using deep learning to en-
hance precision agriculture, reduce manual interven-
tion, and promote more effective crop health manage-
ment.
Future work will involve increasing the size of
the dataset to include more samples and environmen-
tal variations, thus increasing the generalizability of
the model. The exploration of state-of-the-art archi-
tectures such as EfficientNet and transformer models
can further improve accuracy and computational effi-
ciency. Ultimately, integrating the developed model
into accessible platforms, such as mobile or web-
based applications, can empower farmers with real-
time disease detection capabilities, which will signif-
icantly transform agricultural practices and sustain-
ability.
REFERENCES
A. Kumar, P. Singh, and M. Sharma, “Enhanced Localiza-
tion of Cauliflower Diseases Using YOLOv8,” Agri-
cultural AI Research, 2024.
R. Gupta, S. Verma, and K. Patel, “Early Detection
of Cauliflower Diseases Using EfficientNetB1,” Ma-
chine Learning in Agriculture, 2023.
D. Raj, N. Mishra, and L. Kaur, “Automated Cauliflower
Disease Recognition Using ML and Transfer Learn-
ing,” ICSAS, 2021.
S. Banerjee and P. Rath, “Computational Techniques for
Cauliflower Leaf Disease Diagnosis,” Digital Agricul-
ture and Crop Management, 2021.
T. Desai, V. Sharma, and R. Narayan, “Evaluation of Classi-
fiers for Cauliflower Disease Detection,” Applied Ma-
chine Learning in Agriculture, 2021.
K. Bhargava, P. Mehta, and S. Reddy, “Fine-Tuned CNN
Models for Cauliflower Disease Classification,” Deep
Learning in Horticulture, 2024.
M. Kumar, R. Sharma, and N. Verma, “Deep Learning-
Based Survey for Cauliflower Disease Detection,” AI
in Agriculture, 2023.
J. Das, K. Mitra, and P. Gupta, “Graph Neural Networks for
Predicting Cauliflower Diseases,” ASCA, 2023.
A. Roy, S. Singh, and V. Prasad, “Surface Defect Detec-
tion in Fresh-Cut Cauliflower Using CNN,” Posthar-
vest Technology and AI Applications, 2022.
P. Chaudhary, R. Meena, and V. Tiwari, “Image Processing
and ML-Based Cauliflower Disease Detection,” Inter-
national Journal of Agricultural Informatics, 2020.
S. K. Maria, S. S. Taki, M. J. Mia, A. A. Biswas, A. Ma-
jumder, and F. Hasan, “Cauliflower Disease Recogni-
tion Using Machine Learning and Transfer Learning,”
Smart Systems: Innovations in Computing, vol. 235,
2021.
S. R. Dubey and A. S. Jalal, “Fruit and Vegetable Recog-
nition by Fusing Colour and Texture Features of the
Image Using Machine Learning,” International Jour-
nal of Applied Pattern Recognition, vol. 2, no. 2, pp.
160–181, 2015.
P. Krithika and S. Veni, “Leaf Disease Detection on Cucum-
ber Leaves Using Multi-Class Support Vector Ma-
chine,” WiSPNET, pp. 1276–1281, 2017.
H. Tani, R. Kotani, S. Kagiwada, H. Uga, and H. Iyatomi,
“Diagnosis of Multiple Cucumber Infections with
Convolutional Neural Networks,” IEEE Applied Im-
agery Pattern Recognition Workshop, pp. 1–4, 2018.
K. P. Ferentinos, “Deep Learning Models for Plant Disease
Detection and Diagnosis,” Computers and Electronics
in Agriculture, vol. 145, pp. 311–318, 2018.
Y. Lu, S. Yi, N. Zeng, Y. Liu, and Y. Zhang, “Identification
of Rice Diseases Using Deep Convolutional Neural
Networks,” Neurocomputing, vol. 267, pp. 378–384,
2017.
D. Jiang, F. Li, Y. Yang, and S. Yu, “A Tomato Leaf Dis-
eases Classification Method Based on Deep Learn-
ing,” Chinese Control and Decision Conference
(CCDC), pp. 1446–1450, 2020.
H. Durmus¸, E. O. G
¨
unes¸, and M. Kırcı, “Disease Detection
on the Leaves of the Tomato Plants by Using Deep
Learning,” Agro-Geoinformatics, pp. 1–5, 2017.
M. T. Habib, A. Majumder, A. Z. M. Jakaria, M. Akter,
M. S. Uddin, and F. Ahmed, “Machine Vision-Based
Papaya Disease Recognition,” Journal of King Saud
University-Computer and Information Sciences, vol.
32, no. 3, pp. 300–309, 2018.
B. A. M. Ashqar and S. S. Abu-Naser, “Image-Based
Tomato Leaves Diseases Detection Using Deep
Learning,” International Journal of Academic Engi-
neering Research, vol. 2, no. 12, pp. 10–16, 2018.
N. N. Kurniawati, S. N. H. S. Abdullah, S. Abdullah, and S.
Abdullah, “Investigation on Image Processing Tech-
niques for Diagnosing Paddy Diseases,” Soft Comput-
ing and Pattern Recognition, pp. 272–277, 2009.
H. B. Prajapati, J. P. Shah, and V. K. Dabhi, “Detection and
Classification of Rice Plant Diseases,” Intelligent De-
cision Technologies, vol. 11, no. 3, pp. 357–373, 2017.
Cauliflower Disease Identification Using Deep Learning Techniques
833
