
Evaluating the Effectiveness of Leading Job Portals: A Cross-Platform
Analysis
Mettu Siddhartha, M Ramya Sree, Poli Vamsi Vardhan Reddy, Balam Ruchith Balaji,
Parlapalli Bhargav Reddy and Radha D
∗
Department of Computer Science and Engineering, Amrita School of Computing, Bengaluru,
Amrita Vishwa Vidyapeetham, India
Keywords:
Job Searching Platforms, SEO Analysis, Website Performance, Usability Best Practices, Core Web Vitals,
PageSpeed Insights.
Abstract:
The modern era has seen widespread adoption of online job platforms, connecting job seekers directly with
potential employers. In the proposed work, various key performance evaluation tools—such as Google’s Page-
Speed Insights, Pingdom, SEMrush, and GTmetrix—have been employed to assess metrics like Performance,
SEO(Search Engine Optimization), Accessibility, Best Practices, Load Time, and Traffic, among others. These
tools provide insights into platform strengths and limitations, independent of developer influence, thereby
ensuring objectivity and offering substantial recommendations for enhancing user experience and technical
aspects. The analysis concludes that Job Board-1 demonstrates a high level of competence across nearly all
critical factors essential for traffic, audience engagement, and platform availability, and it presents several
technological strengths. Job Board-3, while performing reasonably well in terms of accessibility and SEO,
faces challenges related to high bounce rates and slow loading speeds, suggesting areas for improvement to
increase user engagement.
1 INTRODUCTION
Job seeking in the digital age has transitioned from
offline to online, with websites serving as a vital con-
duit between job seekers and potential employers.
These platforms, which now include Job Board-1, Job
Board-2, Job Board-3, and Job Board-4, are essential
resources for anyone looking to advance in their ca-
reers. Each platform offers unique features and ser-
vices tailored to meet the needs of its diverse user
base, ranging from job listings and company ratings to
networking opportunities. The effectiveness of these
platforms relies not only on the number of job post-
ings but also on their overall performance, usability,
and accessibility.
Page load speeds and user interface design were
the main emphasis of traditional website performance
monitoring. However, a more thorough study is now
achievable because to the development of increas-
ingly advanced techniques and technology. Conven-
tional approaches frequently involved basic mobile
compatibility tests and broad user satisfaction sur-
veys. Although these approaches offered a wide per-
spective, they were insufficiently detailed to compre-
hend the fundamental elements that lead a website to
successfully furnish a smooth job search encounter.
Selected job search platforms will be evaluated
across a range of parameters using industry-standard
tools. Starting the evaluation, the performance, SEO,
accessibility, and other best practices are checked
with Google PageSpeed Insights. This involves con-
sidering factors such as title tags Meta description,
server response time, loading speed of both the mo-
bile and the desk top version of the Website. The
properties like metadata, mobile-responsiveness, and
structured data are analysed in order to understand the
websites’ visibility and their capability of SEO opti-
mization. Moreover, the issues of usability and acces-
sibility are also verified by such criteria as the exis-
tence of alt text for images, keyboard navigation, and
color perception violations on the platforms. About
performance I use Pingdom by giving tests from a
server in Japan to examine performance in the Region
of Asia. To analyze the traffic of various platforms,
the SEMrush tool is used, including the total visits,
visits by unique visitors, bounce rates, and the average
time spent by a user on a site. This site goes further in
giving different general performance indicators like
616
Siddhartha, M., Sree, M. R., Reddy, P. V. V., Balaji, B. R., Reddy, P. B. and D, R.
Evaluating the Effectiveness of Leading Job Portals: A Cross-Platform Analysis.
DOI: 10.5220/0013598400004664
Paper published under CC license (CC BY-NC-ND 4.0)
In Proceedings of the 3rd International Conference on Futuristic Technology (INCOFT 2025) - Volume 2, pages 616-623
ISBN: 978-989-758-763-4
Proceedings Copyright © 2025 by SCITEPRESS – Science and Technology Publications, Lda.

LCP, TBT, CLS, total page weight, and the quantity
of requests to give a full report in how well these Plat
forms run. By adopting a multi-dimensional perspec-
tive to analyze each platform, the strategies for how
to optimize them are also shown in detail.
The remaining part of the paper consists of re-
view on the background information and introduction
to the topic is discussed in section 1.and Section 2
presents literature of related studies and prior work
done in similar field. Section 3 provides the method
explaining the method used, methods employed and
instruments applied in the study. Section 4 displays
the results in form of findings, data and any analysis
done on them. Last, Section 5 provides a summary of
the findings and the implications of the research for
practice.
2 LITERATURE REVIEW
The section outlines prior work done on measuring
the performance of the website, search engine opti-
mization, keyword study and usability studies across
multiple industries. It underlines the role of recog-
nizing the shifts of keywords and users’ behavior and
the influence made by SEs’ algorithms on the website.
Such as SEMrush, PageSpeed Insight, or GTmetrix
that is used to review the performance and to deter-
mine slips. Largest Contentful Paint and First Input
Delay are among the most important metrics config-
ured within the Core Web Vitals to address user expe-
rience and site performance needs. Various aspects of
the website should be optimized on a continuous basis
and the results should be compared with industry tar-
gets to ensure that a high efficiency with subsequent
improved search engine ranking is attained.
Nanda et al. study is to examine the trend analy-
sis of the keywords, questions, and website domains
most frequently associated with melanoma and skin
cancer search (Nanda, Hay et al. 2021). All the infor-
mation was obtained using different search engines
and findings indicated higher search terms based on
skin cancer as compared to melanoma. The clini-
copathologic classification and diagnosis constituted
the largest group of the ten most frequently used
melanoma keywords. The survival query was the
most popular but general/melanoma or diagnosis type
query type yielded the highest number of searches
per query. To help resolve common issues related
to melanoma and skin cancer, the study suggests ex-
plaining.
Using the SEMrush analytics tool, Afroz et
al. evaluated and analysed the websites of con-
sumer electronics companies (Afroz, Riyazuddin et
al. 2023). It evaluates performance indicators like
visitor attrs, bounce rate, average stay duration, most
popular pages, ctr, backlink, and referring domain.
The AIDA model, developed by St. Elmo Lewis, is
used to evaluate promotive activities of some brands.
The findings help brands understand consumer behav-
ior trends and their digital footprints, guiding their
marketing approach. Web analytics have developed
rapidly, with SEMrush being a user-friendly tool.
A web-based solution that uses WebpageTest,
PageSpeed Insight, and GTmetrix tools to auto-
matically gather and compare e-commerce site per-
formance metrics was presented by Hossain et
al.(Hossain, Hassan et al. 2021). The application uses
PHP, MYSQL, CSS, and HTML, and allows users to
input the URL of a site. Tests on ten Bangladeshi
e-commerce sites showed site7 had the lowest To-
tal Blocking Time, while site10 had the lowest Load
Time. The application currently supports computer
systems, with future research focusing on mobile ver-
sions and testing limits.
According to Palacios-Zamora et al. assessing
university websites’ effectiveness is crucial to en-
hancing their reputation (Palacios-Zamora, Cordova-
Morana et al. 2023). It discusses various quality as-
sessment models and highlights the impact of parame-
ters like response time, throughput, utilization, exten-
sibility, data transfer rate, concurrency, and reliability
on website performance. Measures like optimizing
images, layouts for desktop, tablet, or mobile devices,
and content caching can enhance site efficiency. The
research also suggests improving mobile device per-
formance and using the increasing, usability, and ac-
cessibility brief.
When evaluating user experience, the authors em-
phasized importance of PageSpeed Insights (Web-
PageTest), First Input Delay (FID), and Largest Con-
tentful Paint (LCP) (Dobbala and Lingolu, 2023). It
suggests that web developers should focus on improv-
ing these parameters to enhance website performance,
efficiency, and business results. This will ultimately
lead to increased conversion rates, creating a compet-
itive advantage in online business.
Bernine et al. provided an analytical model
grounded on Petri nets in assessing the effectiveness
of a Web services structure if requests and services
adhere to an exponential server (Bernine, Nacer et al.
2020). This mainly applies since the arrival of user as
well as the web service requests follows the Poisson
distribution only. The model is solved analytically,
and the response time and mean number of clients
for the system are determined. The limit number of
clients in the system is derived from which the sys-
tem becomes congested.
Evaluating the Effectiveness of Leading Job Portals: A Cross-Platform Analysis
617

According to Kumar et al. website perfor-
mance has a significant impact on user experience,
search engine optimisation, and overall business suc-
cess(Kumar, Kumar et al. 2021). Key automated
tools such as Google PageSpeed Insights, GTmetrix,
Pingdom, WebPageTest, and Apache JMeter are re-
viewed by the authors, who highlight their useful-
ness in locating performance bottlenecks and stream-
lining web applications. The authors support a me-
thodical approach to performance evaluation that en-
hances site efficacy and efficiency by using a variety
of instruments, ongoing monitoring, and benchmark-
ing against industry norms.
Akg
¨
ul et al. highlighted the significance of public
value, usability, and readability in improving user ex-
perience and public service delivery of Turkish gov-
ernment website performance (Akg
¨
ul, 2024). The
authors evaluate how well these websites meet the
needs of citizens, encourage participation, and guar-
antee that all users can access the material. Using
a mixed-methods approach and making use of auto-
mated technologies such as Google PageSpeed In-
sights, GTmetrix, and WebPageTest, the study ad-
vocates for a user-centred strategy in e-government
projects and offers useful suggestions for enhancing
government websites.
The idea of SEO and the methods by which stan-
dard tools can be used to evaluate a website’s search
engine optimisation were described by Simec et al.
(Simec and Kri
ˇ
zani
´
c, 2023). As an example, it pro-
poses to apply three tools to evaluate the same site
and compare their functions and options. In the same
token, SEO is a very fluid field where one is always
in assimilating new information in the field. Semrush
is an online tool that helps analyze SEO, content, a
market, web advertising, and social networking. It
gives a percentage bound to each item where the im-
portant mistakes fixed and the warnings given are said
in terms of a percentage.
Simunic et al. conducted a study on SEO factors
to improve internet visibility (
ˇ
Simuni
´
c, Stifanich et
al. 2023). The research involved literature analysis
and an analysis model. The study found no signifi-
cant correlation between website quality and search
query points. However, there were qualitative deficits
in variable optimization. The study suggests that de-
tecting and optimizing important Google factors for
ranking can lead to higher online direct sales, enrich-
ing new scientific data knowledge and creating poten-
tial for further research.
The authors Considers the rise in traffic from ser-
vices like HTTP, FTP, and SMTP, network traffic clas-
sification is crucial for monitoring and managing data
flow in networks (Archanaa, Athulya et al. 2017). In
this work, the performance of using different sorts of
supervised learning algorithms: Ensemble learning,
Decision tree and Bayesian classifiers for detecting
network traffic. When applying the wrapper method
in feature selection, then the research highlights that
the Decorate Algorithm an ensemble classifier is effi-
cient and reliable than other algorithms.
Sujee et al. explained Modern educational
databases have expanded, and it is possible to find
many hidden resources that can contribute to improv-
ing the results achieved by students (Sujee, Padma-
vathi et al. 2021). This work explains how predictive
modeling, grouping, and association rule mining can
be employed in order to discover information benefi-
cial to students and tutors. RBF model enables one to
predict which students are performing well and which
group could benefit from a boost in instructions. It
helps the instructors in the settings to present teaching
methodologies that fits every student’s needs success-
fully.
The domain, domain age, web impact variables,
and Alexa traffic rank of Indian universities were
compared with the NIRF ranking 2021 by Meghwal
et al. (Meghwal, Joshi et al. 2022). It discovered that
all the websites in the study employed SEO tools. Out
of the universities, Amrita Vishwa Vidyapeetham uni-
versity had the oldest domain registration in Decem-
ber 1988 and the Indian Institute of Science university
had the highest Domain Authority score of 62. A Na-
tional level survey found it that three Universities of
Karnataka were in the top ten Universities in India.
Subbulakshmi et al. explained how a framework
for extending the assessment of Web portal pertinence
can be used to measure the reliability of Web portals
and to calculate their credibility score (Subbulakshmi,
Gopika et al. 2019). Main parameters taken into ac-
count include the content, links, spam information,
the frequency of updating the web portals under con-
cern. The credibility score is determined using met-
rics such as page rank, blacklist status, average page
hits, and two key quality factors: , namely credibility
and relevance. A web crawler collects page links from
different websites in response to specific queries and
in the end, presents the Web sites in order of reliabil-
ity so that users can easily determine which sources
contain reliable information.
The Deep Cyber Threat Situational Awareness
Framework (DCTSAF), developed by Soman et al.
uses deep learning to detect malicious domains
and URLs . Traditional methods like blacklisting
and signature-based strategies don’t work, especially
when faced with fresh or more sophisticated threats.
Deep learning is the foundation of the framework,
which uses character-level embeddings to work with
INCOFT 2025 - International Conference on Futuristic Technology
618

the raw data and automatically determine the most rel-
evant features. The use of both hierarchical features
and long-distance linkages in domain names/URLs
makes CNN-LSTM networks better than other mod-
els. The system is extremely powerful and can handle
two million events per second, which leads to early
threat detection and an alert.
Malathi et al. pointed out In the current genera-
tion to form social network they must family social
network site such as Linked In, Google Plus and face
book (Malathi and Radha, 2016). Social networks
can be represented by graphs and their most signifi-
cant figures, connections, and interaction. Other uses
of graphs include the representation of relations and
processes of different systems, chemical and physi-
cal, biological, information as well. This work ex-
amines a database of US politics books as a network
with such elements as betweenness, eigen vector, de-
gree and closeness.
3 EXPERIMENT
In conducting the analysis of website performance,
several industry-standard tools were used to gather in-
sights across key metrics such as Performance, SEO,
Accessibility, Best Practices, Load Time, and Traffic
To assess performance, SEO, accessibility, and
best practices, Google PageSpeed Insights was used.
This tool provides detailed insights into the speed
characteristics of a website, scoring and offering sug-
gestions for improvements on both desktop and mo-
bile versions.
3.1 Performance
This metric complies with how quickly and active the
website is once opened. The tool breaks down fea-
tures such as response time of the server, resource
loading and rendering speed.
3.2 SEO
SEO score is defined as the capability of the website
to appear in search engines results and evaluate meta-
data, mobile-friendliness, and structured data.
3.3 Accessibility
This metric deals with the accessibility of users with
complications for example; this measures the number
of images that have the alt text; users who can only
use the keyboard to get round the website; users who
have problems with color perception.
3.4 Best Practices
Google PageSpeed Insights assess the current state of
website according to modern web technologies and
standards like security, response, and coding.
3.5 Load Time
The loading time for this website was determined by
Pingdom Tool. Namely, the tests were performed
from an Asia-Japan-Tokyo server to consider the load
effect in this region. when using Pingdom, which de-
livers specific results based on several aspects such as
server response time, resource loading time, and total
page loading time. This assists in finding out some of
the constraints in performance that might hamper on
user experience within certain espoused zones.
3.6 Traffic Analysis
For the assessment purpose of monitoring website
traffic and its behavior index, the SEMrush Tool was
used. It also offers additional traffic details such as the
visits, the visitors, the bounce rates and the average
session time. The following metrics were analyzed:
3.6.1 Total Visits
The over all the number of time the site was visited in
the given time of the study.
3.6.2 Unique Visitors
The number of people who visit this website without
repetition of any user.
3.6.3 Purchase Conversion Rate
This was measured wherever possible showing the
rate which visitors made a purchase or achieved a de-
sired end result.
3.6.4 Pages per Visit
The quantity of unique web page visits by each user
on average per session.
3.6.5 Average Visit Duration
The specific time that the users stay connected to the
site/ portal.
Evaluating the Effectiveness of Leading Job Portals: A Cross-Platform Analysis
619

3.6.6 Bounce Rate
The rate at which visitors leave the site after visiting
only one of its pages.
GTmetrix [] was also used, offering additional
performance insights. The tool includes metrics such
as GTmetrix Grade, Performance Score, Structure
Score, Largest Contentful Paint (LCP), Total Block-
ing Time (TBT), Cumulative Layout Shift (CLS), To-
tal Page Size, and Total Number of Requests.
3.7.1 GTmetrix Grade
This is a composite score that reflects the overall per-
formance and structure of your website. It’s broken
into two components:
Performance Score (70% of the grade) Reflects
how well the website performs based on loading
speed and interactivity, derived from Core Web Vitals
metrics.
Structure Score (30% of the grade) Measures
how well your site follows best coding and optimiza-
tion practices to ensure faster load times.
3.7.2 Performance Score
This is the segment of the GTmetrix Grade that looks
at how effectively users can access and interact with
what your website has to offer. While it also incorpo-
rates data from other performance indicators such as
Core Web Vitals to provide a transparent indication of
user experience scores.
3.7.3 Structure Score
This metric emphasizes various aspects of a website’s
architecture or design. Often it shows how well your
site can actually perform and details like too much
JavaScript, ineffective CSS, and uncompressed im-
ages discover. The greater the structure score, the
more your site prepares appropriately regarding load-
ing speed and maintainability.
3.7.4 Largest Contentful Paint (LCP)
LCP determines the page load time on the screen tak-
ing the biggest factor that is the size of the largest vis-
ible content element (image, video or large text block)
into consideration. This is an essential UX value, as
increased LCP can give a user a sensation that a site
is slow. Google advises LCP should happen within a
time frame of 2.5 seconds from the page time.
3.7.5 Total Blocking Time (TBT)
TBT quantifies the time the browser is occupied by
tasks that hinder or completely halt user interaction
(such as script loading). It measures the time a web-
site’s JavaScript or any other resource takes to hamper
interactivity and quantify the amount of interactivity
lost due to a specific resource. The site’s TBT values
must be lower since this represents a more responsive
website.
3.7.6 Cumulative Layout Shift (CLS)
CLS gives the total scrambled layout/flush that hap-
pens inadvertently when you load a site. For instance,
if images or ads take time to load that they across text
and make it shift about it will contribute to the CLS
score. A CLS score below 0.1 guarantees that users
have reliable and consistent client-side experience.
3.7.7 Total Page Size
This metric demonstrates the sum of the sizes of all
files required for rendering the webpage – images,
scripts, stylesheets and others. Factoring for larger
page sizes is that greater page size decreases the load-
ing time, particularly for internet users with low band-
width. Therefore the best page size is derived from
minimizing its resources since a decrease in page size
has a positive effect on page performance.
3.7.8 Total Number of Requests
The number of HTTP requests or browser clicks an
HTML page makes to load all required elements, in-
cluding images, java, css, and fonts, is shown by this
measure. The longer it takes for a website to load, the
more requests the page receives. The website loading
time can be extended if script requests can be made
more frequently or at a later time.
Several objective tools were chosen because they
are universal and can give more or less exhaustive in-
formation about various aspects of a website taking
into account technical parameters and users’ experi-
ences. These metrics provide a birds-eye view of the
website and this not only considers such factors as
speed of loading of the website, ease of use of the
website, availability of Search Engine Optimization
and identified best practices but also factors such as
structure or organization of the website, responsive-
ness of the website, and optimum use of resources
amongst others. In any case, it integrates supports the
identification of specific areas of improvement, pro-
viding a fair assessment based on both, technology
and users.
INCOFT 2025 - International Conference on Futuristic Technology
620

4 EXPERIMENTAL RESULTS
Analyzing the performance of four job board web-
sites, their strengths and weaknesses differ signifi-
cantly. However, Job Board-1 stands out by excelling
in multiple categories, performing superbly with high
scores in traffic, audience engagement, and easy ac-
cess. It claims the highest visit count, unique visi-
tors, and pages per visit, which are strong indicators
of higher user engagement and a lower bounce rate.
Job Board-2 receives an average number of visitors
but experiences slow loading times, which may lead
to potential user loss. Job Board-4 shows good per-
formance in terms of accessibility and compliance,
but overall visits have decreased, which could be im-
proved by enhancing SEO and reducing load times.
Job Board-3, the smallest platform by traffic, boasts
the highest accessibility and best practice rates. How-
ever, it has a relatively high bounce rate and lower
interaction rates, indicating room for improvement in
user experience (UX). The findings from this analy-
sis highlight the importance of technical performance,
search engine optimization, and user-centric metrics
for driving effective traffic flow.
According to the data presented in Table 1, the
following important aspects of website performance
can be evaluated. Regarding performance, both Job
Board-1 and Job Board-3 posted faster loading times,
allowing customers to engage in quicker interactions,
unlike Job Board-2, which took 3.30 seconds to load.
The overall SEO report is almost perfect for most
sites, with Job Board-1 and Job Board-3 scoring 100
points, while Job Board-4 and Job Board-2 scored rel-
atively lower. In terms of accessibility, Job Board-
1 achieved a perfect score of 100%, indicating full
compliance with accessibility standards for disabled
users, while Job Board-4 received the lowest score.
Job Board-3 performed moderately well. For best
practices, Job Board-1 had the lowest score of 74,
whereas other platforms, such as Job Board-4, Job
Board-3, and Job Board-2, scored above 90. When
considering visits, Job Board-1 led with 1.8 billion
visits, followed by Job Board-2 with 43.9 million, Job
Board-4 with 29.5 million, and Job Board-3 with 7.1
million. Engagement rates show that Job Board-1 had
the highest page views per visit at 8.8, with an average
visit duration of 12 minutes and 1 second. However,
Job Board-3 had the highest bounce rate at 58.41%,
indicating that users leave the site quickly.
Fig 1 represents the traffic analysis of Job Board-
1, Job Board-2, Job Board-3, and Job Board-4, reveal-
ing distinct performance metrics. Job Board-1 leads
significantly with 1.88 billion visits (up 3.62%) and
423.6 million unique visitors (up 6.44%). Job Board-
2 follows with 43.9 million visits (up 9.14%) and 24.7
million unique visitors (down 4.49%).
Table 2 provides a comparative analysis of four
job boards (Job Board-1 to Job Board-4) based on
performance and structure metrics from GTmetrix,
covering six key aspects: GTmetrix Grade, Perfor-
mance Score, Structure Score, Largest Contentful
Paint (LCP), Total Blocking Time (TBT), Cumulative
Layout Shift (CLS), and Total Page Size. Job Board-1
achieved the highest overall performance with an ’A’
GTmetrix Grade (91%), the best Performance Score
(89%), and a strong Structure Score (93%). It also
had the fastest LCP (770ms), minimal blocking time
(260ms), and the smallest page size (585KB), indi-
cating quick load times and efficient resource usage.
In contrast, Job Board-3 performed the worst, with
the lowest GTmetrix Grade (’D’, 61%), the slowest
LCP (4.5s), the highest TBT (1.2s), and relatively
large page size (2.43MB). Job Board-4 also lagged
in some areas, but performed well in blocking time
(172ms). Overall, Job Board-1 stands out as the best-
performing website in terms of both speed and user
experience.
Fig 2 presents a comparison of key performance
metrics across five different platforms, focusing on
areas such as Performance, SEO, Accessibility, and
Best Practices. Two platforms show the highest per-
formance scores, reflecting quicker load times, while
one lags behind with the lowest performance score
and a longer load time of 3.30 seconds. In the SEO
category, two platforms achieve a perfect score, in-
dicating strong optimization, while others have room
for improvement. Accessibility is another area where
one platform excels with a perfect score, suggesting
full accessibility for disabled users, while another has
the lowest score. Regarding best practices, three plat-
forms consistently score high, but one unexpectedly
has the lowest score in this category. The chart of-
fers a visual comparison that highlights strengths and
areas for improvement, particularly in SEO and best
practices for some platforms.
Job Board-4 sees a decline in visits to 29.5 mil-
lion (down 13.36%) and 13.1 million unique visitors
(down 5.61%). Job Board-3 shows modest growth
with 7.1 million visits (up 2.38%) and 3.5 million
unique visitors (down 3.63%). In terms of engage-
ment, Job Board-1 has the highest pages per visit at
8.8 and an average visit duration of 12:01 minutes.
Job Board-4 and Job Board-2 show increases in pages
per visit, while Job Board-3’s metrics decline. The
bounce rate is highest for Job Board-3 at 58.41%,
while Job Board-1 has the lowest at 41.11%. Over-
all, Job Board-1 outperforms its competitors across
all key metrics, highlighting its effectiveness and user
Evaluating the Effectiveness of Leading Job Portals: A Cross-Platform Analysis
621
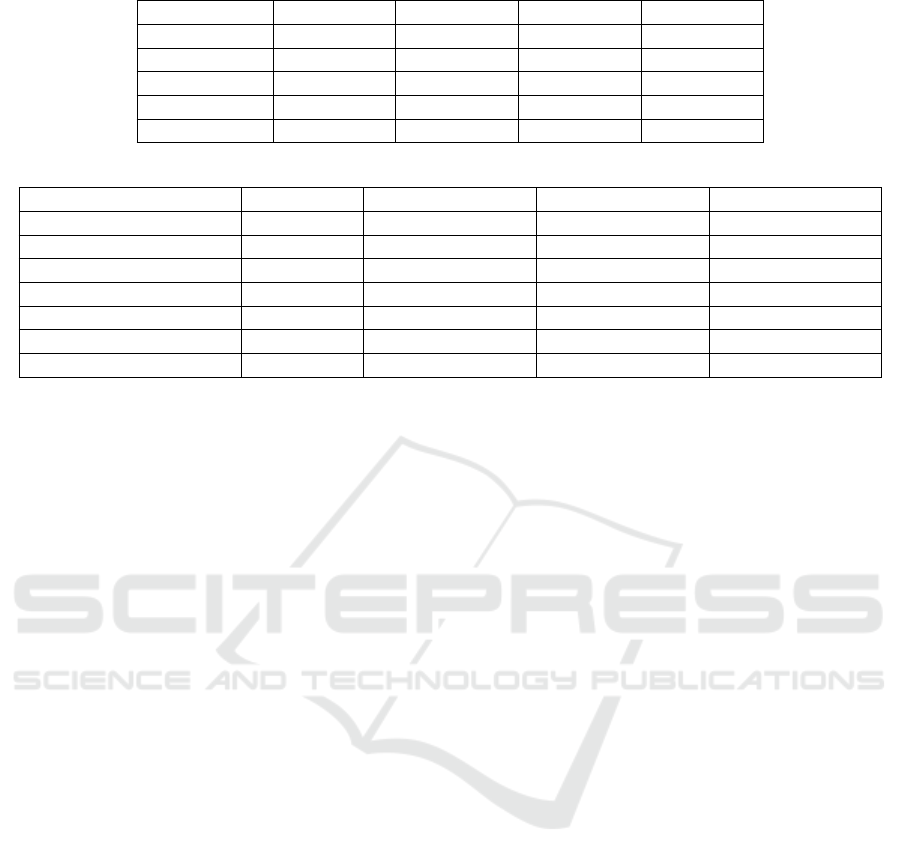
Table 1: Performance analysis of various webpages
Job Board-1 Job Board-2 Job Board-3 Job Board-4
Performance 100 64 60 93
SEO 100 85 100 77
Accessibility 100 90 90 75
Best practices 74 96 100 93
Load Time 767ms 3.30 s 853 ms 112 ms
Table 2: Performance and Structure Metrics of Various Job Boards as Analyzed by GTmetrix
Job Board-1 Job Board-2 Job Board-3 Job Board-4
GTmetrix Grade A (91%) C (76%) D (61%) C (78%)
Performance Score 89% 71% 39% 76%
Structure Score 93% 83% 93% 82%
Largest Contentful Paint 770ms 686ms -83ms 4.5s +3.7s 3.0s +2.2s
Total Blocking Time 260ms 1.0s +775ms 1.2s +919ms 172ms -88ms
Cumulative Layout Shift 0 0.01 +0.01 0 0.01 +0.01
Total Page Size 585KB 3.98MB +3.41MB 2.43MB +1.86MB 2.98MB +2.41MB
engagement.
5 CONCLUSION
In conclusion, analysis indicates that Job Board-1 sur-
passes other job platforms in performance, user en-
gagement, SEO, and accessibility, positioning it as
a benchmark job platform. Another popular plat-
form, Job Board-2, exhibits slower loading times,
suggesting potential improvements in user experi-
ence. Job Board-4, recognized for strong accessibil-
ity and adherence to best practices, may enhance traf-
fic through targeted SEO optimizations. Job Board-
3 ranks highly in accessibility and best practices,
though its bounce rate remains elevated, with moder-
ate user engagement relative to larger platforms. Con-
sistent with prior findings, this study emphasizes that
a balance of efficiency, user satisfaction, and findabil-
ity is essential for the success of online platforms.
REFERENCES
Nanda, J.K., Hay, J.L. and Marchetti, M.A., 2021. Analysis
of keywords used in Internet searches for melanoma
information: observational study. JMIR dermatology,
4(1), p.e25720.
Afroz, S., Riyazuddin, Y.M. and Jadda, V., 2023, December.
Website Traffic Trends and Performance Evaluation of
Selected Consumer Electronic Company Websites. In
2023 Global Conference on Information Technologies
and Communications (GCITC) (pp. 1-4). IEEE.
Hossain, M.T., Hassan, R., Amjad, M. and Rahman, M.A.,
2021. Web performance analysis: an empirical analy-
sis of e-commerce sites in Bangladesh. International
Journal of Information Engineering and Electronic
Business, 11(4), p.47.
Palacios-Zamora, K., Cordova-Morana, J., Mendoza-
Cabrera, D. and Pacheco-Mendoza, S., 2023. Mea-
surement on University Websites: A Perspective of
Effectiveness. JOIV: International Journal on Infor-
matics Visualization, 7(3-2), pp.1995-2006.
Dobbala, M.K. and Lingolu, M.S.S., 2022. Web Perfor-
mance Tooling and the Importance of Web Vitals.
Journal of Technological Innovations, 3(3).
Bernine, N., Nacer, H., Aissani, D. and Alla, H., 2020. To-
wards a performance analysis of composite web ser-
vices using Petri nets. International Journal of Mathe-
matics in Operational Research, 17(4), pp.467-491.
Kumar, N., Kumar, S. and Rajak, R., 2021, December. Web-
site Performance Analysis and Evaluation using Au-
tomated Tools. In 2021 5th International Conference
on Electrical, Electronics, Communication, Computer
Technologies and Optimization Techniques (ICEEC-
COT) (pp. 210-214). IEEE.
Akg
¨
ul, Y., 2024. Evaluating the performance of websites
from a public value, usability, and readability per-
spectives: a review of Turkish national government
websites. Universal Access in the Information Soci-
ety, 23(2), pp.975-990.
Simec, A. and Kri
ˇ
zani
´
c, M., 2022. Comparison of tools for
analyzing the degree of optimization of website search
engines.
ˇ
Simuni
´
c, M., Stifanich, L.P. and Car, T., 2023. Hotel
web site SEO analysis: Segmentation and valoriza-
tion as a precondition for discovering and understand-
ing insights to improve online visibility. Ekonomski
vjesnik/Econviews-Review of Contemporary Busi-
ness, Entrepreneurship and Economic Issues, 36(2),
pp.299-311.
Archanaa, R., Athulya, V., Rajasundari, T. and Kiran,
M.V.K., 2017, January. A comparative performance
analysis on network traffic classification using super-
vised learning algorithms. In 2017 4th International
INCOFT 2025 - International Conference on Futuristic Technology
622
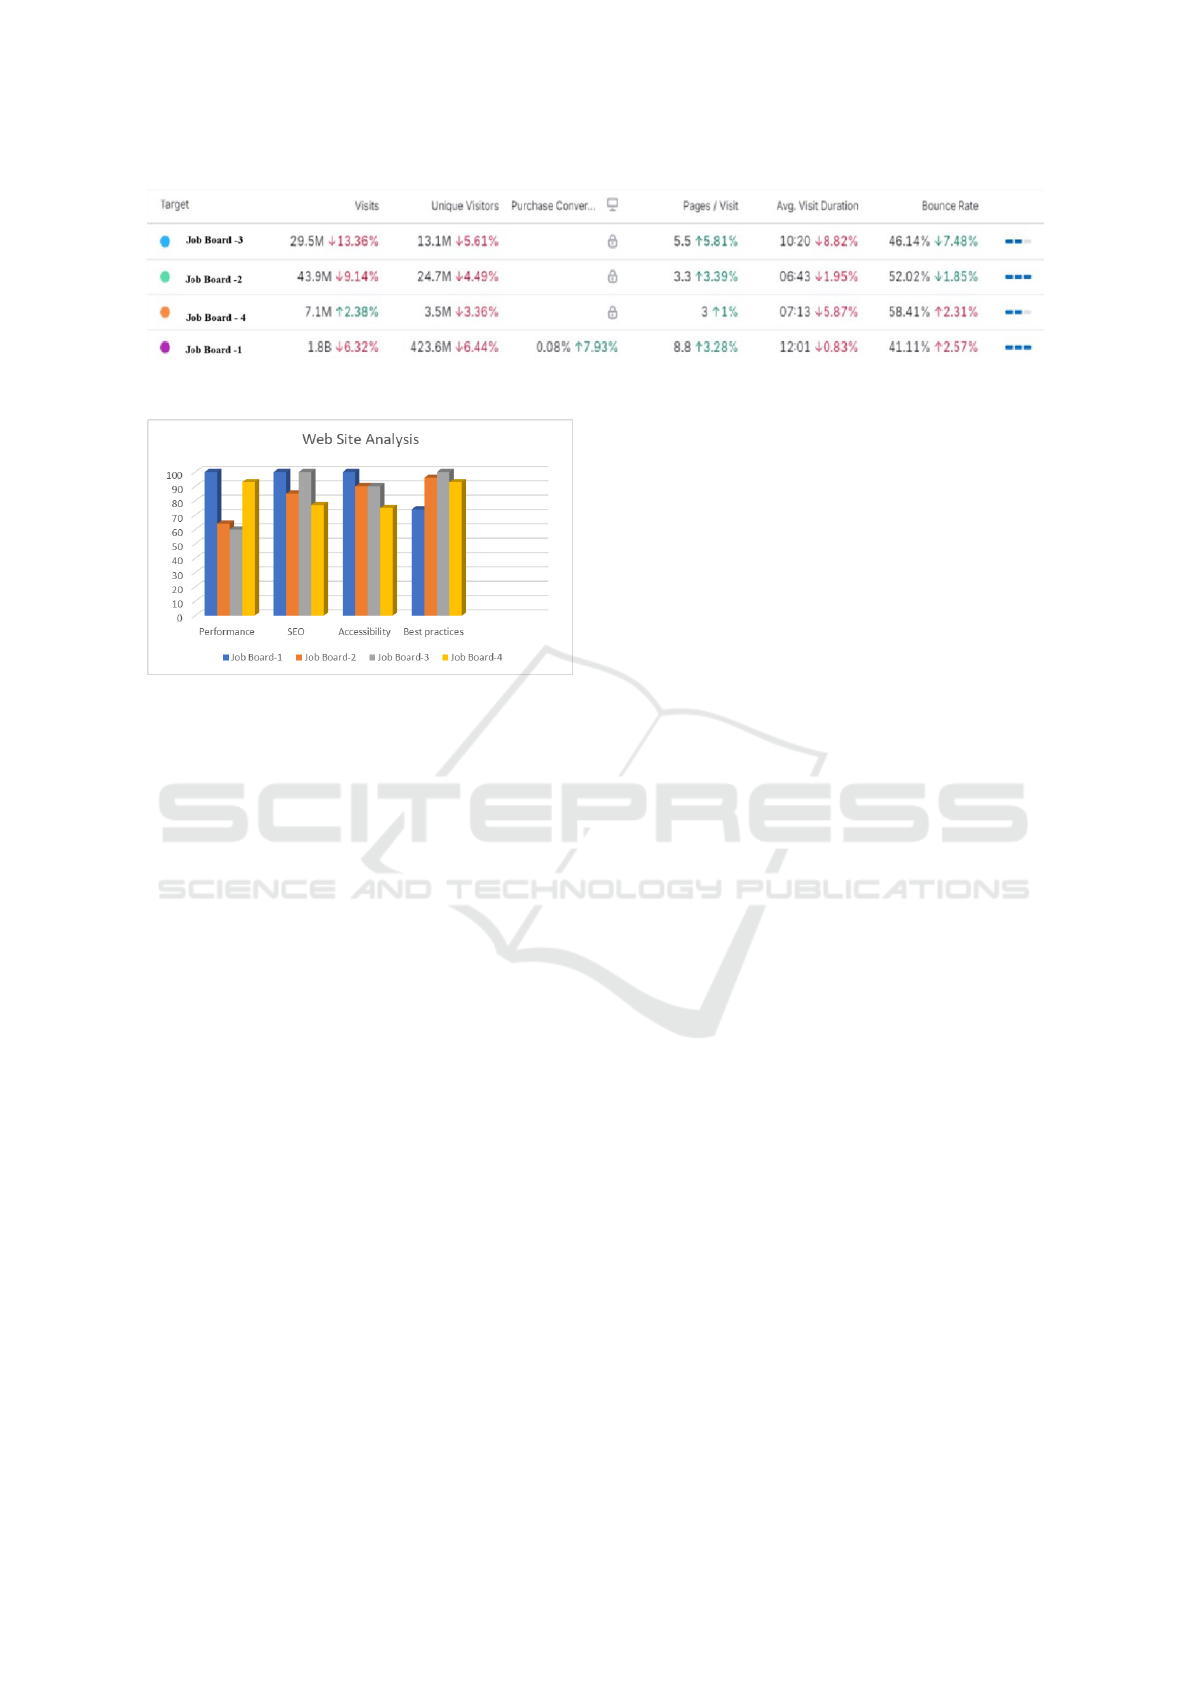
Figure 1: Traffic analysis of various platforms
Figure 2: Visualization plot for website analysis
Conference on Advanced Computing and Communi-
cation Systems (ICACCS) (pp. 1-5). IEEE.
Sujee, R. and Padmavathi, S., 2021, October. Performance
Analysis and Prediction of Students Results Using
RBF Networks. In 2021 2nd International Conference
on Smart Electronics and Communication (ICOSEC)
(pp. 333-338). IEEE.
Meghwal, J., Joshi, K., Chaparwal, N. and Rajput, P.S.,
2022. NIRF Ranking 2021: A Webometric Analysis
of Top 10 University Websites of India. International
Journal of Research in Library Science (IJRLS), 8(2),
pp.191-205.
Subbulakshmi, S., Gopika, A. and Thomson, L., 2019,
July. Enhanced Ranking of Websites Based on Cred-
ibility Evaluation. In 2019 International Conference
on Communication and Electronics Systems (ICCES)
(pp. 2035-2040). IEEE.
Soman, K.P., Poornachandran, P. and Menon, V.K.,
Vinayakumar R Center for Computational Engineer-
ing and Networking (CEN), Amrita School of Engi-
neering, Coimbatore Amrita Vishwa Vidyapeetham,
India vinayakumarr77@ gmail. com.
Malathi, A. and Radha, D., 2016, October. Analysis and
visualization of social media networks. In 2016 In-
ternational Conference on Computation System and
Information Technology for Sustainable Solutions
(CSITSS) (pp. 58-63). IEEE.
Google PageSpeed Insights
SEMrush
Pingdom Tool
GTMatrix
Evaluating the Effectiveness of Leading Job Portals: A Cross-Platform Analysis
623
