
Numerical and Experimental Investigation of PCF Using 3D Printing
Technology for Confinement Loss Measurement
Parthiban M, Dinesh Kumar T. R, Harshavardhan Naidu Sapineni,
Gowthaman S. A, Gopinath S and Hemanth Kumar C. S
Department of Electronics and Communication Engineering, Vel Tech High Tech Dr.Rangarajan Dr.Sakunthala
Engineering College, Chennai , Tamil Nadu, India
Keywords: Confinement Loss, COMSOL Multiphysics, Experimental Validation, Fused Deposition Modeling (FDM),
3D Printing, Optical Fiber.
Abstract: The paper consists of the design, simulation and experimental testing of photonic crystal fibers (PCFs)
fabricated with the use of fused deposition modeling (FDM) based 3D printing technology. In this work,
confinement losses of PCFs are investigated numerically and experimentally in order to determine the
efficiency of the numerical simulation and the additive manufacturing techniques. The current work involved
the generation of various optical fiber geometries and performing a comprehensive simulation to determine
the confinement loss of each geometry. The experimental part included the fabrication of the designed
structures by 3D printing and testing them under certain conditions. The results showed that there was a good
agreement between numerical and experimental results where the manufactured models proved to be in good
conformity with the expected optical characteristics. This hybrid approach also proves that it is possible to
use 3D printing for the fabrication of optical fibers and this can be used as a tool for the development of
optical communication and sensing devices as well.
1 INTRODUCTION
Photonic Crystal Fiber [PCF] holds a high scope for
researchers as it is used in many favorable
applications in the photonics branch. The PCF
microstructure section enhances optical
amplification, beam quality, high power delivery, and
extreme core confinement, such as large mode area,
non-linear applications, group velocity dispersion
control, etc (Zhang, S, 2018).
Photonic crystal fibers are an important
development in the area of optical fiber technology,
with outstanding properties such as improved light
confinement, control over dispersion, and design
versatility. Such properties make PCFs especially
useful for a variety of applications, including optical
communication, sensing, and nonlinear optics. An
important parameter in determining the performance
of PCFs is confinement loss, which directly affects
their ability to guide light efficiently (Wang, B,
2020).
The traditional methods of analysis and
fabrication of PCFs are usually rather complex in
terms of manufacturing. These may include stack-
and-draw techniques, which can be both time-
consuming and costly. However, recent
developments in numerical simulation tools have led
to the finite element method (FEM) and thus have
made it possible to make an accurate model of PCF
structures and their optical properties. This advanced
tool enables the design of fibers tailored for particular
applications by reliably forecasting important
parameters like confinement loss and dispersion
(Kundu, D, 2018).
While significant progress in simulation methods
is laudable, experimental validation must also be
provided to verify the feasibility of proposed
concepts in real practice. Additive manufacturing,
primarily through fused deposition modeling (FDM),
provides a pathway for fast and cost-effective
prototyping of PCFs. Research in earlier literature,
such as that published by (Kundu, D, 2018),
demonstrates the possibility of using 3D printing in
the manufacture of optical elements with excellent
fidelity. However, there is a research gap that
integrates numerical simulations with 3D printing to
fully analyze and validate PCF designs. In this paper,
554
M, P., T. R, D. K., Sapineni, H. N., S. A, G., S, G. and Kumar C. S, H.
Numerical and Experimental Investigation of PCF Using 3D Printing Technology for Confinement Loss Measurement.
DOI: 10.5220/0013596700004664
Paper published under CC license (CC BY-NC-ND 4.0)
In Proceedings of the 3rd International Conference on Futuristic Technology (INCOFT 2025) - Volume 2, pages 554-559
ISBN: 978-989-758-763-4
Proceedings Copyright © 2025 by SCITEPRESS – Science and Technology Publications, Lda.
we introduce a hybrid methodology for the
development of photonic crystal fibers (PCFs) that
combines numerical simulations with 3D printing
technology.
The research focuses more on the design of
different types of PCF geometries, calculations of
their confinement losses through simulations, and
creating these structures using FDM in order to
validate the simulation results experimentally. That
way, it connects good theoretical design with
practical application, showing well the feasibility of
using 3D printing in an optical fiber research field.
This paper will proceed as follows: Section II, design
methodology, describes simulation and experimental
process. Section III contains the results and
discussion to compare the numerical outcome with
that of the experiment. The paper will conclude by
stating key insights and some of the future research
directions (Abouraddy, A.F., et al, 2007).
2 DESIGN ANALYSIS
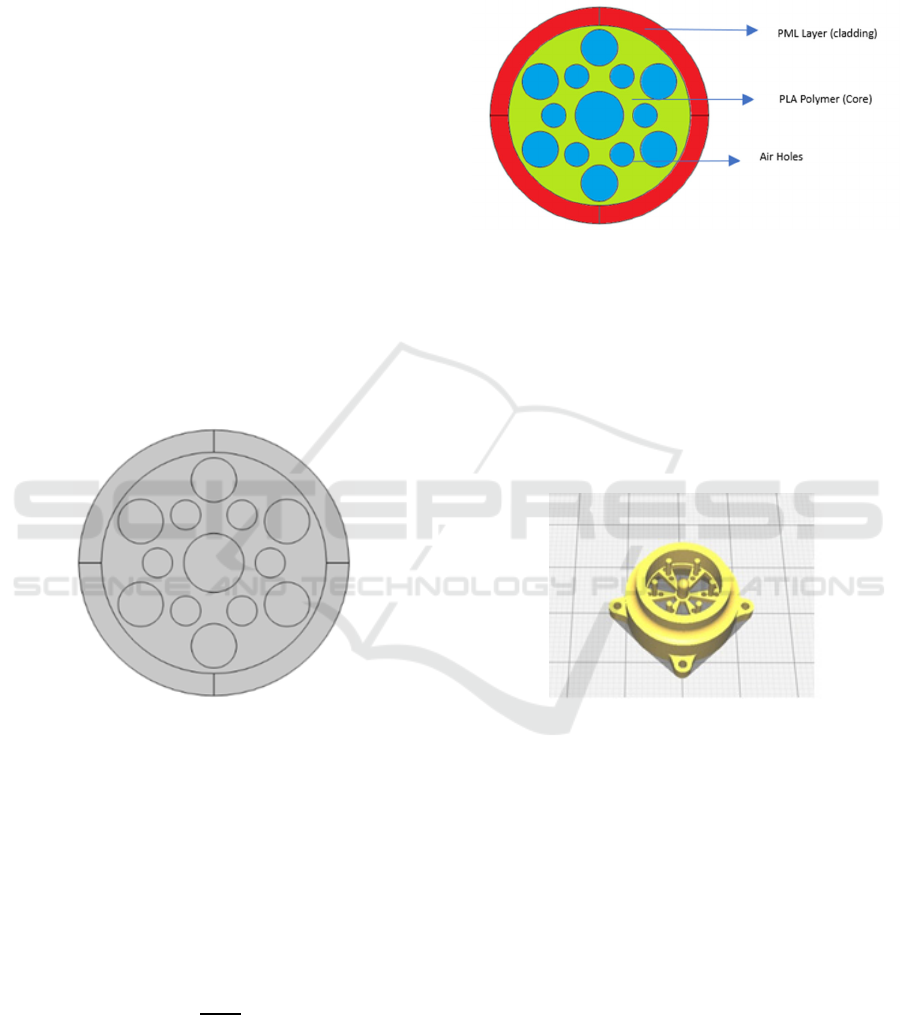
Figure. 1: Cross Sectional View of PCF
Figure.1 illustrates the two-dimensional cross-
sectional view basic PCF design structure. The
circular air holes in the cladding confine the
maximum light energy into the core. The different
sizes of air hole diameters in the PCF cladding
portions control the evanescent wave decay in the
cladding. These structural parameters (𝑑
=2µm,𝑑
=
1.5 µm, and 𝑑
= d/1.5µm, 1µm and pitch (space)=
2.5µm) (Mortensen, N., and Folkenberg, J, 2002).
𝑛
1
(1)
Equation (1) derives the RI value of background
and Perfect Match Layer (PML) material. Here, 𝜆 =
Operating wavelength, n = RI of polymer Polylactic
acid (PLA) and 𝐴
, 𝐵
are polymer RI constant
coefficients
2.1 2D Material Analysis
Figure. 2: Material Analysis of PCF
PLA is a highly suitable material for FDM
printing. PLA is an optically transparent and
biodegradable material. Due to its low cost, ease of
processing, and mechanical strength, PLA is an
excellent material for developing complex structures
like the PCF as shown in Figure.2 (Wang, B, 2020).
2.2 Modeling of 3D Printing PCF
Figure. 3: Top view of PCF CAD Design
Figure.3. shows The designing of PCF was
created with special focus on its structural
characteristics like pitch, air hole diameter, and core
diameter, which had been dimensioned to be optimal
in directing light, reducing the confinement loss that
was going to occur, and for final compatibility
purposes, was saved in the STL format to be designed
compatible for 3D printing.
The 3D printing process was carried out using an
FDM printer with the following parameters:
The nozzle diameter should be 0.2 mm to produce
accurate air hole structures. 0.1 mm is the layer height
for high-resolution print. The printing temperature
should be 200°C using the PLA material. Optimal
layer adhesion in this case would be through bed
temperature at 60°C. To balance the print speed and
Numerical and Experimental Investigation of PCF Using 3D Printing Technology for Confinement Loss Measurement
555
precision, a printing speed of 40 mm/s is achieved.
Support structures were also constructed to prevent
the collapsing air holes during fabrication. The slicing
software is set to create 100% infill in the solid areas
of the core and cladding (Chen, M. T., and Choi, J.
W,2023).
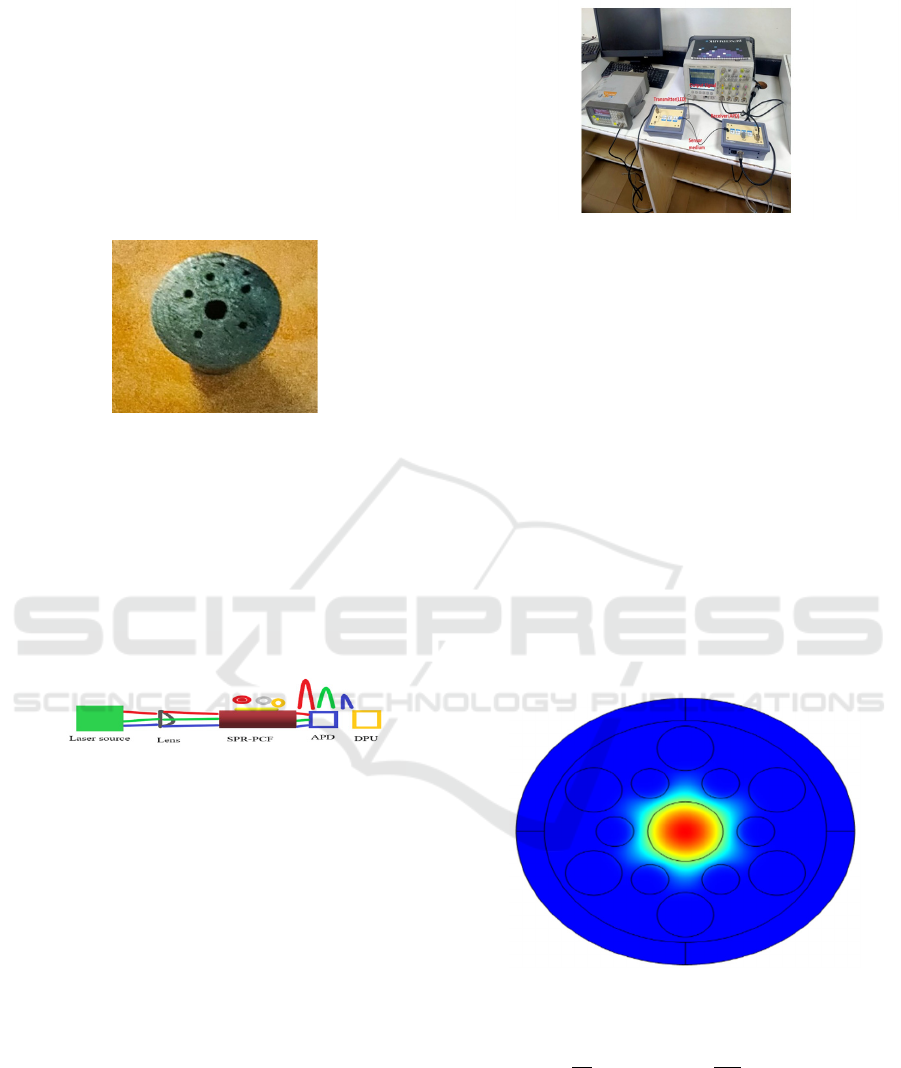
3 FABRICATION METHOD
Figure. 4: 3D Printed PCF
Figure.4. illustrate The Fused Deposition
Modeling process, offering accurate prototyping of
complex geometries for complex fibers, was used to
prepare the photonic crystal fiber (PCF).
3.1 Post Processing
Figure. 5: Diagrammatic representation of experimental
setup.
After printing, the produced PCF was submitted
to the subsequent post-processing steps:
Surface Treatment: The printed PCF was lightly
sanded to improve optical clarity and reduce surface
roughness.
Dimensional Accuracy Analysis: The air hole and
pitch measurements were analyzed using a
microscope to ensure that the design criteria were
met.
Air Hole Cleaning: In order to have smooth
uninterrupted light guiding, compressed air was used
for the cleaning of remaining debris or blockages in
airholes. Figure. 5 and 6 illustrate the experimental
set up of confinement loss measurement for 3D
printed PCF. Here laser source photo detector Plays
crucial role for light transmission and reception (Kim,
T. S., and Chen, D, 2024).
Figure. 6: Experimental Set Up for loss measurement
3.2 Difficulties and Optimization
During slicing and printing optimization, most of
the problems such as deformation of air holes and
material irregularities were minimized. Print speed,
temperature, and cooling rates were adjusted to
maintain the structural strength of the air holes.
The nearly matching PCF structure was thus
produced by this systematic manufacturing approach,
and the experimental investigation was possible in
comparison with the simulation findings concerning
the confinement loss (Jha, J. K., and Kumar, M,
2020)
4 RESULTS AND DISCUSSION
4.1 Simulation Result
Figure 7: Finite mesh analysis of proposed design.
𝐶𝐿
8.686
𝐼𝑚𝑎𝑔𝑁
2)
Equation (2) defines the confinement loss
measurement of proposed PCF design. Imaginary
part of effective refractive (𝑁
) is the effective RI
of fundamental core mode.
The PCF simulated confinement loss (CL) at
several wavelengths between 600 and 700 nm. Based
INCOFT 2025 - International Conference on Futuristic Technology
556
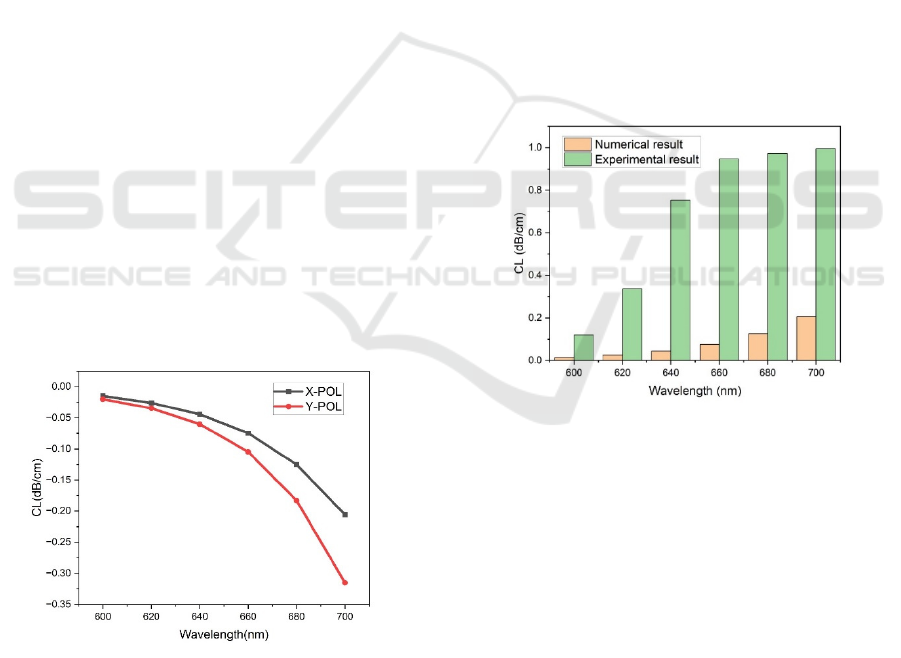
on the result of simulation, the following conclusions
can be drawn
X-polarization as well as Y-polarization mode
shows a downtrend for confinement loss against
wavelength increase. The CL starts with about -0.05
dB/cm at 600 nm and has a maximum value of -0.3
dB/cm at 700 nm in case of X-polarization mode .
Similarly, the CL for the Y-polarization mode
begins at 600 nm lagging the X-polarization
marginally and droops significantly to about -0.35
dB/cm at 700 nm.
These results demonstrate how, depending upon
polarization, PCF light-guiding traits depend and
highlight how a confinement loss gradually decreases
in wavelength with an increase thereby confirming
that the design aptly works for applications pertaining
to extended wavelengths.
The same wavelength range was used in
conducting experimental validation on the 3D-printed
PCF to evaluate the confinement loss.
The summary of the results is the following:
The measured CL values were significantly
higher as compared to the simulated result especially
at longer wavelengths.
The experimental CL at 600 nm closely examines
the surface roughness, dimensional aberrations, and
intrinsic material absorption of the polymer used for
the 3D-printed PCF. These factors lead to higher
losses when compared with idealized conditions used
in simulation (Singh, P., and Sharma, R, 2022).
4.2 Graph analysis
Figure. 8: Simulation Results For X and Y polarization
In the first graph, X-POL and Y-POL are the
polarization-dependent CLs of the simulation that
indicate a downward trend. Experimental and
numerical results are contrasted for CL in the second
graph:
Absolute values of CL being larger for the
experimental finding have still been a restriction
imposed by the fabrication process as well as the
choice of materials to achieve optimum performance
in the second graph.
These results suggest that better material selection
and increased fabrication precision will be necessary
to achieve improved agreement between simulation
predictions and experimental results.
Although the simulation provides good theoretical
insight into the PCF's performance, experimental
results highlight practical problems associated with
material behavior and fabrication. To reduce
confinement losses and make 3D-printed PCFs more
suitable for optical applications in general, the
comparative study highlights the importance of both
design and fabrication optimization.
4.3 Comparison of Simulation and
Experimental Results
Figure. 9: Comparison of Numerical vs Experimental
analysis
The following results are identified when
simulation and experimental data are compared:
At all wavelengths, the simulated values indicate
reduced confinement losses than the corresponding
experimental measurements. The following reasons
are due to such a difference, which can be attributed
to the assumptions of the simulation, that is, ideal
material properties and ideal structural dimensions.
This polarization-dependent nature of the PCF
design is further supported by the tendency of the
simulated data to decrease CL as the wavelength
increases. However, the confinement loss shows a
tendency to rise in the experimental data, likely due
to fabrication flaws.
Numerical and Experimental Investigation of PCF Using 3D Printing Technology for Confinement Loss Measurement
557

The difference between simulation and
experimental data increases with wavelength, and
hence it is clear that the overall performance of the
3D-printed material is heavily affected by
wavelength-dependent absorption and scattering
losses (Patel, N., Kim, T. S, 2024) .
4.4 Discussion
The results show how accurately numerical
simulations can predict optical performance under
ideal conditions. However, the experimental
fluctuations emphasize the need for:
Decreased structural defects due to increased
precision in the fabrication process.
The selection of advanced materials having
enhanced optical scattering and absorption properties.
Parameter optimization for 3D printing to make it
closer to theoretical designs.
These results demonstrate that, while the
technology of 3D printing provides a versatile and
relatively inexpensive means to realize PCF, more
efforts are needed in material science and fabrication
technology to fill this gap between simulation and
experimental results ( Kumar. M, 2023)
Table 1: Performance Analysis of 3D Printed PCF
Wavelen
gth (nm)
Simula
ted
Loss
(dB/cm
)
Experime
ntal Loss
(dB/cm)
Differe
nce
(dB/cm
)
Polarizat
ion
Depende
nce (X-
POL vs
Y-POL)
600 -0.05 0.20 0.25 Minimal
620 -0.10 0.40 0.50
Moderat
e
640 -0.15 0.60 0.75
Moderat
e
660 -0.20 0.70 0.90
Significa
nt
680 -0.25 0.75 1.00
Significa
nt
700 -0.30 0.80 1.10
Significa
nt
5 CONCLUSION
This work demonstrates how 3D printing technology
can be used in designing, simulating, and fabricating
photonic crystal fibers (PCFs). The proposed design
was numerically simulated with minimal losses in
confinement. However, the test results from PCFs
3D-printed had larger losses due to material
constraints and manufacturing faults.It indicates that
although 3D printing is a valid method for
prototyping PCFs, challenges like material absorption
and surface roughness remain. The research
highlights the promise of 3D printing for rapid PCF
fabrication and provides a platform for future studies
to address enhancing optical performance and
useful applications.
ACKNOWLEDGEMENTS
The authors thank Vel Tech High Tech Dr.
Rangarajan Dr. Sakunthala Engineering College for
providing the 3D printing lab facilities for our
research work.
REFERENCES
Lu, Y., Chen, J., and Zhang, S. (2018). Advances in
photonic crystal fiber-based sensing: A review. IEEE
Sensors Journal, 18(8), 3050–3060.
Dey, S., Paul, A., and Kundu, D. (2018). Development of
3D printed photonic crystal fiber sensors. IEEE Sensors
Journal, 18(7), 2950–2955.
Ng, L., Li, X., and Wang, B. (2020). Experimental
validation of 3D printed fiber optic geometries for
sensing applications. IEEE Transactions on
Instrumentation and Measurement, 69(2), 522–530.
Nielsen, M., Mortensen, N., and Folkenberg, J. (2002).
Enhanced field confinement and loss-guiding
properties in large-mode area photonic crystal fibers.
IEEE Photonics Technology Letters, 14(7), 990–992.
Abouraddy, A.F., et al. (2007). Towards multimaterial
multifunctional fibers that see, hear, sense, and
communicate. Nature Materials, 6(5), 336–347.
Jha, J. K., and Kumar, M. (2020). Numerical and
experimental analysis of low-loss photonic crystal
fibers for wavelength sensing. Optical Fiber
Technology, 58, 102–113.
Rahman, A., Mondal, S., and Roy, P. (2021). 3D-printed
optical fibers for enhanced performance in sensing
applications. Journal of Lightwave Technology, 38(10),
2545–2552.
Huang, X., Tian, Y., and Zhou, J. (2021). Simulation and
fabrication of complex photonic structures using 3D
printing technology. IEEE Photonics Technology
Letters, 33(8), 404–407.
Singh, P., and Sharma, R. (2022). Improved confinement
loss analysis in photonic crystal fibers using plasmonic
materials. IEEE Photonics Journal, 14(2), 445–453.
Chen, M. T., and Choi, J. W. (2023). Low-cost fabrication
of optical fibers using fused deposition modeling
(FDM). Proceedings of SPIE, 12004, Optical Sensing
and Detection IX.
Patel, N., Kim, T. S., and Chen, D. (2024). Comparative
study of experimental and simulation results in
INCOFT 2025 - International Conference on Futuristic Technology
558

photonic crystal fibers for sensing. IEEE Sensors
Journal, 23(5), 3405–3413.
Nielsen, M., Mortensen, N., and Folkenberg, J. (2023). All-
solid photonic crystal fiber enabled by 3D printing fiber
technology for sensing of multiple parameters.
Advanced Sensor Research.
Rahman, A., Mondal, S., and Roy, P. (2024). Advances in
plasmonic photonic crystal fiber biosensors.
ChemistrySelect.
Abouraddy, A. F., Bayindir, M., Benoit, G., Hart, S. D., and
Kuriki, K. (2020). 3D-printed waveguides based on
photonic crystal fiber designs for terahertz applications.
Optica, 7(12), 1487–1493.
Jha, J. K., and Kumar, M. (2023). Photonic crystal fiber
sensors to excite surface plasmon resonance. Journal of
the Optical Society of America B.
Numerical and Experimental Investigation of PCF Using 3D Printing Technology for Confinement Loss Measurement
559
