
Self-Explainable Interface for Disease Diagnostic Using Ensembler
Machine Learning Model
Vanitha P, Aarthi R, Yasvanthika K, Purushothaman M and Shamini S
Department of Information Technology, Kongu Engineering College, Perundurai, Erode, Tamil Nadu, India
Keywords: Machine Learning, Random Forest, Disease Prediction, Stroke, Diabetes, Early Detection, Healthcare
Abstract: Diabetes and stroke are major chronic diseases that significantly affect global living standards. This study
uses machine learning techniques to develop a system for early detection and treatment of individuals at risk.
Health data, including age, blood pressure, glucose levels, and BMI, is used to predict diabetes. Models such
as Gradient Boosting, K-Nearest Neighbors (KNN), Support Vector Classifier (SVC), Random Forest,
XGBoost, AdaBoost, and LightGBM were employed, with an ensemble achieving 91% accuracy, establishing
it as a strong predictor. For stroke prediction, models such as Extra Trees Classifier, Random Forest, XGB
Classifier, and Gradient Boosting utilized factors like age, hypertension, heart disease, and glucose levels.
The Random Forest Classifier achieved 99% accuracy, the highest among all models. A web interface built
using Streamlit deploys these models, enabling real-time predictions by allowing users to input health
attributes during examinations. This interface supports doctors and patients in identifying risks for both stroke
and diabetes efficiently. This study demonstrates how machine learning can significantly aid in the early
detection of chronic conditions, improving treatment outcomes and enabling timely interventions, ultimately
fostering healthier lives.
1 INTRODUCTION
Chronic diseases such as diabetes and stroke, which
are major public health issues all over the world, have
millions of people to be affected with. These
conditions not only cut down the duration of life this
one man has and also spoil the quality of life of
patients but new problems occur in the healthcare
systems. Early detection that is the virtue of
immediate treatment and management is of primary
importance to reduce the negative effects of many
diseases. Nevertheless, the traditional diagnostic
ways usually take a lot of time and they did not
always tell us about the signs of the disease in the
early stages, which, in turn, leads to the therapies'
postponement. The introduction of machine learning
(ML) has opened doors for new solutions in the
medical sector. Machine learning algorithms are
programmed to mine and compare the large amount
of data on which they operate to find patterns and
correlations that we do not know about. Their
applicability to prediction and risk assessment tasks
makes them the ultimate tools for disease prevention
in scenarios with multiple risk factors like diabetes
and stroke such as age, high blood pressure, blood
sugar levels, and daily routines, the proposed models
are ready. We can, for instance, appraise our
embodiment of machine learning techniques for
modeling the risk of diabetes and stroke. With the
help of algorithms like Gradient Boosting, Random
Forest, and Extreme Gradient Boosting our system
brings about accurate predictions and hence we see
that the main health metrics are the forerunners.
Another feature of system is its web interface, which
is provided for the users through Streamlit and also is
used for real-time predictions. The objective here is
to supply both the healthcare provider and the patient
with the digital tools that will enable them to
recognize the possible health issues at an early stage
and thus improve the treatment of the chronic
conditions that are known for their management as
the most difficult diseases.
2 LITERATURE REVIEW
Asril et al. (Asril, Tabuchi, et al., 2020) studied
healthy lifestyle behaviors among Type 2 diabetes
538
P, V., R, A., K, Y., M, P. and S, S.
Self-Explainable Interface for Disease Diagnostic Using Ensembler Machine Learning Model.
DOI: 10.5220/0013596400004664
Paper published under CC license (CC BY-NC-ND 4.0)
In Proceedings of the 3rd Inter national Conference on Futuristic Technology (INCOFT 2025) - Volume 2, pages 538-544
ISBN: 978-989-758-763-4
Proceedings Copyright © 2025 by SCITEPRESS – Science and Technology Publications, Lda.

patients in rural Bali, Indonesia, using the extended
health belief model. They found that demographic
factors such as age, education, employment, and
traditional beliefs, as well as clinical factors like
alcohol use, medication, and symptom duration,
alongside diabetes knowledge, explained 71.8% of
the variance in healthy behaviors. Zhou et al. In a
sample of 550,000 adult Chinese, (Li, et al., 2020)
assessed the relationship between hereditary risk and
maintaining a healthy lifestyle. The results showed
that, even among genetically predisposed individuals,
leading a healthy lifestyle significantly lowered the
incidence of diabetes. Thirumurugan in addition to
others. (Wondmkun, Obesity, et al., 2020) analyzed
the importance of feature selection in diabetes
prediction using machine learning, highlighting
factors such as obesity and glucose levels. They
showed that the substantial predictive capacity of
Random Forest classifiers. Shulman et al. (Asril,
Tabuchi, et al., 2020) focused on the relationship
between obesity, insulin resistance, and type 2
diabetes, discussing the physiological mechanisms
that contribute to insulin resistance. Singh et al.
developed an ensemble machine learning system
using classifiers like KNN and Random Forest to
enhance prediction accuracy for diabetes. Khan et al.
used support vector machines (SVM) and feature
extraction techniques like SIFT and SURF to classify
diabetic retinopathy images, achieving a sensitivity of
94%. Donini, Monterio, et al (Donini, Monterio, et
al., 2016) employed multimodal multiple kernel
learning for Alzheimer’s detection, which could be
adapted for diabetes-related research, while Gonen et
al (Gonen, Alpaydin, et al., 2013) proposed localized
algorithms for multiple kernel learning that may
enhance prediction in heterogeneous medical
datasets. Freitas et al. (Mishra, Fasshauer, et al.,
2028) introduced a stabilized RBF-FD method with
hybrid kernels, offering potential improvements for
machine learning algorithms used in diabetes
prediction. Finally, Tiwari et al. performed a
comparative study using deep learning models like
LSTM, showing that it captured temporal
dependencies well and achieved an accuracy of 85%
in diabetes detection using the Pima Indian Diabetes
Database.
3 DATASET AND REVIEW
3.1 Gathering Dataset
This research uses datasets from Kaggle, which is a
well-known website for machine learning and data
science competitions, to predict two diseases,
including diabetes and stroke. The datasets used in
each of the disease prediction models are described in
the sections that follow.
3.2 Data Preprocessing
There are many techniques used in the carrying out of
data preparation for determining whether the data is
appropriate and also of good quality for modeling and
analysis. Handling missing data is a must to the
process and is usually done by using fillna(), which
replaces missing entries with statistical parameters
like mean, median, or mode. In this way, data
integrity is maintained as a result. On the other hand,
dropna() ensures a clean dataset by removing rows or
columns containing missing values. Another very
important step to align formats for data with model
requirement is data type conversion; this is made
easier using astype(). Using LabelEncoder(),
categorical variables such as "sex" or "smoker"
(smoker vs. nonsmoker, for instance - have been
encoded to number values that are amenable to
algorithms. StandardScale() scales features to a
standard way to standardize data.
3.3 Dataset Regarding Stroke
Prediction
The 40,028 records within the dataset utilized to
predict strokes are obtained from Kaggle and contain
11 attributes. Those features, considered critical to
evaluating the risk factors related to stroke, consist of
demographic details such as age, gender, and marital
status, as well as medical history like hypertension
and heart disease. The dataset also includes lifestyle
factors such as smoking habits and work type, which
provide deeper insights into individual risk profiles.
Furthermore, the attributes encompass key
physiological parameters like average glucose levels
and body mass index (BMI), which are strongly
associated with stroke occurrence.
Table 1: Lists the features of the dataset in addition to a
description
Features Descri
p
tion Ran
g
e
Gender The gender of
the individual
Male/Female
Age The age of the
individual
0-100+
Hypertension History of
heart
b
loo
d
p
ressure
0-1
Self-Explainable Interface for Disease Diagnostic Using Ensembler Machine Learning Model
539

Heart Disease History of heart
diseas
e
0-1
Ever Married Marital status of
the individual
Yes/No
Work Type The type of
work the
individual
en
g
a
g
e
d
in.
Private/Govt
children/Self-
employed
Residence Type The kind of
househol
d
Urban/Rural
Avg Glucose
Level
The average
glucose level of
the individual.
0-300+
BMI Body Mass
Index of the
individual
0-67.1
Smoking Status The smoking
habits of the
individual
0-1
Stroke Whether the
Individual has
Experienced a
stroke
0-1
3.4 Dataset Regarding Diabetes
Prediction
The more comprehensive dataset for diabetes
prediction which contains 253,680 data with 22
attributes was collected from Kaggle. These features
contain a wide range of habits and health- related
conditions.
Table 2: Lists the features of the dataset in addition to a
description.
Features Description Range
Diabetes The target variable
indicatin
g
p
resence
d
iabetes.
0 (No) - 1
(
Yes
)
High BP Indicates whether the
individual has high blood
p
ressure
0 (No) - 1
(Yes)
High Chol Indicates whether the individual
has hi
g
h level.
0 (No) - 1
(
Yes
)
Chol Check Whether the Individual has had
a cholesterol check in the past
five
y
ears
0 (No) - 1
(Yes)
Veggies Indicates whether the individual
consumes vegetables daily
0 (No) - 1
(Yes)
Heavy
Alcohol
Consumptio
n
Indicates whether the individual
consumes alcohol heavily
0 (No) - 1
(Yes)
Any
Healthcare
Indicates access to healthcare 0 (No) - 1
(
Yes
)
No Doctor
advise
Indicates whether the individual
avoided a doctor visit due to
cost
0(No)-1(Yes)
General
Health
General health condition of the
individual
1 Excellent) -
5 (Poor)
BMI Body Mass Index (weight in
kg/ (height in m)^ 2)
continuous
Smoker Smoking status of the
individual
0 (No) - 1
(
Yes
)
Education Education level of the
individual
1–
6(Increasing
levels)
Mental
Health
Mental health Condition of the
individual, measured by the
number of days mental health
was not good in the past 30
days
0–30 days
Age Age of the individual 18 to 99
y
ears
Physical
Health
Physical health condition of the
individual measured by the
number of days physical health
was not good in the past 30
days
0–30 days
Difficulty i
n
Walking
Indicates whether the individual
has difficulty walking
0 (No) -
1(Yes)
Sex Gender of the individual 0(Female)-
1
(
male
)
Phys
Activit
y
Indicates whether the individual
engages in physical activit
y
0(No)-1(Yes)
Fruits Indicates whether the individual
consumes fruits dail
y
0 (No) - 1
(
Yes
)
Income Income level of the individual 1–8
(Increasing
levels)
Heart
Disease
heart attack 0 (No) - 1
(
Yes
)
Stroke Indicates whether the individual
has had a stroke
0 (No) - 1
(Yes)
4 EXPLORATORY DATA
ENALYSIS
4.1 Eda for Diabetes
The EDA demonstrates significant relationships
between diabetes and age, BMI, education, Smoking,
and challenges walking. Diabetes is increasingly
reported as individuals age, with the greatest
incidence being noted after 50 and especially when
BMI is above 40. Diabetes is found more often in
regions where educational attainment is lower and
smoking increases the likelihood of acquiring this
INCOFT 2025 - International Conference on Futuristic Technology
540
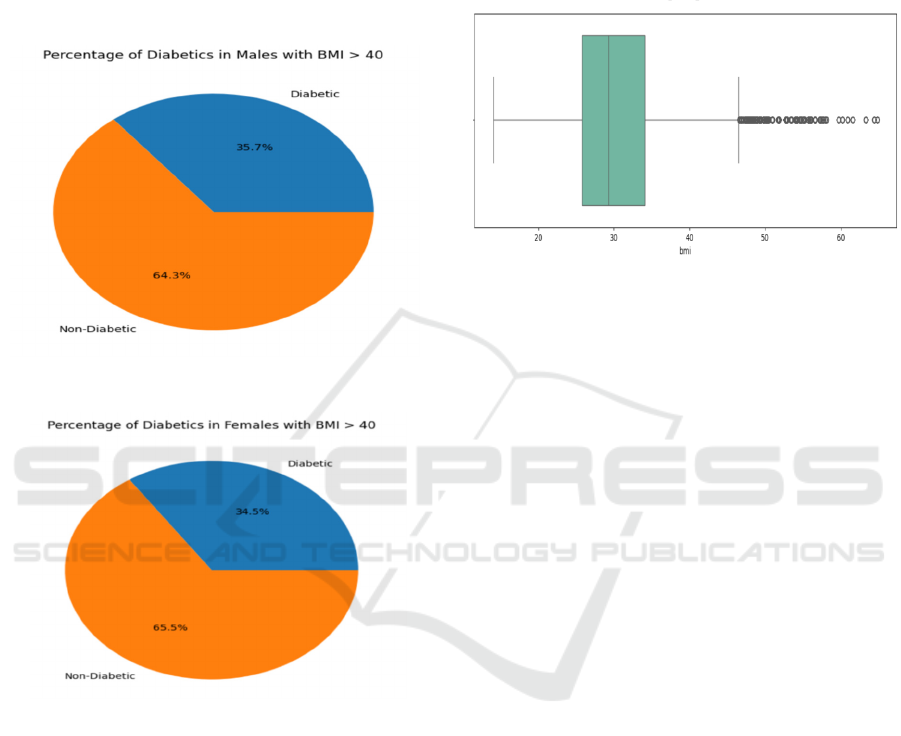
disease, thus making smoking cessation essential.
Difficulty in walking is also associated with a higher
risk of diabetes, indicating the association between
fitness and the disease. Diabetes is slightly
more
common in men than it is in women. These findings
emphasize the need for targeted interventions
targeted at vulnerable groups, such as the elderly,
obese, and smokers.
Figure 1: Diabetes Percentage in Males.
Figure 2: Diabetes Percentage in Females.
4.2 EDA for Stroke
Several key steps were involved in the exploratory
data analysis (EDA) for the 40,910 records that
consisted of the stroke dataset at outset. After
ascertaining the fact that most of the values melted
within normal ranges, extreme outliers were removed
from the data set, leaving 40,028 records with 12
attributes. Outliers were found in the BMI and
average glucose level attributes.
For consistency's sake, rows with "Other" as the
gender were also removed due to being consecutive.
Box plots and histograms were used to portray the
final cleaned dataset in order to show the normal
distribution of numerical attributes and establish the
occurrence of outliers. To learn more about the
distributions when it comes to categorical data, such
as gender, Occupation type and residence type, count
plots were used. By the results of this data, an
individual who had hypertension carried a slightly
higher risk of stroke, though insignificant.
Figure 3: BMI Distribution Boxplot.
5 MACHINE LEARNING MODEL
5.1 Ada Boost
AdaBoost is an ensemble learning algorithm known
to produce a powerful classifier when many weak
learners, particularly decision trees with only one
split, are combined .New weak learners are directed
toward making new mistakes than previously
done,making greater weights on instances wrong
classified. For improvement in forecasting, it
concentrates much more on errors introduced earlier.
Formula: The weighted total of the predictions
made by the weak learners is the model’s prediction.
5.2 Decision Tree
A Decision Tree is one of the simplest models where
data splits into subsets with regard to feature values,
resembling a tree-like structure. All the internal nodes
are decisions related to a feature, and all leaf nodes
represent final predictions. The way it makes
decisions is by splitting the data based on certain rules
into smaller groups.
Gini = 1- ∑jPj2
5.3 Extra Tree Classifier
Extra Trees, Extremely Randomized Trees, is an
ensemble learning method based on a decision tree.
The main idea is to generate a number of trees where
Self-Explainable Interface for Disease Diagnostic Using Ensembler Machine Learning Model
541

each tree is induced from a random subset of the data
and splits on randomly chosen thresholds. This
randomness makes the model robust and less likely to
over fit. It is always choosing both data points as well
as features to split on, thus resulting in more diversity
in the model.
5.4 Gradient Boosting Classifier
Gradient Boosting builds trees sequentially, so each new
tree tries to correct the errors made by the previous
ones. It works through optimizing a loss function,
such as mean squared error, and “boosting” the
performance of weak learners. It’s an improvement
step-by-step, focusing on correcting previous
mistakes.
Fm(x)=Fm−1(x)+hm(x)
The new model, trained to rectify errors, is called
ℎ(x).
5.5 KNN (K-Nearest Neighbors)
KNN assigns a new point to the most frequent class
of its nearest k. k neighbors in the feature space. It is
a straightforward intuitive model but is pretty slow
when it has big datasets.
Formula: It uses the distance formula to find
neighbors, usually Euclidean distance
distance =
√
((a2
–
a1)^2 + (b2
–
b1)^2)
5.6 Light GBM
It's a fast, distributed high-performance gradient
boosting framework that focuses on decision tree
algorithms, where techniques are histogram- based
decision tree learning and leaf-wise tree growth.
Light GBM is basically used to get speed and
performance for larger data sets.
Formula: Similar to Gradient Boosting but
optimized for faster training with a leaf-wise splitting
method.
5.7 Random Forest Classifier
The Random Forest ensemble method constructs a
large number of Decision Trees during training-a
"forest" and it produces a class that is either the mode
of the classes (for classification purposes). It reduces
overfitting and increases accuracy. It combines many
weak Decision Trees to create a strong model.
5.8 SVC (Support Vector Classifier)
SVC is a classifier that attempts to find the best
possible hyperplane-the decision boundary that
separates the data in different classes. It strives to
maximize class margin,that is, maximize the
difference between classes. It draws a line or a plane
with maximum distance between the classes.
f(x)= w^ T x +b
5.9 XGB Classifier
XGBoosting is closely related to Gradient Boosting
but with a speed and performance optimization. It
boosts using a series of models that learn from the
mistakes of previous models. It iteratively builds
models which correct errors from previous models
with increased efficiency.
Objective = Loss + Regularization
6 EVALUATIONS OF
PERFORMANCE
This section gives an overview of the evaluation
metrics for the results of the machine learning models
which are currently taken to use. Due to this moment,
studies, with the aim to evaluate its results, tests
concerning machine learning algorithms, frequently
used rules and regulations such as recall, F1-score,
and precision, classification precision, specificity,
and sensitivity. Calculating the Area under a Receiver
Operational Characteristics Curve and Loss have
been performed (AUC). Even though prediction of
CVD is a two-class problem, statistical learning
defines the classification scheme’s outputs as false
positives, true negatives, and true positives false
positive (FP) and false negative (FN). The
relationship between these results is defined as the
matrix of confusion. The convention for defining TP,
FP, TN, and FN is followed as explained below.
INCOFT 2025 - International Conference on Futuristic Technology
542

7 MODEL PERFORMANCE
COMPARISON
Table 3: Study of machine learning algorithms for the
prediction of Diabetes
Model Precision Recall
F1
score
Accuracy
Extra tree
Classifier
0.98 0.95 0.97 0.96
Random
Forest
1.00 0.99 1.00 0.99
XGB
Classifier
1.00 0.97 0.99 0.98
Gradient
Boosting
1.00 0.99 0.99 0.99
The table shows very good performance in stroke
prediction for all models. Random Forest and
Gradient Boosting are approaching perfect metrics,
with precision, recall, and accuracy all about 1.00.
XGB Classifier also does well at 1.00 precision and
0.98 accuracy. Extra Tree Classifier is a bit lower but
still shows good predictive strength at 0.98 precision
and 0.96 accuracy.
Table 4: Study of machine learning algorithms for the
prediction of Stroke
Model Precision Recall F1
Score
Accuracy
Training Validation
SVC 0.79 0.85 0.82 0.82 0.81
RF 0.93 0.90 0.92 1.0 0.88
KNN 0.77 0.97 0.86 0.89 0.84
AdaBoos
t
0.87 0.88 0.87 0.87 0.87
XG
Boosting
0.96 0.87 0.91 0.92 0.92
Ligh
t
GBM 0.96 0.87 0.91 0.92 0.92
DT 0.85 0.80 0.83 0.84 0.91
In this study, an ensemble classification model
was constructed using multiple algorithms The model
achieved a training accuracy of 99% and validation
accuracy of 91%. The confusion matrix indicated
balanced performance with high precision and recall
values for both classes
8 RESULTS
An intelligent interface enabling straightforward
diabetes and stroke prediction. Regarding health-
related information, the crew effectively created a
system for forecasting that analyzes the risk of
diabetes and stroke with great accuracy. For diabetes,
the system achieves 91% accuracy, while for stroke,
it reaches 99%, and the system is hosted using the
“Streamlit API”. This method supports early
intervention by recognizing individuals who are at
high risk. Both patients and medical professionals can
access the user-friendly website, offering real-time
predictions. The equipment has a chance to
significantly improve health outcomes by enabling
early detection
9 CONCLUSION
The project successfully developed a system capable
of predicting the risk of stroke and diabetes with high
accuracy. By analyzing various health-related factors,
the system was able to identify individuals at higher
risk, which is crucial for early intervention and
treatment. The predictions are made available through
a user-friendly website, enabling both healthcare
providers and patients to access real-time risk
assessments. This tool has the potential to
significantly improve health outcomes by facilitating
early detection and proactive management of these
chronic diseases.
ACKNOWLEDGMENT
This was implemented in the center of Excellence in
Data Science Lab, Department of Information
Technology Kongu Engineering College, Erode,
Tamil Nadu sponsored by NIVIDIA, India.
REFERENCES
M.K. Hasan, M.A. Alam, D. Das, E. Hossain, M. Hasan,
Diabetes prediction using ensembling of different
machine learning classifers, IEEE Access
8(2020)76516–6531,
https://doi.org/10.1109/ACCESS.2020.2989857.
H. Li, et al., Genetic risk, adherence to a healthy lifestyle,
and type 2 diabetes risk among 550,000 Chinese adults:
results from 2 independent Asian
cohorts,Am.J.Clin.Nutr.111(3)(2020)698–707,
https://doi.org/10.1093/ajcn/nqz310.
Y.T. Wondmkun, Obesity, insulin resistance, and type 2
diabetes: associations and therapeutic implications,
Diabetes Metab. Syndr. Obes.13(2020) 3611–3616,
https://doi.org/10.2147/dmso.S275898(ineng).
Self-Explainable Interface for Disease Diagnostic Using Ensembler Machine Learning Model
543

N.M. Asril, K. Tabuchi, M. Tsunematsu, T. Kobayashi, M.
Kakehashi, Predicting healthy lifestyle behaviours
among patients with type 2 diabetes in Rural Bali,
Indonesia, Clin. Med. Insights Endocrinol. Diabetes 13
(2020) 1179551420915856,
https://doi.org/10.1177/1179551420915856.
M.K. Behera, S. Chakravarty, Diabetic retinopathy image
classifcation using support vector machine, in:
Proceedings of the International Conference on
Computer Science, Engineering and Applications
(ICCSEA),2020,pp.17–20,
https://doi.org/10.1109/ICCSEA49143.2020.9132875.
M. Donini, J.M. Monteiro, M. Pontil, J. Shawe-Taylor, J.
Mourao- Miranda, A multimodal multiple kernel
learning approach to Alzheimer’s disease
detection,IEEE Int. Work. Mach. Learn. Signal
Process. MLSP 2016-November
(September)(2016),https://doi.org/10.1109/MLSP.2016.
7738881.
M. Gonen, E. Alpaydin, Localized algorithms for multiple
kernel learning,PatternRecognit46(3)(2013)795–807,
https://doi.org/10.1016/j.patcog.2012.09.002.
P.K. Mishra, G.E. Fasshauer, M.K. Sen, L. Ling, A
stabilized radial basis- fnite difference (RBF-FD)
method with hybrid kernels, Comput. Math. With
Appl. 77 (9) (2019) 2354–2368,
https://doi.org/10.1016/j.camwa.2018.12.027.
M.E. Febrian, F.X. Ferdinan, G.P. Sendani, K.M.
Suryanigrum, R. Yunanda, Diabetes prediction using
supervised machine learning,
ProcediaComput.Sci.216(2023) 21–30,
Vanitha, P., Kamalam, G. K., & Subashini, S. Blockchain-
energized smart healthcare monitoring system. In
Intelligent Wireless Sensor Networks and the
InternetofThings(pp.327-342).CRCPress.
Vanitha, P., Aarthi, R., Priya, T. M., Navasakthi, P., &
Devi, V. R. (2023, December). Enhancing Safety in
Smart Homecare System Through Deep Learning
Based Fall Detection. In International Conference on
Intelligent Systems Design and Applications (pp. 289-
302). Cham: Springer Nature Switzerland.
Vanitha, P., Priya, T. M., Navasakthi, P., Devi, V. R., &
Aarthi, R. (2024, May). Identification of Fake Logo
Detection Using Deep Learning. In 2024 3rd
International Conference on Artificial Intelligence For
Internet of Things (AIIoT) (pp. 1-6). IEEE.
INCOFT 2025 - International Conference on Futuristic Technology
544
