
Detection of Diabetic Retinopathy Using MobileNet Model
U Sadhana
a
, Tripty Singh
b
and Beena B. M
c
Department of Computer Science and Engineering, Amrita School of Computing,
Amrita Vishwa Vidyapeetham, Bengaluru, India
Keywords:
Diabetic Retinopathy, Data Augmentation, MobileNet, IDRiD Dataset.
Abstract:
Diabetic Retinopathy is a chronic disease that may cause blindness to diabetic patients.The proposed system
displays various pathological changes and identifies DR grades for ophthalmologists. The collection of 516
retinal fundus photographs is freely available. We start by removing noise, improving image quality, and stan-
dardizing retinal image sizes. Second, we distinguish between healthy and diabetic retinopathy instances, and
data augmentation is used to increase the volume, quality, and diversity of training data. Next, we divided the
data into three datasets: training, testing, and validation.According to the degree of DR, images are divided
into four groups normal-class 0, mild-class 1, moderate-class 2, and severe-class 3. The proposed method
detects the presence of DR using fine-tuned MobileNet model .This system achieved precision of 91.70%, Re-
call of 89.53%, F-Score of 88.50% and moreover an accuracy of 89.53% for IDRiD dataset. The experiments
yield good results when compared to other systems.
1 INTRODUCTION
A chronic illness that affects millions of individuals
globally is diabetes. Diabetic Retinopathy (DR) is the
term used to describe people whose diabetes causes
an eye condition. The most common cause of vision
loss and blindness in humans is DR.Diabetic retinopa-
thy occurs in two stages: proliferative retinopa-
thy (PDR) and non-proliferative retinopathy (NPDR).
The early stage of diabetic retinopathy is known as
NPDR, and the advanced stage is known as PDR. Five
phases (0–4) can be used to categorize the severity of
DR. There is no retinopathy(0), moderate NPDR(1),
severe NPDR(2), mild NPDR(1), and PDR (4). The
frequency and severity of different related lesion pre-
sentations and outcomes are the primary grading fac-
tors.
Figure 1: Stages of a Diabetic Retinopathy
In the literature on DR diagnosis, we often look
for one or more pre-selected DR-related characteris-
a
https://orcid.org/0000-0003-4224-0486
b
https://orcid.org/0000-0002-3688-4392
c
https://orcid.org/0000-0001-9108-7073
tics in color fundus pictures, such as microaneurysms,
cottonwool spots, hard exudates, and Neo Vascular-
ization. In recent years, computational approaches for
automatically detecting DR severity in fundus images
have been developed. These approaches predict the
existence or absence of DR severity levels, such as
early stage and advanced stage. Approximately one-
third of diabetic people acquire DR, with one-tenth
experiencing severe vision-threatening DR. Initially,
DR patients may not experience any visible symp-
toms. However, when the lesions progress to a more
severe stage, patients may notice eye issues. (Exam-
ples: dark shadow, eyesight loss, etc.) Techniques
must be durable, accurate, and cost-effective. This
approach aims to identify and characterize DR based
on severity. Figure 1 shows the structure of a normal
retina and different stages of DR. Microaneurysms are
little swellings that occur within the blood vessels of
the retina during the first stage. Hemorrhage occurs
when blood vessels burst and release blood.Cotton
wool spots (CWS), also known as exudates, occur
during the second stage. These are brought on by
fluid—which includes lipids, white blood cells, fib-
rin, and serum—seeping out of the blood vessels. Ex-
udates are categorized as brilliant lesions because of
their yellowish white tone, while microaneurysms and
hemorrhages are classified as dark lesions because of
their red appearance. The two lesions differ in size,
478
Sadhana, U., Singh, T. and B. M, B.
Detection of Diabetic Retinopathy Using MobileNet Model.
DOI: 10.5220/0013595100004664
Paper published under CC license (CC BY-NC-ND 4.0)
In Proceedings of the 3rd International Conference on Futuristic Technology (INCOFT 2025) - Volume 2, pages 478-483
ISBN: 978-989-758-763-4
Proceedings Copyright © 2025 by SCITEPRESS – Science and Technology Publications, Lda.

shape, and brightness. Because there aren’t enough
ophthalmologists in India, screening each patient by
hand takes time. The indian Diabetic Retinopathy im-
age consists of 512 images. The resolution of this im-
ages are 4288 X 2848 pixels. This dataset composed
of 5 DR and 3 DME. It provides severity level of DR
and DME for each image in the dataset. It also pro-
vides normal retina and DR lesions structures.
2 LITERATURE SURVEY
HUA et al., a proposed design called TFA-Net, which
is a Twofold Feature Augmentation mechanism con-
nected to a backbone convolutional network.Several
convolution blocks are used in the former to extract
representational information at different scales(Bilal
et al., 2021). The latter is built in two stages: first,
a Reverse Cross-Attention (RCA) stream is deployed,
and then weight-sharing convolution kernels are em-
ployed.
M. M. Abdelsalam, M. A. Zahran et al., proposed
a detailed explanation of a revolutionary multifrac-
tal geometry-based early DR detection technique is
provided. Image analysis using OCTA (macular
optical coherence tomography angiography) for the
early detection of non-proliferative diabetic retinopa-
thy (NPDR)(Chaudhary and Pachori, 2022).
X. Zeng et al., proposed Automated diagnosis of di-
abetic retinopathy can be achieved by dividing color
retinal fundus photos into two categories(Dharmana
and Aiswarya, 2020).This research describes the use
of transfer learning to train a unique convolutional
neural network model with a Siamese-like topology.
L. Qiao et al., suggested a system that uses convo-
lutional neural network algorithms to analyze fundus
images for the presence of microaneurysms. Deep
learning is incorporated as a key component, and the
system is accelerated by GPUs (Graphic Processing
Units)(Hua et al., 2020).
K. Shankar et al. proposed using a brand-new auto-
mated Hyperparameter Tuning Inception-v4 (HPTI-
v4) model to recognize and categorize DR in color
fundus pictures(Shankar et al., 2020). The contrast
limited adaptive histogram equalization (CLAHE)
model will be used during the preprocessing stage
to raise the fundus image’s contrast level. The pre-
processed image is then segmented using a segmenta-
tion model based on histograms.
J. Wang et al., proposed a retinal fundus image can
be used to directly identify one or more fundus ill-
nesses using a multi-label classification ensemble
model based on CNN. Each and every model has
two components. The second section includes a pro-
prietary classification neural network for multi-label
classification challenges, whereas the first uses an
EfficientNet-based feature extraction network. Ulti-
mately, the final recognition result is a fusion of the
output probabilities from various models. Addition-
ally, training and testing were conducted using the
data set made available by the Peking University In-
ternational Competition on Ocular Disease Intelligent
Recognition (ODIR 2019)(Wang et al., 2020b).
Juan Wang et al., proposed a hierarchical multi-
task deep learning architecture for diagnosing fun-
dus photos’ DR-related properties and severity con-
currently(Wang et al., 2020a). To account for the
random relationship between DR severity levels and
DR-related features, a hierarchical framework is pro-
posed.
M. D. Alahmadi et al. created a deep neural network
that employs style and content recalibration to scale
informative regions for diabetic retinopathy classifi-
cation.To draw emphasis to texture details in the style
representation, the texture attention module applies a
high-pass filter. To identify the most informative area
of the input image, the spatial normalization module
uses a convolutional approach(Alahmadi, 2022).
W. Nazih et al.proposed an automated method for de-
termining the severity of DR in fundus images. To
find long-range correlations in images, we developed
a vision transformer deep learning pipeline(Nazih
et al., 2023). To train a large vision model on a lim-
ited dataset, the researchers employed transfer learn-
ing. The new real-world FGADR dataset was used to
train the model in order to test it.
ZHOU et al. developed a methodology for gener-
ating high-resolution DR images that performs well
with grading and lesion data. Synthesized data can
improve grading model performance, especially for
photos with high DR levels.(Zhou et al., 2020)
Natarajan Chidambaram et al., focused automated
CAD system that can identify and categorize
exudates in DR. Prior research mostly concen-
trated on using region-based techniques, such as
the Hough transform, watershed transform, re-
gion growth approaches, etc., to segment the optic
disc.(Chidambaram and Vijayan, 2018)
Bindhumol et al. system makes use of Transfer Learn-
ing methods, including ResNet50 and EfficientNetB5.
When comparing the two models classification and
confusion matrix results, it was found that ResNet50
performed better at classifying the DR images than
EfficientNetB5.(Bindhumol et al., 2022)
Meher Madhu Dharmanan et al. focused on blob de-
tection and image preprocessing are used to present
an effective, straightforward, and precise feature ex-
traction technique. In the proposed paradigm, testing
Detection of Diabetic Retinopathy Using MobileNet Model
479
is carried out on a scale of 0 to 4; 0 (no DR), 1 (mild
DR), 2 (moderate DR), 3 (severe DR), and 4 (prolifer-
ative DR) to expedite disease identification of diabetic
retinopathy.(Dharmana and Aiswarya, 2020)
Praveena S et al. suggested method for diagnosing
diabetic retinopathy will help to produce segmenta-
tion findings that are accurate with few misclassifi-
cations and will also direct doctors in simulating the
patient’s course of treatment in order to grade the con-
dition. Even though CWS is quicker, better segmenta-
tion outcomes are produced for the LSC approach be-
cause, using a straightforward local feature-based al-
gorithm, it meets both boundary adherence and perse-
verance of global picture structure.(Praveena and La-
vanya, 2019)
Payel Patra et al., proposed a system for diagnosing
DR disease automatically.This study used fundus im-
ages to identify diabetic retinopathy using Resnet50
and Inception V3 architecture. Based on the upcom-
ing output, we were able to achieve an affirmation del-
icacy of 83 percentile.(Patra and Singh, 2022)
L Sai Prajeeth Reddy et al., a variety of algo-
rithms,to extract both basic and sophisticated infor-
mation that aid in the early detection of the condition,
enabling ophthalmologists to diagnose diabetic pa-
tients more accurately and restore their vision.(Reddy
et al., 2022)
3 METHODOLOGY
1. MobileNet Convolutional neural network (CNN)
architecture known as MobileNet was created to
operate effectively on embedded and mobile de-
vices with constrained computational power.
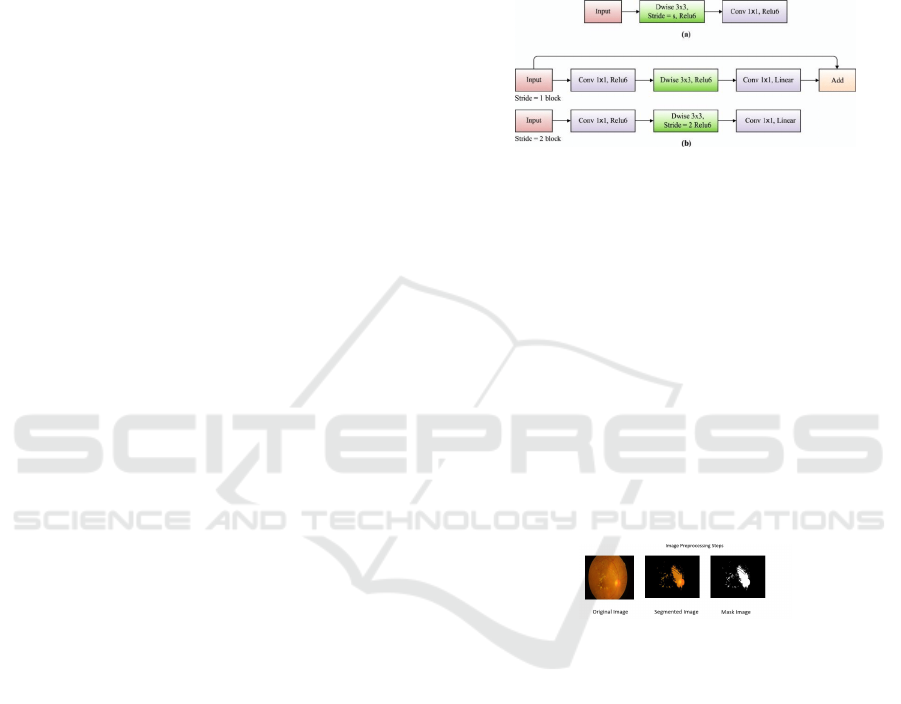
2. MobileNet Architecture MobileNet substitutes
depthwise separable convolutions for traditional
convolutions. In order to achieve this, the standard
convolution is divided into two distinct layers: a
pointwise convolution and a depthwise convolu-
tion. As a result, the network becomes lighter and
uses fewer computations and parameters. Mo-
bileNet Architecture is displayed in Fig.2. De-
fines the input shape and initializes the MobileNet
base model without the upper classification lay-
ers using pre-trained weights from the ”imagenet”
dataset..Constructs custom deep layers for fine-
tuning based on the fundamental MobileNet idea.
This consists of a final dense layer with soft-
max activation for classification, a dense layer
with ReLU activation, and a global average pool-
ing layer.It describes the outputs and inputs that
go into defining the final model. The architec-
ture of the proposed system is divided into four
stages. The initial stage, known as preprocessing,
involves taking out illumination, noise, and arti-
facts from color fundus images. Using the median
filter, we may enhance the quality of color fundus
images by removing the green channel from an
RGB image, which can then be utilized for binary
classification and feature extraction. The second
Figure 2: MobileNet Architecture
phase, feature extraction, is used to retrieve color
fundus images and differentiate between normal
and DR instances. Four DR classes are catego-
rized in the third step, segmentation: mild NPDR,
moderate NPDR, severe NPDR, and PDR. The
fourth stage, known as binary classification or
multilabel classification, uses the previous feature
vector to categorize the different stages of DR and
to separate the images into normal and DR cases.
3. Preprocessing of image data One of the most im-
portant viewpoints is image preprocessing, which
is vital for altering the data to either fix security
vulnerabilities in the data brought about by the
capturing equipment or to change the
Figure 3: Image Preprocessing Steps
data into a configuration that will be managed
much more successfully and effectively.
4. Morphological Transformation
Morphology is the set of techniques that can be
applied to either the pre-processing of the im-
age segmentation stage’s input data or the post-
processing of its output. To put it another way,
morphological operations can be applied after
segmentation is finished to eliminate flaws in the
segmented image and provide details about its
composition.
5. Testing and Training
After preprocessing the entire training set, the fea-
tures are taken out of the bleeding areas and ex-
udates to begin the training process. 80% im-
ages for training,20% for testing are used.The tar-
get classes provide all of the training features that
INCOFT 2025 - International Conference on Futuristic Technology
480
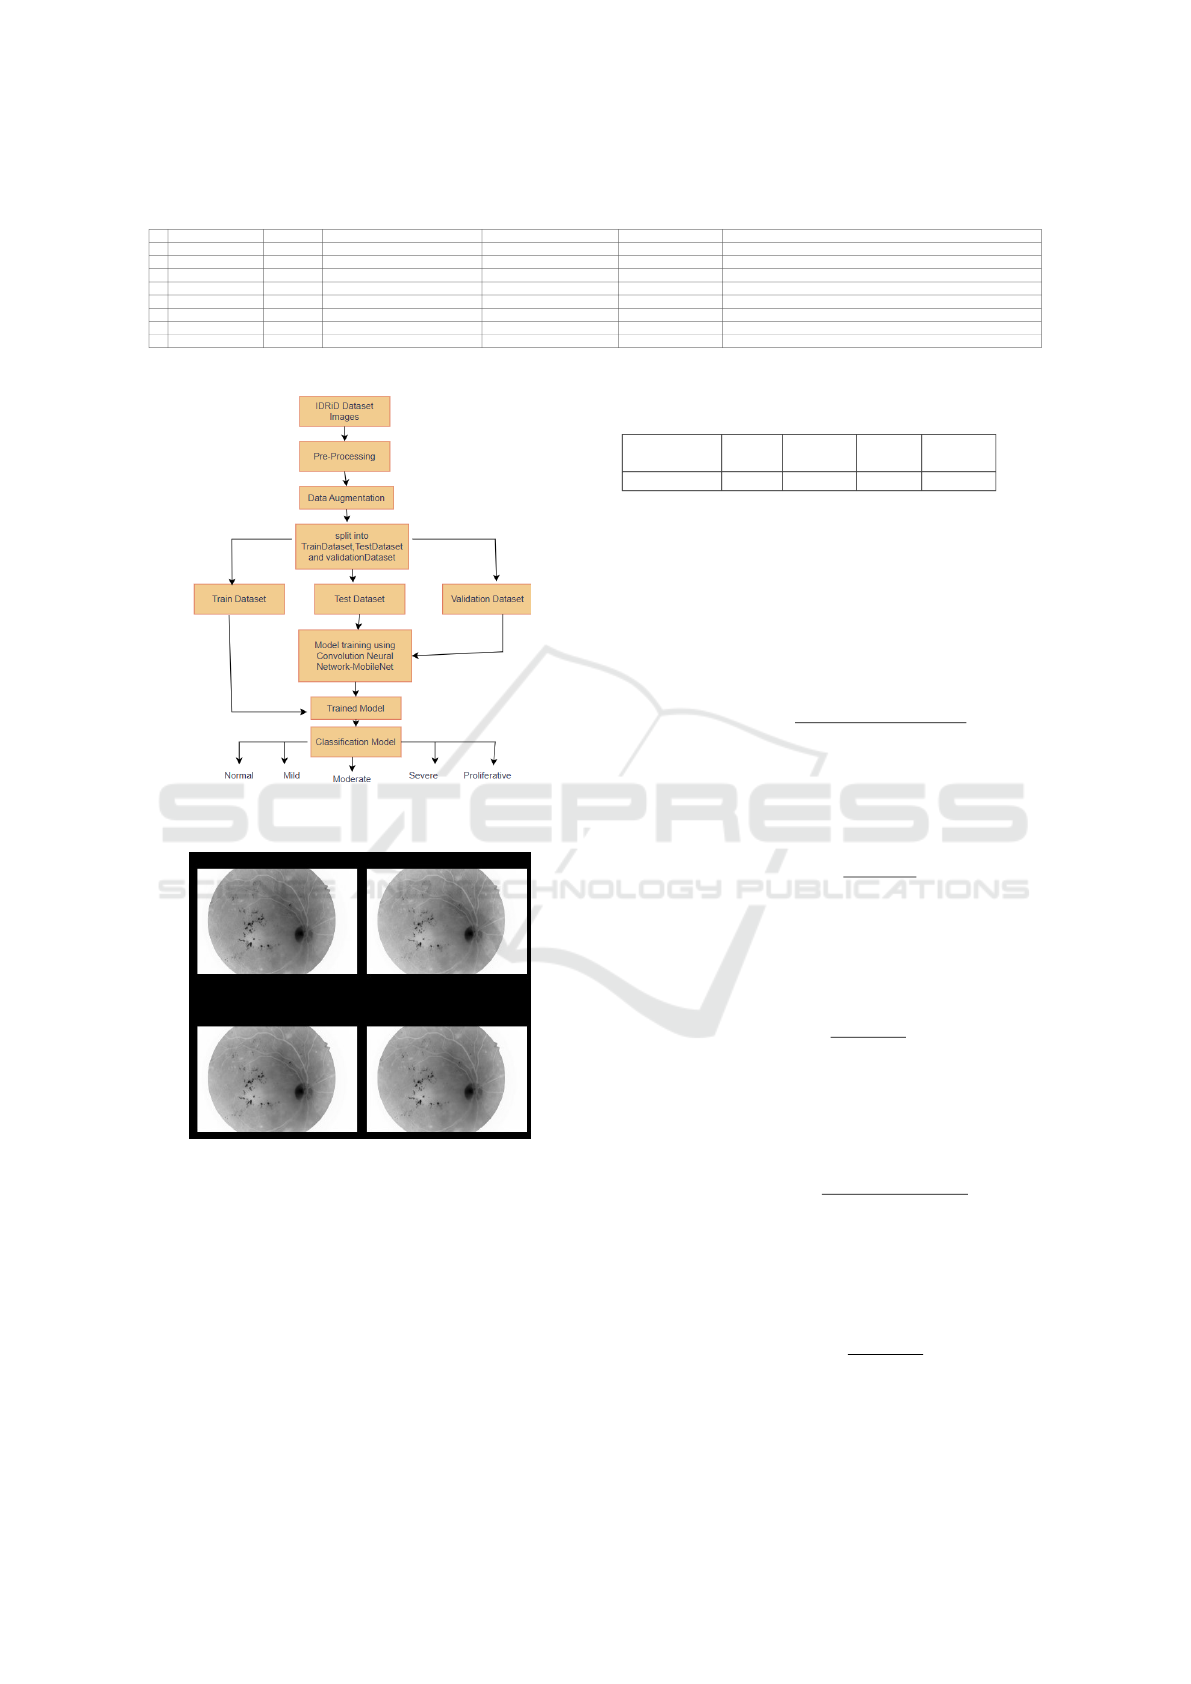
Table 1: Summary of Recent Studies on Retinal Disease Detection. (AUC: Area under the curve, ACC: Accuracy, SPE:
Specificity, SEN: Sensitivity)
Ref. Dataset Images Classes Partitioning Techniques Performance (%)
3 IDRiD 516 DR (0-4), DME (0-3) 80% train, 20% test SVM, KNN, BT Acc: 98.06, Sens: 83.67, Spec: 100
1 DRIVE 40 7 DR cases, 33 healthy 80/20 split ML-CAD System (Deep Learning) Acc: 95.1, AUC: 91.9, Sens: 86.1, Spec: 86.8
8 Shenzhen SiBright 89,917 NPDR, PDR Train: 77,626; Val: 6,200; Test: 4,502 & 1,589 Hierarchical Deep Learning AUC: 95.00
7 ODIR 2019 3,500 patients N, D, G, C, A, H, M, O Uneven EfficientNetB3 Acc: 89, Precision: 63, Recall: 58, AUC: 73, Kappa: 49, F1: 89
6 MESSIDOR 1,200 Normal, Stage 1-3 10-fold CV HPTI-v4 Sens: 98.04, Spec: 99.62, Acc: 99.42, Precision: 97.40
5 KHUMC & Messidor 297 pairs, 1,200 No DR, Mild NPDR, Mod NPDR, Severe NPDR, PDR 1,080 train, 120 test ConvNet + Feature Augmentation Kappa: 90.2, Acc: 94.8, AUC: 99.4
4 IDRiD, Messidor, APTOS 2019 516, 1,200, 3,662 DR (0-4), DME (0-2) 413 train, 103 test 2-D-FBSE-FAWT ACYavg: DR (95.5), DME (96.5)
2 ODIR, SSL, GTest 10,000, 2,023, 506 N, D, G, C, A, H, M 9,000 train/val MCG-Net, MCGS-Net Precision: (64.31, 65.88), Recall: (59.04, 61.60), Kappa: (55.27, 57.65), F1: (89.16, 89.67), AUC: (76.88, 78.16)
Figure 4: A System for Recognizing and Handling DR
Cases
Figure 5: Morphological Transformation Images
were gathered from all of the images to each of
the three classifiers independently. The classifiers
are lastly kept for testing. Similarly, the prepara-
tion stage also starts the testing process. Further-
more, the prediction values of each classifier are
regarded as votes, and the mode of votes is deter-
mined.
4 EVALUATION METRICS
Classifier Recall Precision
F-
Score
Accuracy
MobileNet 0.895 0.917 0.885 0.895
The performance of a classifier is evaluated
using the Accuracy, Precision, Recall, F1-Score, and
Specificity.
Accuracy:
The percentage of correctly categorized samples
among all samples is known as accuracy. It is de-
scribed as:
Accuracy =
T P + T N
T P + T N + FP + FN
Precision:
The percentage of true positive predictions among all
positive predictions is measured by precision, also
known as positive predictive value:
Precision =
T P
T P + FP
Recall:
The percentage of true positive predictions among all
real positive samples is measured by recall, which is
often referred to as sensitivity or true positive rate:
Recall =
T P
T P + FN
F1-Score:
The F1-Score provides a single statistic that balances
Precision and Recall by taking the harmonic mean of
the two:
F1-Score = 2 ×
Precision × Recall
Precision + Recall
Specificity:
Specificity (also called True Negative Rate) measures
the proportion of true negative predictions out of all
actual negative samples:
Specificity =
T N
T N + FP
Definitions:
Detection of Diabetic Retinopathy Using MobileNet Model
481
• The number of accurately predicted positive sam-
ples is known as True Positives (T P).
• The number of accurately predicted negative sam-
ples is known as True Negatives (T N).
• The number of falsely anticipated positive sam-
ples is known as False Positives (FP).
• The amount of negative samples that were mispre-
dicted is known as False Negatives (FN).
5 RESULTS AND DISCUSSION
This paper focuses on CNN model MobileNet, which
had already been trained and refined using the DR
dataset. Fundus images were divided into five severity
levels by the algorithm, which went from early stage
to advanced stage in DR. CNN automatically extracts
features from retinal images.To improve the network
even more, a fully linked layer is added after the two
layers used for feature extraction and selection. The
suggested method used the pre-trained CNN model
MobileNet,EfficientNetB0 which was fine-tuned with
the DR dataset. Fundus images were divided into five
severity levels by the algorithm, which went from no
DR to proliferative DR. CNN uses retinal scans to au-
tomatically extract characteristics. After the two lay-
ers used for feature extraction and selection, a fully
linked layer is added to further enhance the network.
First, we load the MobileNet architecture pretrained
on ImageNet, removing its top classification layer,
and freezing its weights. This allows us to build a se-
quential model.Then, we add a GlobalAveragePool-
ing2D layer to reduce spatial dimensions and flat-
ten features into a vector. Two Dense layers follow,
each employing ReLU activation and dropout for en-
hanced feature transformation. Finally, a Dense layer
for classification is attached with softmax activation.
The Adam optimizer with categorical cross-entropy
loss is used to construct the model. Training is done
with the retrieved features and labels, and variables
like batch size and epochs are adjusted based on the
particular issue.
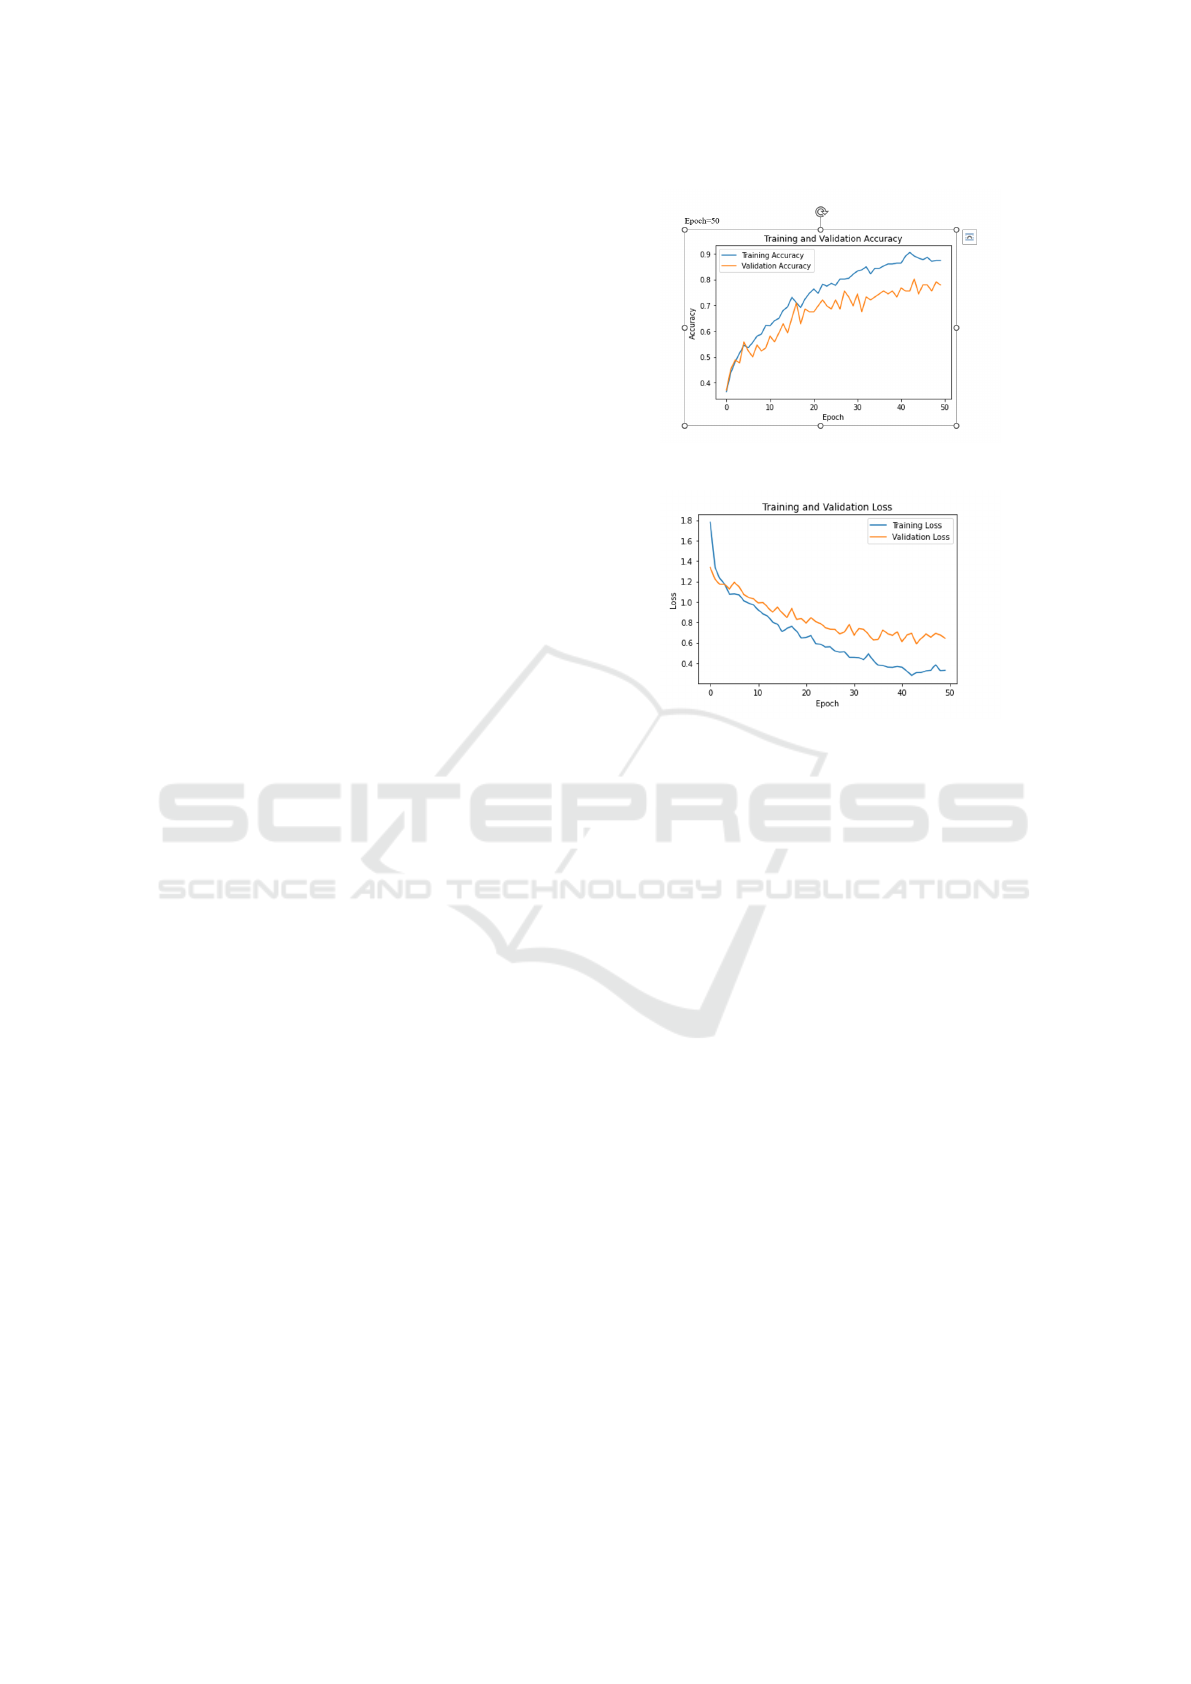
6 CONCLUSION
The proposed approach uses a scale of 0 to 4 to di-
agnose diabetic retinopathy, In this case, 0 denotes
no DR, 1 mild DR, 2 moderate DR, 3 severe DR,
and 4 proliferative DR. After analyzing various clas-
sification algorithms, it was discovered that the CNN
model MobileNet which is fine-tuned with DR dataset
is more efficient with an accuracy rate of 89.53%.
Figure 6: Training and Validation Accuracy graph
Figure 7: Training and Validation Loss graph
REFERENCES
Alahmadi, M. D. (2022). Texture attention network for
diabetic retinopathy classification. IEEE Access,
10:55522–55532.
Bilal, A., Sun, G., Li, Y., Mazhar, S., and Khan, A. Q.
(2021). Diabetic retinopathy detection and classi-
fication using mixed models for a disease grading
database. IEEE Access, 9:23544–23553.
Bindhumol, M., Singh, T., and Duraisamy, P. (2022). Di-
abetic retinopathy classification using transfer learn-
ing techniques. In 2022 13th International Confer-
ence on Computing Communication and Networking
Technologies (ICCCNT), pages 1–7. IEEE.
Chaudhary, P. K. and Pachori, R. B. (2022). Automatic di-
agnosis of different grades of diabetic retinopathy and
diabetic macular edema using 2-d-fbse-fawt. IEEE
Transactions on Instrumentation and Measurement,
71:1–9.
Chidambaram, N. and Vijayan, D. (2018). Detection of
exudates in diabetic retinopathy. In 2018 Interna-
tional Conference on Advances in Computing, Com-
munications and Informatics (ICACCI), pages 660–
664. IEEE.
Dharmana, M. M. and Aiswarya, M. (2020). Pre-diagnosis
of diabetic retinopathy using blob detection. In 2020
Second International Conference on Inventive Re-
search in Computing Applications (ICIRCA), pages
98–101. IEEE.
Hua, C.-H., Kim, K., Huynh-The, T., You, J. I., Yu, S.-Y.,
Le-Tien, T., Bae, S.-H., and Lee, S. (2020). Convo-
lutional network with twofold feature augmentation
for diabetic retinopathy recognition from multi-modal
INCOFT 2025 - International Conference on Futuristic Technology
482

images. IEEE Journal of Biomedical and Health In-
formatics, 25(7):2686–2697.
Nazih, W., Aseeri, A. O., Atallah, O. Y., and El-Sappagh,
S. (2023). Vision transformer model for predict-
ing the severity of diabetic retinopathy in fundus
photography-based retina images. IEEE Access,
11:117546–117561.
Patra, P. and Singh, T. (2022). Diabetic retinopathy de-
tection using an improved resnet50-inceptionv3 struc-
ture. In 2022 13th International Conference on Com-
puting Communication and Networking Technologies
(ICCCNT), pages 1–6. IEEE.
Praveena, S. and Lavanya, R. (2019). Superpixel based
segmentation for multilesion detection in diabetic
retinopathy. In 2019 3rd International Conference on
Trends in Electronics and Informatics (ICOEI), pages
314–319. IEEE.
Reddy, L. S. P., Ram, K. B. S., Vemu, N. V., Reddy, G. J.,
and Singh, T. (2022). A multifeatured based diabetic
retinopathy detection using hybrid-net. In 2022 13th
International Conference on Computing Communica-
tion and Networking Technologies (ICCCNT), pages
1–6. IEEE.
Shankar, K., Zhang, Y., Liu, Y., Wu, L., and Chen, C.-H.
(2020). Hyperparameter tuning deep learning for di-
abetic retinopathy fundus image classification. IEEE
Access, 8:118164–118173.
Wang, J., Bai, Y., and Xia, B. (2020a). Simultane-
ous diagnosis of severity and features of diabetic
retinopathy in fundus photography using deep learn-
ing. IEEE Journal of Biomedical and Health Infor-
matics, 24(12):3397–3407.
Wang, J., Yang, L., Huo, Z., He, W., and Luo, J. (2020b).
Multi-label classification of fundus images with effi-
cientnet. IEEE access, 8:212499–212508.
Zhou, Y., Wang, B., He, X., Cui, S., and Shao, L. (2020).
Dr-gan: conditional generative adversarial network
for fine-grained lesion synthesis on diabetic retinopa-
thy images. IEEE journal of biomedical and health
informatics, 26(1):56–66.
Detection of Diabetic Retinopathy Using MobileNet Model
483
