
Live Cell Stage Classification Using Deep Learning
Uma Mahesh R N, Kushal S M, Ponnanna K V, Sanjan B M and Vishnu S
Dept of CSE (AI&ML), ATME College of Engineering, Mysore, Karnataka, India
Keywords: Live Cell Imaging, Deep Learning, Sequential Convolutional Neural Network (SCNN), ResNet50,
EfficientNetB0, Cell Stage Classification, Interphase, Mitosis, Data Enrichment, Compound Scaling,
Receiver Operating Characteristic (ROC), Confusion Matrix, Transfer Learning, Imagenet Pretraining,
Explainable AI, Biomedical Applications, Cellular Behavior Studies.
Abstract: Live cell imaging has transformed biological research, offering real-time insight into dynamic cellular
processes. This project focuses on using deep learning techniques to automate the detection and
classification of live cell stages, specifically distinguishing between the interphase and mitosis phases.
Traditional methods, such as fluorescence microscopy and flow cytometry, are highly dependent on manual
or semiautomated, time-intensive and error-prone approaches. Our proposed solution employs advanced
deep learning architectures, including Sequential Convolutional Neural Network (SCNN), ResNet50, and
EfficientNetB0, to overcome these limitations. The data set used comprises high-resolution images of
nematode cells, preprocessed using resizing, normalization, and data augmentation techniques to ensure
robust model training. The performance of each model is evaluated on the basis of metrics such as accuracy,
positive predictive value (PPV), sensitivity, and the F1 score. In particular, EfficientNetB0 emerges as the
model with the best performance, achieving a test accuracy of 98%, showcasing its superior ability to
generalize in diverse data.
1 INTRODUCTION
Live cell imaging has transformed biological
research by enabling real-time observation of
cellular processes such as mitosis and signal
transduction. Despite its advantages, manual
analysis of live cell imaging data is time-consuming
and error-prone, especially in distinguishing phases
such as Interphase and Mitosis. This project
addresses these challenges using deep learning
methods, specifically a Sequential Convolutional
Neural Network (SCNN) and pretrained models like
ResNet50 and EfficientNetB0. These models
leverage compound scaling and transfer learning
from ImageNet to achieve high accuracy in binary
classification tasks. By automating live cell stage
classification, this project accelerates cellular
analysis, offering a scalable and efficient solution
for research and medical diagnostics, with
significant implications for cancer studies and drug
discovery.
1.1 Objective
The primary objective of this project is to develop an
automated system for live cell stage classification,
specifically distinguishing between Interphase and
Mitosis phases, to reduce reliance on manual
methods. State-of-the-art deep learning
architectures, including SCNN, ResNet50, and
EfficientNetB0, are utilized to ensure high accuracy
and efficiency. Data preprocessing techniques such
as resizing, normalization, and augmentation (e.g.,
rotations, flips, and brightness adjustments) are
implemented to enhance model robustness and
generalization. Model performance is evaluated
using metrics like accuracy, positive predictive value
(PPV), sensitivity, and F1-score, and ROC to ensure
consistent and reliable results. The system aims to
support biomedical research by enabling scalable
applications such as cellular behavior analysis,
cancer stage identification, and drug testing.
414
Mahesh R N, U., S M, K., K V, P., B M, S. and S, V.
Live Cell Stage Classification Using Deep Learning.
DOI: 10.5220/0013593300004664
Paper published under CC license (CC BY-NC-ND 4.0)
In Proceedings of the 3rd International Conference on Futuristic Technology (INCOFT 2025) - Volume 2, pages 414-421
ISBN: 978-989-758-763-4
Proceedings Copyright © 2025 by SCITEPRESS – Science and Technology Publications, Lda.

1.2 Literature Survey
The classification of cell cycle stages using deep
learning has been an active area of research. Several
studies have explored various methods and datasets
to enhance accuracy. Below is a summary of key
related works:
Robust Classification of Cell Cycle Phase and
Biological Feature Extraction by Image-Based Deep
Learning: Okada et al. (2020) proposed a method
using convolutional neural network (CNN) to
classify fluorescence images of cells into G1/S and
G2 phases without relying on specific cell cycle
markers. The study achieved an accuracy of
approximately 90%. Using Grad-CAM analysis, the
authors identified critical subcellular features that
contributed to the classification decisions. (Nagao,
Sakamoto, et al. , 2020).
Cell Cycle Stage Classification Using Phase
Imaging with Computational Specificity (PICS):
Nguyen et al. (2022) introduced a label-free deep
learning method for classifying cell cycle stages
based on single-shot quantitative Live Cell Stage
Classification Using Deep Learning phase imaging.
Their model achieved comparable accuracy to
traditional techniques, with atleast one stage in
interphase classification below 95% accuracy. (He,
Kandel, et al. , 2022).
Predicting Cell Cycle Stage from 3D Single-Cell
Nuclear-Stained Images: Li et al. (2024) applied a
CNN-based model to classify cell cycle stages using
3D nuclear-stained single-cell images. Their model
achieved an accuracy of 93%, showcasing the
potential of combining 3D imaging and deep
learning. (Li, Nichols, et al. , 2024).
Cell Cycle Classification Using Imaging Flow
Cytometry and Deep Learning: Zhang et al. (2022)
developed deep learning models, including a 2-layer
fully connected neural network, to classify cell cycle
stages from imaging flow cytometry data. Despite
exploring various architectures, the best-balanced
accuracy achieved was below 95%. This study
indicated room for improvement in both model
design and preprocessing techniques when using
imaging flow cytometry data for cell stage
classification (Rade, Zhang, et al. , 2022).
Deep Learning-Based Reconstruction of
Embryonic Cell-Division Cycle in Nematodes:
Wang et al. (2024) focused on the classification of
cell division stages in nematode embryos using
multiple CNN architectures. The models achieved
accuracies below 95%, highlighting the difficulties
associated with embryonic cell cycle stage
classification. This research pointed out the
challenges of dealing with complex and dynamic
datasets, particularly in embryonic imaging (Wang
et al. , 2024).
Each of these studies contributes valuable insights to
the field of cell cycle classification using deep
learning. However, the reported accuracies below
95% indicate significant opportunities for
improvement. The current project aims to build upon
these works by leveraging advanced architectures,
robust preprocessing techniques, and optimized
training methods to achieve higher accuracy and
scalability.
2 DESIGN AND PRINCIPLE OF
OPERATION
2.1 Proposed System
2.1.1 Data Preprocessing
The system begins with data preprocessing to en-
sure high-quality inputs for the models. The dataset
comprises high-resolution images of nematode cells
labeled as Interphase or Mitosis. Each image is
resized to 224 × 224 pixels and normalized to the
range [0, 1]. To enhance model robustness and
prevent over-fitting, data augmentation techniques
such as random rotations, flips, and brightness
adjustments are applied, ensuring the models
generalize effectively to unseen data.
2.1.2 Model Architectures
The proposed system employs three deep learning
models: SCNN, ResNet50, and EfficientNetB0. The
SCNN is a custom-built architecture that uses
convolutional layers for feature extraction, max-
pooling layers for dimensionality reduction, and
fully connected dense layers with dropout to
mitigate overfitting. ResNet50, pretrained on the
ImageNet dataset, is fine-tuned for binary
classification by replacing the final layers with task-
specific dense layers, leveraging residual learning to
address the vanishing gradient problem.
EfficientNetB0, known for its compound scaling,
balances network depth, width, and resolution,
making it both accurate and computationally
efficient. This model is fine-tuned for the current
application and achieves the best performance
among the three.
Live Cell Stage Classification Using Deep Learning
415
2.1.3 Training and Optimization
The models are trained using the Adam optimizer
with a dynamic learning rate scheduler, which
adjusts the learning rate during training for better
convergence. Binary cross-entropy loss is employed
as it is well-suited for binary classification tasks.
Throughout the training process, metrics such as
accuracy, loss, positive predictive value (PPV),
sensitivity, and F1-score are monitored to ensure
convergence and prevent overfitting.
2.1.4 Evaluation Metrics
The system’s performance is evaluated using a
variety of metrics. Accuracy measures the overall
correctness of the model, while positive predictive
value (PPV) and sensitivity quantify its ability to
correctly classify positive cases and retrieve all
relevant instances. The F1-score provides a balance
between positive predictive value (PPV) and
sensitivity. A confusion matrix visualizes
classification performance across the two classes,
and a Receiver Operating Characteristic (ROC)
analyzes the trade-off between sensitivity and
specificity, further validating the model’s reliability.
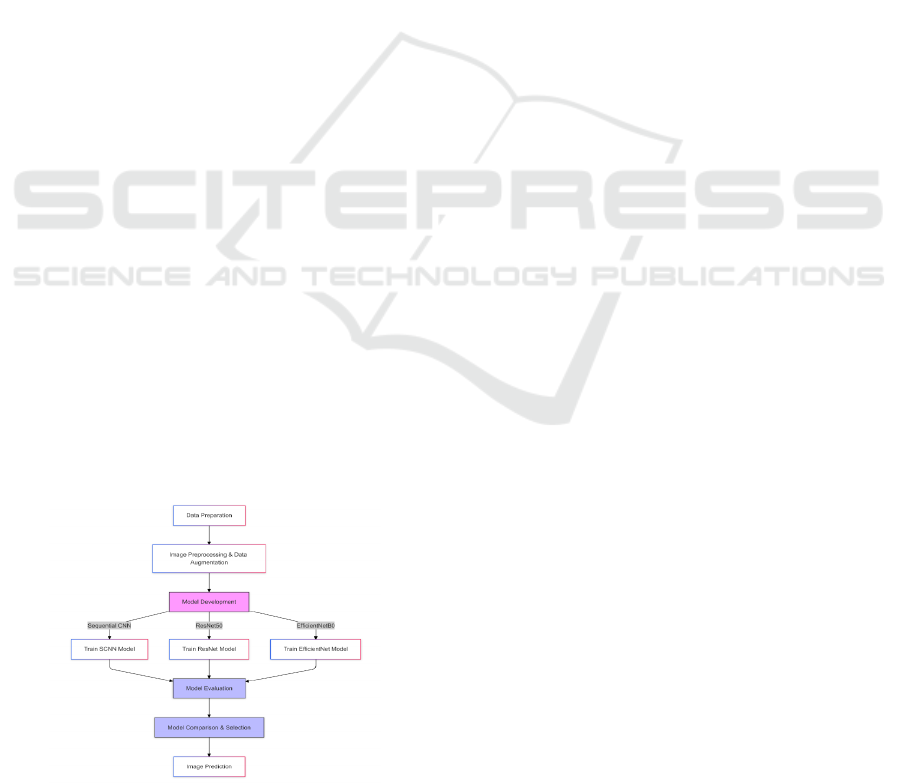
2.1.5 System Workflow
The system workflow begins with preprocessing the
input dataset, followed by training and fine-tuning
the three models. During the evaluation phase, the
models’ performance metrics are analyzed, and the
best-performing model, EfficientNetB0, is selected
for deployment. The system outputs the classified
cell stage (Interphase or Mitosis) with high
confidence.
2.2 Flow Chart of the Proposed System
Figure 1: Flow Chart of Proposed System
2.3 Methodology
The methodology for this project involves a systematic
approach to classify live cell stages, focusing on
Interphase and Mitosis phases. The process is divided into
several key steps: dataset preparation, preprocessing,
model architecture, training, and evaluation.
2.3.1 Dataset and Preprocessing
The dataset consists of high-resolution images of
nematode cells, labeled as either Interphase or
Mitosis. To ensure consistency, all images are
resized to 224 × 224 pixels and normalized to a
range of [0, 1]. This preprocessing step standardizes
the input for all models, enabling efficient training
and reducing computational overhead. Data
augmentation techniques are applied to improve
generalization and prevent overfitting. These
techniques include:
1. Random rotations to simulate various
orientations of cells.
2. Horizontal and vertical flips to account for
variability in image orientation.
3. Brightness adjustments to simulate
different imaging conditions.
2.3.2 Model Architectures
Three deep learning models are employed for
this task: Sequential Convolutional Neural Network
(SCNN), ResNet50, and EfficientNetB0. Each
model architecture is optimized to achieve high
accuracy and efficiency.
1) Sequential Convolutional Neural
Network (SCNN): The SCNN is a custom-
built model tailored for this application. It
consists of:
• Multiple convolutional layers for
feature extraction.
• Max-pooling layers to reduce spatial
dimensions and computational
complexity.
• Fully connected dense layers for
classification.
• Dropout layers to prevent overfitting
during training.
INCOFT 2025 - International Conference on Futuristic Technology
416
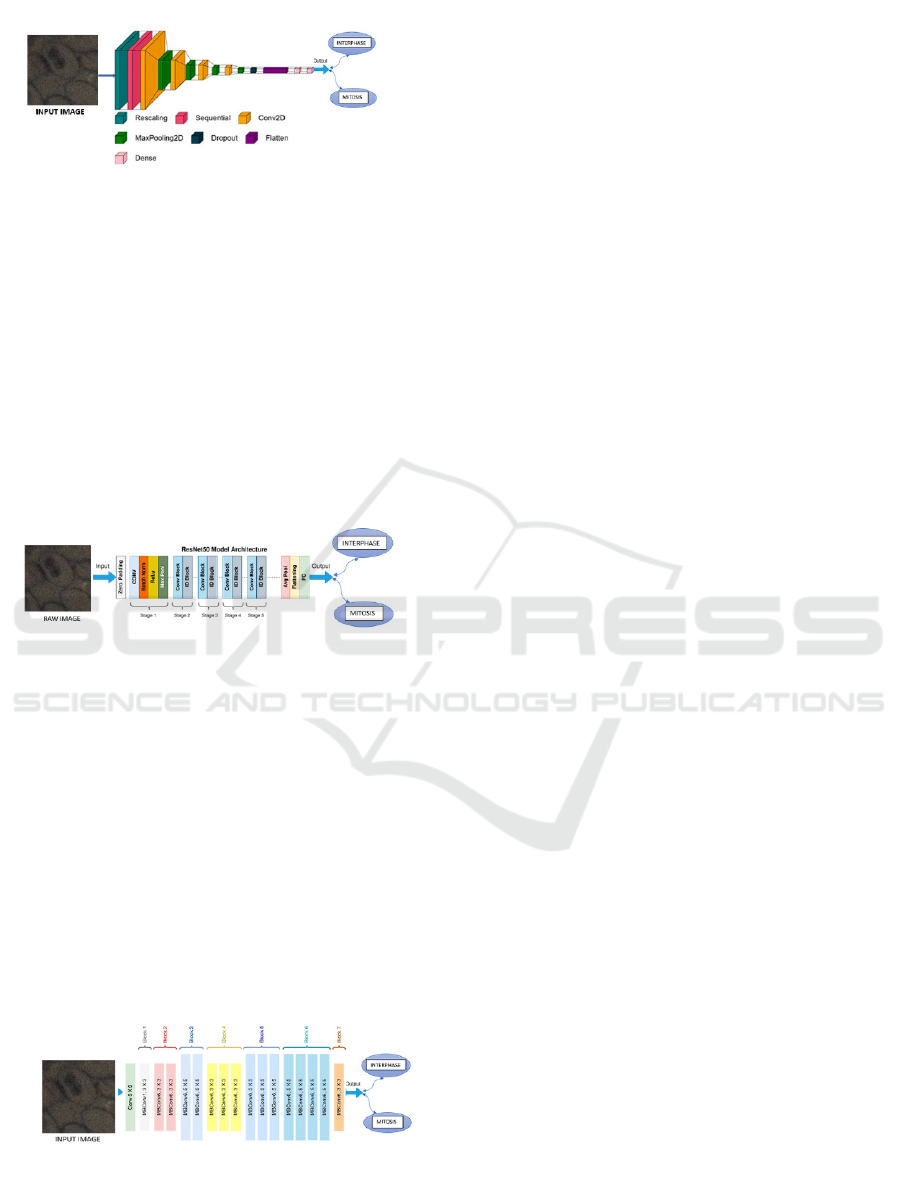
Figure 2: Architecture of Sequential CNN
2) ResNet50: ResNet50, a well-established
model pretrained on ImageNet, is utilized
for its residual learning capabilities. The
key features include:
• Residual blocks that mitigate the
vanishing gradient problem.
• Pretrained weights from ImageNet,
fine-tuned for binary classification.
• A final dense layer customized for the
classification of Interphase and
Mitosis.
Figure 3: Architecture of ResNet50 model used in the
proposed system.
3) EfficientNetB0: EfficientNetB0 is chosen
for its compound scaling capabilities,
optimizing depth, width, and resolution for
maximum accuracy and computational
efficiency. Its key features include:
• Balanced architecture using compound
scaling for resource optimization.
• Pretrained on ImageNet and fine-tuned
for this application.
• Superior generalization capabilities,
making it the best-performing model in
this study.
Figure 4: Architecture of EfficientNetB0 model.
2.3.3 Training and Optimization
The models are trained using the following settings:
• Optimizer: Adam optimizer with an initial
learning rate of 0.001.
• Loss Function: Binary cross-entropy loss,
suitable for binary classification tasks.
• Batch Size: 32 images per batch for
balanced training.
• Epochs: Models are trained for up to 50
epochs, with early stopping based on
validation accuracy.
• Learning Rate Scheduler: Dynamically
adjusts the learning rate to optimize
convergence.
2.3.4 Evaluation Metrics
The performance of the models is evaluated
using the following metrics:
• Accuracy: Measures the overall
correctness of predictions.
• Positive Predictive Value (PPV):
Calculates the ratio of label true positive
(TP) predictions to total predicted positives.
• Sensitivity: Measures the model’s ability to
identify all relevant instances (true
positives (TP)).
• F1-Score: Provides a balance between
positive predictive value (PPV) and
sensitivity.
• Confusion Matrix: Visualizes the
classification performance for each class.
• Receiver Operating Characteristic
(ROC): Evaluates the trade-off between
sensitivity and specificity.
2.3.5 System Workflow
The workflow of the proposed methodology is out-
lined as follows:
1) Preprocess the dataset by resizing,
normalizing, and augmenting the images.
2) Train the three models (SCNN, ResNet50,
and EfficientNetB0) using the prepared
dataset.
3) Evaluate model performance on test data
using the defined metrics.
4) Select the best-performing model,
Efficient-NetB0, for deployment based on
accuracy, positive predictive value (PPV),
sensitivity, and F1-score.
Live Cell Stage Classification Using Deep Learning
417

2.3.6 Model Architectures
• Sequential CNN: Features are extracted
using multiple Conv2D and MaxPooling2D
layers, followed by fully connected Dense
layers.
• ResNet50: Pretrained on ImageNet, it
utilizes residual learning for feature
extraction. The final layers are customized
for binary classification.
• EfficientNetB0: With compound scaling,
this model optimizes accuracy and
computational efficiency.
2.4 Implementation
The implementation of this project involves de-
signing and training deep learning models to classify
live cell stages. The following steps outline the com-
plete implementation process, from data preparation
to model evaluation:
2.4.1 Data Preparation
The dataset consists of labeled high-resolution
images of nematode cells categorized as Interphase
or Mitosis. The preprocessing pipeline includes:
• Resizing: All images are resized to 224 ×
224 pixels to maintain uniformity across
the dataset.
• Normalization: Pixel values are scaled to a
range of [0, 1] to ensure faster and more
stable convergence during training.
• Data Augmentation: Techniques such as
random rotations, horizontal and vertical
flips, and bright- ness adjustments are
applied to enhance dataset variability and
prevent overfitting.
2.4.2 Model Training
Three deep learning models—Sequential
Convolutional Neural Network (SCNN), ResNet50,
and EfficientNetB0—were implemented and trained
using TensorFlow for the binary classification of
Interphase and Mitosis stages. The SCNN was
custom-built with convolutional, max-pooling,
dense, and dropout layers to extract features and
prevent overfitting. ResNet50 and EfficientNetB0,
pretrained on ImageNet, were finetuned for the task
with their final layers replaced by task-specific
dense layers. Training utilized the Adam optimizer
with an initial learning rate of 0.001, binary cross-
entropy loss, and a batch size of 32 for upto 50
epochs, with early stopping based on validation loss
to avoid overfitting. A learning rate scheduler was
employed to ensure optimal convergence.
2.4.3 Evaluation Pipeline
The trained models were evaluated using a test
set. Various metrics were calculated to assess the
performance of each model:
Accuracy: The ratio of correctly predicted
instances to the total number of instances.
Positive predictive value (PPV): The
proportion of label true positive (TP) predictions
among all positive predictions.
Sensitivity: The proportion of label true positive
(TP) correctly identified out of all actual positives.
F1-Score: The harmonic mean of positive
predictive value (PPV) and sensitivity, providing a
balanced evaluation metric.
Confusion Matrix: A detailed breakdown of
label true positives (TP), true negatives (TN), false
positives (FP), and false negatives (FN).
Receiver Operating Characteristic (ROC): A
graphical representation of the trade-off between
sensitivity and specificity.
2.4.4 Implementation Workflow:
The complete workflow of the implementation is as
follows:
• Dataset Preparation: Preprocessing and
augmenting the dataset to create a robust
input pipeline.
• Model Training: Training the SCNN,
ResNet50, and EfficientNetB0 models on
the preprocessed dataset.
• Performance Evaluation: Using the
evaluation pipeline to compute metrics for
each model.
• Model Selection: Selecting EfficientNetB0
as the best-performing model based on its
superior accuracy of 98%.
• Deployment: Preparing the final trained
EfficientNetB0 model for integration into
biomedical research workflows.
2.4.5 Implementation Tools and
Environment
The following tools and libraries were used for
implementation:
• Programming Language: Python 3.8.
INCOFT 2025 - International Conference on Futuristic Technology
418
• Deep Learning Framework: TensorFlow
and Keras for model design, training, and
evaluation.
• Hardware: NVIDIA GPU for accelerated
training.
• Development Environment: Google
Colab and Jupyter Notebook for coding and
experimentation.
This implementation pipeline ensures a robust and
scalable system for automating live cell stage
classification while maintaining high accuracy and
computational efficiency.
3 SIMULATION RESULTS AND
ANALYSIS
This section presents the outcomes of the imple-
mented deep learning models for classifying live
cell stages into Interphase and Mitosis. The results
are evaluated using various metrics and
visualizations to demonstrate the performance of the
models and compare their effectiveness.
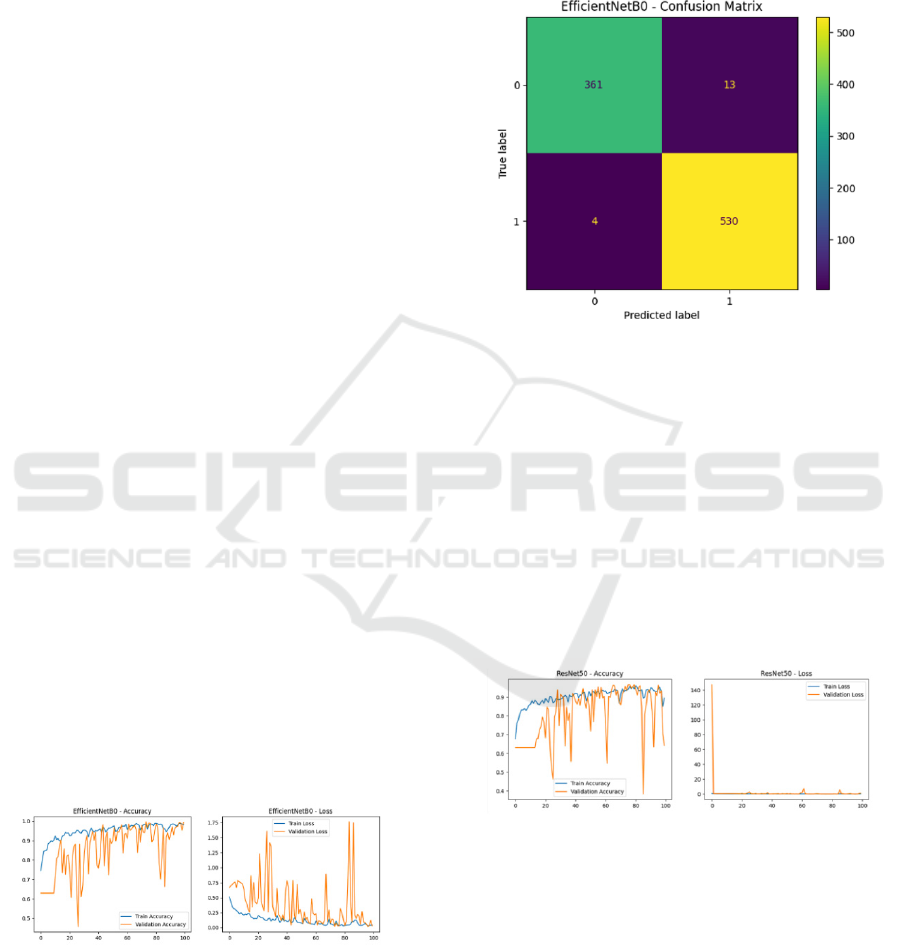
3.1 EfficientNetB0
The EfficientNetB0 model outperformed other
models with consistent performance across training,
validation, and test datasets:
• Training Accuracy: The model achieved
a high training accuracy of 98%.
• Validation Accuracy: A validation
accuracy of 99% demonstrated excellent
generalization.
• Test Accuracy: The test accuracy of 98%
confirmed the robustness of the model on
unseen data.
Performance Visualizations:
Figure 5. Loss and accuracy graphs on training and
validation sets for EfficientNetB0.
Confusion Matrix: The confusion matrix for
EfficientNetB0 highlights its strong classification
performance:
• True Positives (Mitosis): 361
• True Negatives (Interphase): 530
• False Positives: 13
• False Negatives: 4
Figure 6: Confusion Matrix for EfficientNetB0.
3.2 ResNet50
The ResNet50 model demonstrated competitive
performance but underperformed compared to
Efficient-NetB0:
• Training Accuracy: 90%.
• Validation Accuracy: 85%.
• Test Accuracy: 76%.
Performance Visualizations:
Figure 7: Loss and accuracy graphs on training and
validation sets for ResNet50.
Confusion Matrix: The confusion matrix for
ResNet50 revealed:
• True Positives (Mitosis): 534
• True Negatives (Interphase): 159
• False Positives: 0
• False Negatives: 215
Live Cell Stage Classification Using Deep Learning
419
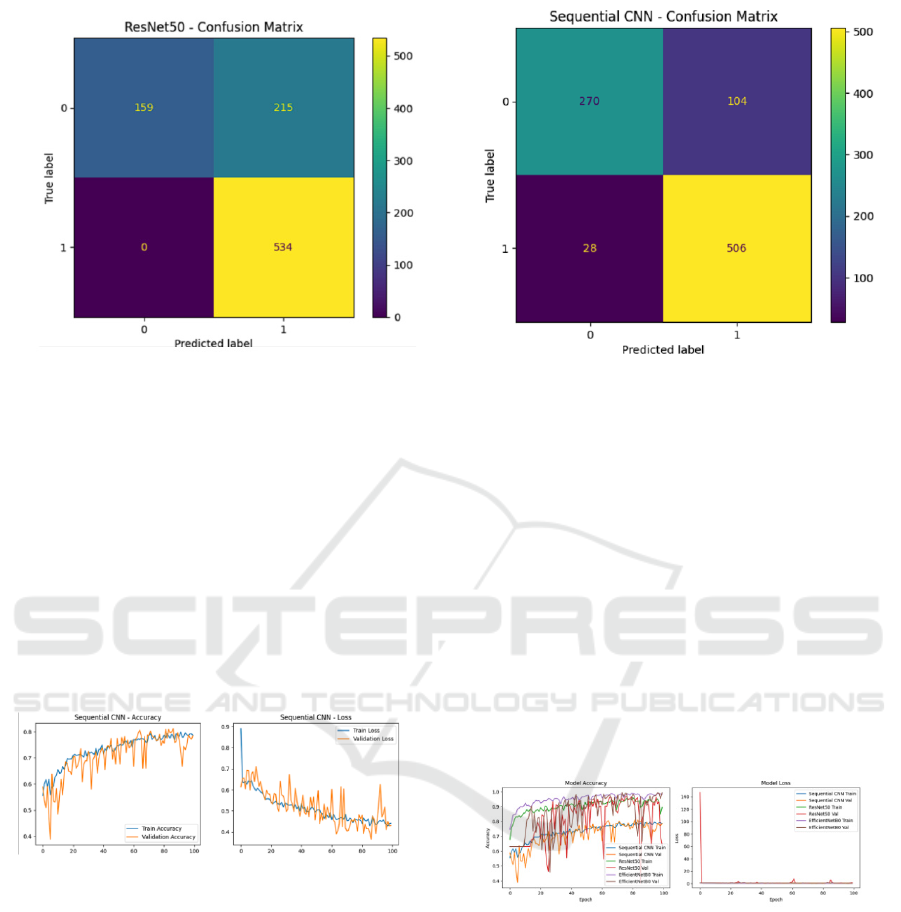
Figure 8: Confusion Matrix for ResNet50.
3.3 Sequential Convolutional Neural
Network (SCNN)
SCNN showed the lowest performance among the
three models:
• Training Accuracy: 76%.
• Validation Accuracy: 80%.
• Test Accuracy: 85%.
Performance Visualizations:
Figure 9: Loss and accuracy graphs on training and
validation sets for sequential convolutional neural network
(SCNN)
Confusion Matrix: The confusion matrix for SCNN
highlighted:
• True Positives (Mitosis): 506
• True Negatives (Interphase): 270
• False Positives: 28
• False Negatives: 104
Figure 10: Confusion Matrix for SCNN.
3.4 Comparison of Models
The three models were compared based on their
performance metrics:
• EfficientNetB0: Achieved the highest
accuracy and most stable performance
across all datasets, with minimal
fluctuations in validation accuracy and loss.
• ResNet50: Demonstrated moderate
performance, with occasional spikes in
validation loss and lower test accuracy.
• SCNN: Struggled with generalization and
stability, exhibiting fluctuations in
validation performance and relatively lower
test accuracy.
Figure 11: Comparison of Training and Validation Curves
for SCNN, ResNet50, and EfficientNetB0.
3.5 Key Findings
• EfficientNetB0: The best-performing model
with 98% test accuracy and superior
generalization, making it ideal for
deployment.
• ResNet50: While effective, it was less
stable and accurate compared to
EfficientNetB0.
INCOFT 2025 - International Conference on Futuristic Technology
420

• SCNN: Demonstrated limitations in
learning complex patterns, leading to lower
accuracy and inconsistent performance.
• EfficientNetB0 achieved superior accuracy
of 98%, significantly outperforming
ResNet50 and Sequential CNN. Table 1
summarizes the performance metrics.
Table 1: Performance Metrics of Models.
Model Accura
c
y
PPV Sensitivit
y
F1-
Score
SCNN 85% 82% 84% 83%
ResNet50 90% 88% 89% 88.5%
Efficient
Net
98% 97% 98% 97.5%
4 CONCLUSIONS
This project successfully demonstrates the use of
deep learning models for automating live cell stage
classification, focusing on Interphase and Mitosis.
Among the models evaluated, EfficientNetB0
achieved the highest performance with 98% test
accuracy, highlighting its superior generalization
and efficiency. The preprocessing techniques,
combined with metrics like accuracy, positive
predictive value (PPV), sensitivity, and confusion
matrices, ensured robust and reliable evaluations.
This system reduces manual effort and accelerates
cellular analysis, with potential applications in
cancer research, drug discovery, and biomedical
diagnostics. Future work will aim to extend
classification to all cell cycle stages and improve
model integration for real-world applications.
REFERENCES
Nagao, Y., Sakamoto, M., Chinen, T., Okada, Y. and
Takao, D.,2020. ”Robust classification of cell cycle
phase and biological feature extraction by image-
based deep learning”, Molecular biology of the cell,
31(13), pp.1346-1354.
He, Y.R., He, S., Kandel, M.E., Lee, Y.J., Hu, C., Sobh,
N., Anastasio, M.A. and Popescu, G., 2022. ”Cell
cycle stage classification using phase imaging with
computational specificity”, ACS photonics, 9(4),
pp.1264-1273.
Li, G., Nichols, E.K., Browning, V.E., Longhi, N.J.,
Camplis-son, C., Beliveau, B.J. and Noble, W.S.,
2024. ”Predicting cell cycle stage from 3D single-cell
nuclear-stained images”, bioRxiv.
Bernal, C.E., ”Cell Cycle Classification using Imaging
Flow Cytometry and Deep Learning”.
Khatri, D. and Athale, C.A., 2024. ”Deep learning-based
reconstruction of embryonic cell-division cycle from
label-free microscopy time-series of evolutionarily
diverse nematodes”, bioRxiv, pp.2024-05.
Rade, J., Zhang, J., Sarkar, S., Krishnamurthy, A., Ren, J.
and Sarkar, A., 2022. ”Deep learning for live cell
shape detection and automated afm navigation”,
Bioengineering, 9(10), p.522.
Rotman-Nativ, N. and Shaked, N.T., 2021. ”Live cancer
cell classification based on quantitative phase spatial
fluctuations and deep learning with a small training
set”, Frontiers in Physics, 9, p.754897.
Pattarone, G., Acion, L., Simian, M., Mertelsmann, R.,
Follo, M. and Iarussi, E., 2021. ”Learning deep
features for dead and living breast cancer cell
classification without staining”, Scientific reports,
11(1), p.10304.
Padovani, F., Mairh¨ormann, B., Falter-Braun, P.,
Lengefeld, J. and Schmoller, K.M., 2022.
”Segmentation, tracking and cell cycle analysis of
live-cell imaging data with Cell-ACDC”, BMC
biology, 20(1), p.174.
Gallusser, B., Stieber, M. and Weigert, M., 2023, October,
“Self-supervised dense representation learning for
live-cell microscopy with time arrow prediction”, In
International Conference on Medical Image
Computing and Computer-Assisted Intervention (pp.
537-547). Cham: Springer Nature Switzerland.
Bhandary, M., Reyes, J.P., Ertay, E. and Panda, A., 2022,
“Double U-Net for Super-Resolution and
Segmentation of Live Cell Images”, arXiv preprint
arXiv:2212.02028.
Jang, J., Lee, K. and Kim, T.K., 2023, “Unsupervised
Contour Tracking of Live Cells by Mechanical and
Cycle Consistency Losses”, In Proceedings of the
IEEE/CVF Conference on Computer Vision and
Pattern Recognition (pp. 227-236).
Mahesh, U. and Kiran, B., 2024, July. Three-dimensional
(3-D) objects classification by means of phase-only
digital holographic information using Alex Network.
In 2024 International Conference on Signal
Processing, Computation, Electronics, Power and
Telecommunication (IConSCEPT) (pp. 1-5). IEEE.
Live Cell Stage Classification Using Deep Learning
421
